Hard Assets in an Era of Soft Money

As global central banks quietly rearm their stimulus arsenals and fiscal deficits spiral past the point of discipline, the foundations of the global monetary order are beginning to crack. Amid this shift, one question looms larger than ever: Are we on the verge of a new commodity supercycle?
Unlike short-lived price rallies, commodity supercycles are long, structural, and deeply rooted in macroeconomic transformation. They emerge when global capital pivots—toward infrastructure, industrial expansion, or strategic security. And today, we’re seeing a confluence of forces not witnessed in decades: a weakening U.S. dollar, unchecked fiscal expansion across major economies, and a growing consensus that hard assets—energy, metals, and even bitcoin—are the final shelter in a world of evaporating trust in fiat.
Policymakers may speak of normalization, but their actions scream stimulus. From Asia to Europe to the Americas, monetary easing is creeping back into play even as inflation lingers. Meanwhile, as Washington leans harder into deficit-financed ambitions and geopolitical fragmentation accelerates, capital is beginning to migrate toward scarcity—and away from paper promises.
Before we rush to declare the dawn of another commodity renaissance, it’s worth stepping back and understanding the cycles that came before—and why this one may be fundamentally different.
What Is a Commodity Supercycle?
A commodity supercycle is a prolonged period, often lasting 10 to 20 years, during which commodity prices remain elevated due to long-lasting shifts in demand that significantly outpace supply capacity. These episodes typically arise not from fleeting imbalances but from epoch-defining events that reshape economic behavior—be it industrial revolutions, population booms, or sweeping policy transformations. While each cycle has its own defining characteristics, common threads include bottlenecks in supply, surges in capital expenditures, and strategic stockpiling.
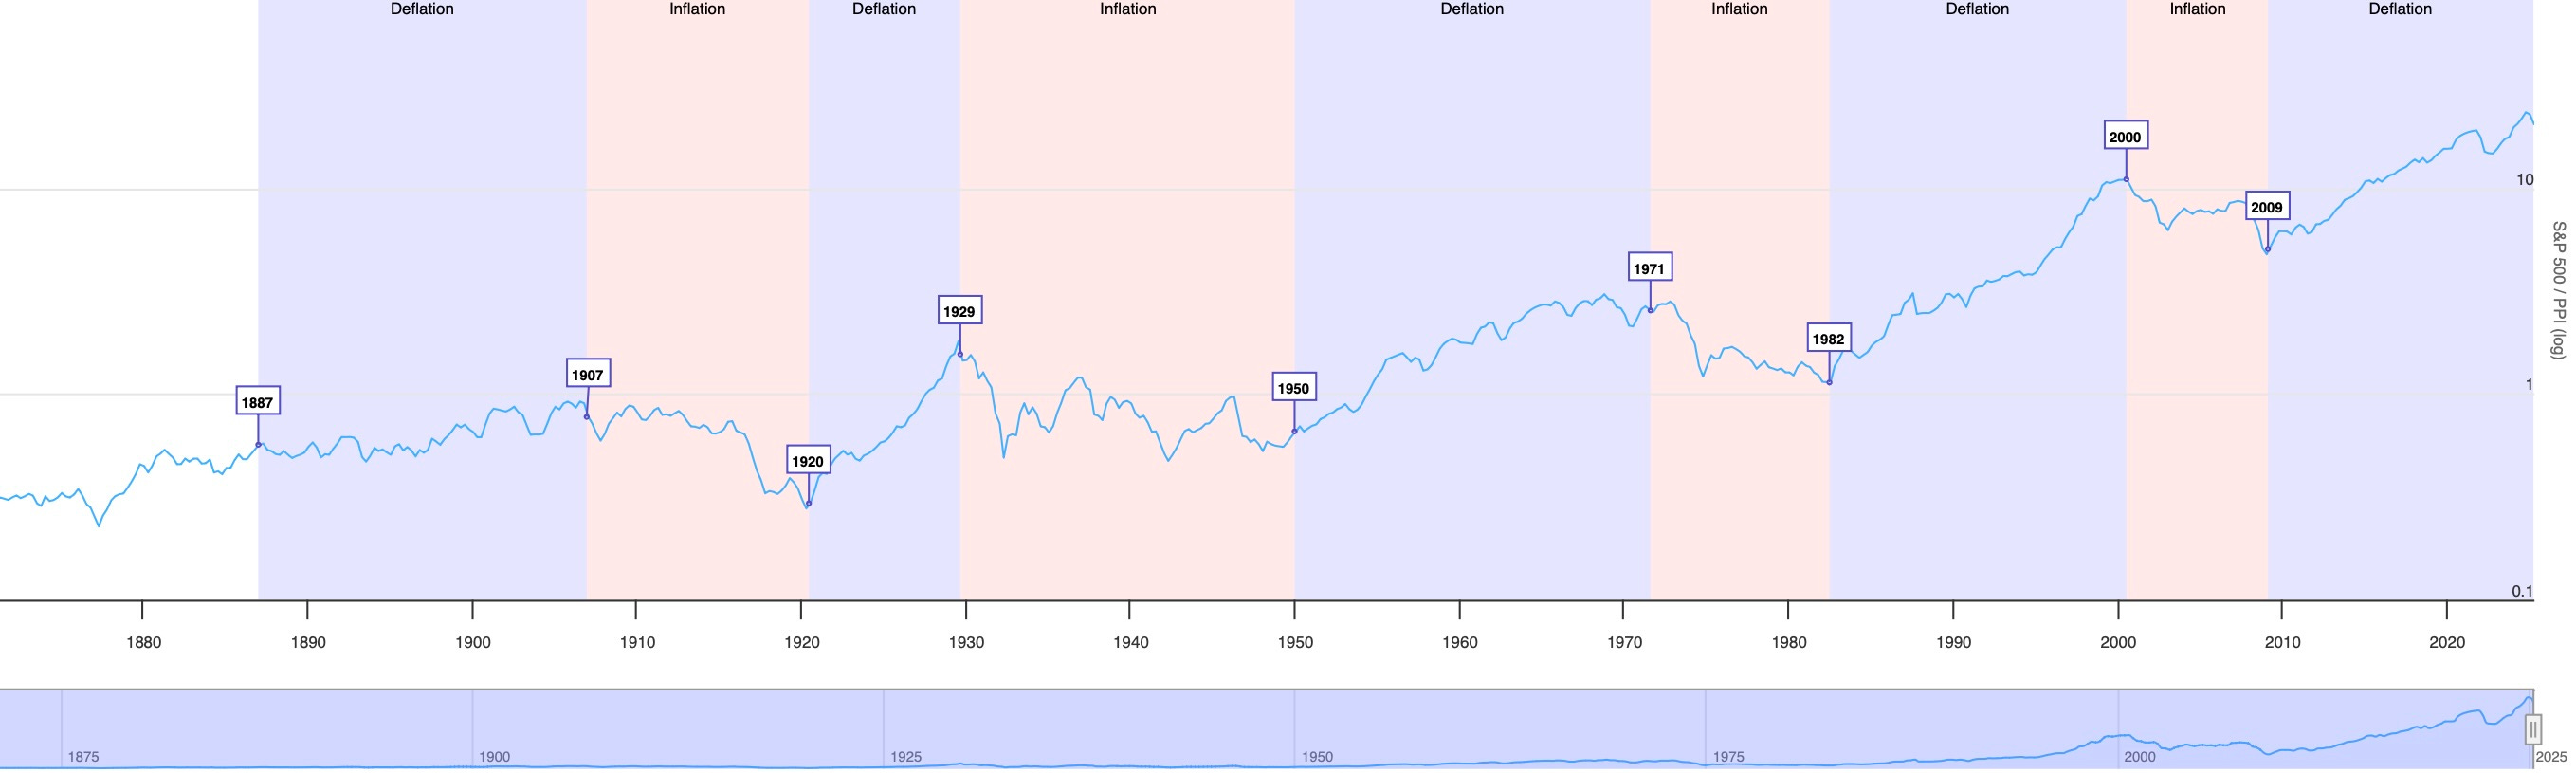
The chart below shows the long-term ratio of the S&P 500 to the Producer Price Index (PPI), illustrating cycles of stock vs. commodity outperformance. When the ratio rises, equities outperform; when it falls, commodities lead. Over nearly 150 years, markets have oscillated between inflationary and deflationary regimes—roughly every 18 years. Stocks tend to thrive during deflationary periods tied to sound money systems (e.g., Gold Standard, Bretton Woods), while commodities dominate during inflationary cycles often triggered by wars, monetary shocks, or loose fiscal policy. This negative correlation reflects their positioning in the credit cycle: equities peak in early expansions, commodities in late ones.
A Closer Look at Past Supercycles:
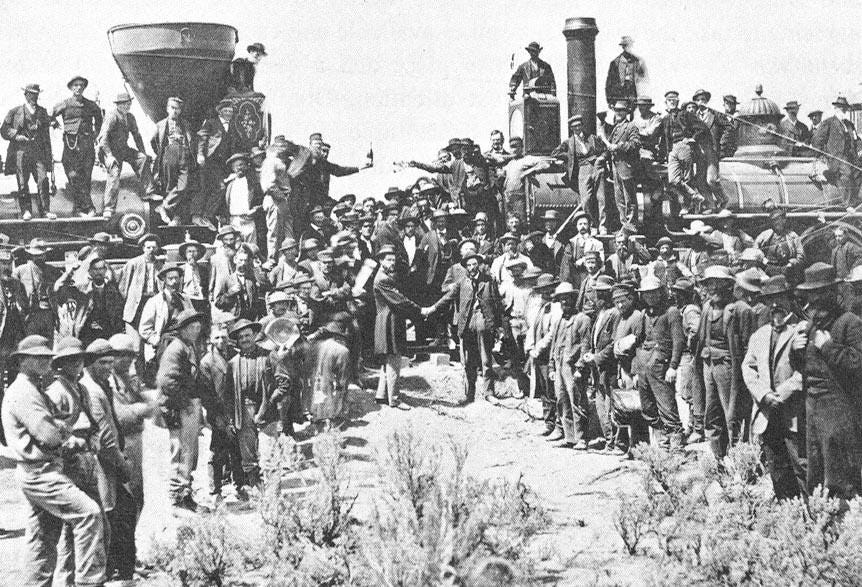
- Industrialization & Urbanization (1890s–1914)
The earliest modern supercycle coincided with the Second Industrial Revolution. The rapid electrification of cities, expansion of transcontinental railroads, and invention of mechanized manufacturing techniques triggered a voracious appetite for raw materials. Steel demand soared as nations raced to build infrastructure. Coal became the lifeblood of industry and transport. Cotton and timber fed booming textile mills and housing construction. The United States, Germany, and Britain led this charge, transforming their economies through intensive capital formation. Global trade flourished as shipping lines extended across oceans to move raw inputs from colonies and developing regions to industrial centers. This cycle was ultimately disrupted by World War I, which diverted resources to the war effort and fractured the global trade system.
Top Performing Commodities:
Steel +120% – U.S. steel mill prices, driven by infrastructure boom (U.S. Census, Hist. Stats)
Coal +135% – Industrial and railway expansion (UK Board of Trade, 1910)
Timber +95%, Cotton +80% – Inflation-adjusted commodity growth (Maddison Project DB)
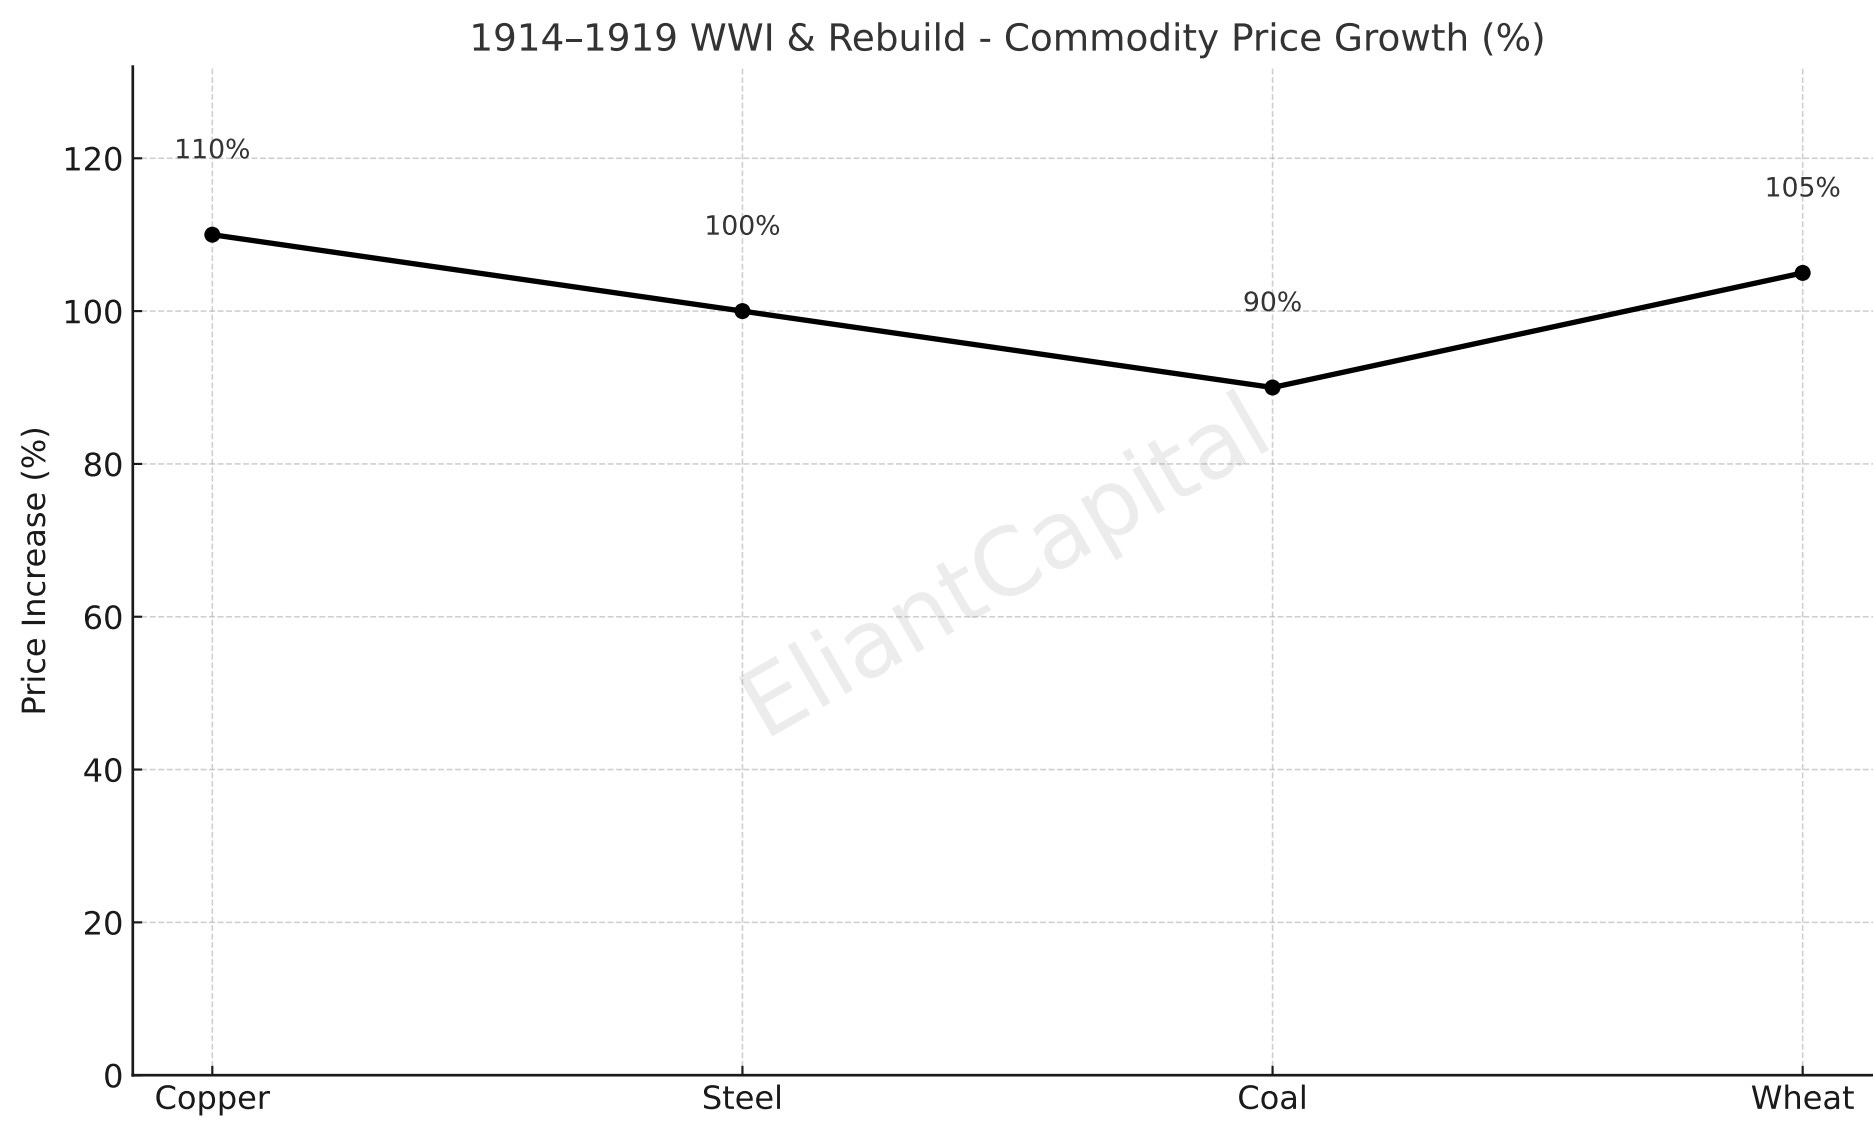
- World War I and Reconstruction (1914–1919)
Though brief, this period brought an intense concentration of demand for materials essential to modern warfare—steel for armaments, copper for wiring and communications, coal for energy, and wheat to feed armies. Industrial production was repurposed on a massive scale, with agriculture and resource extraction operating under national mandates. Supply chains were chaotic, labor was scarce, and prices were volatile. Following the war, attempts at reconstruction were stunted by inflation, war debt, and economic dislocation. Nonetheless, this cycle highlighted how wartime economies can act as compressed supercycles.
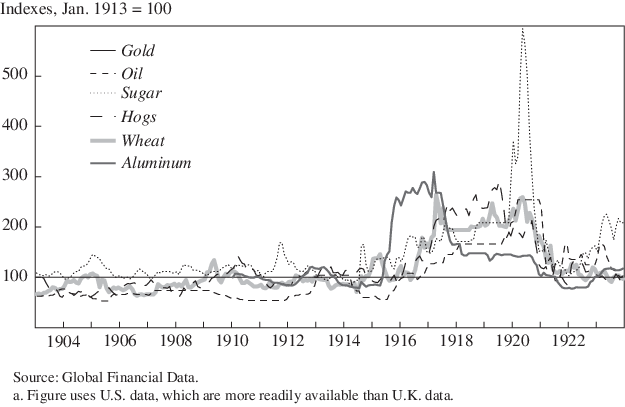
Top Performing Commodities:
Copper +110% – Military wiring/equipment demand (USGS, 1915–1920)
Steel +100%, Coal +90% – Wartime industrial output (NBER War Economies)
Wheat +105% – Ag supply shock & rationing (Fed Reserve Wheat Index)
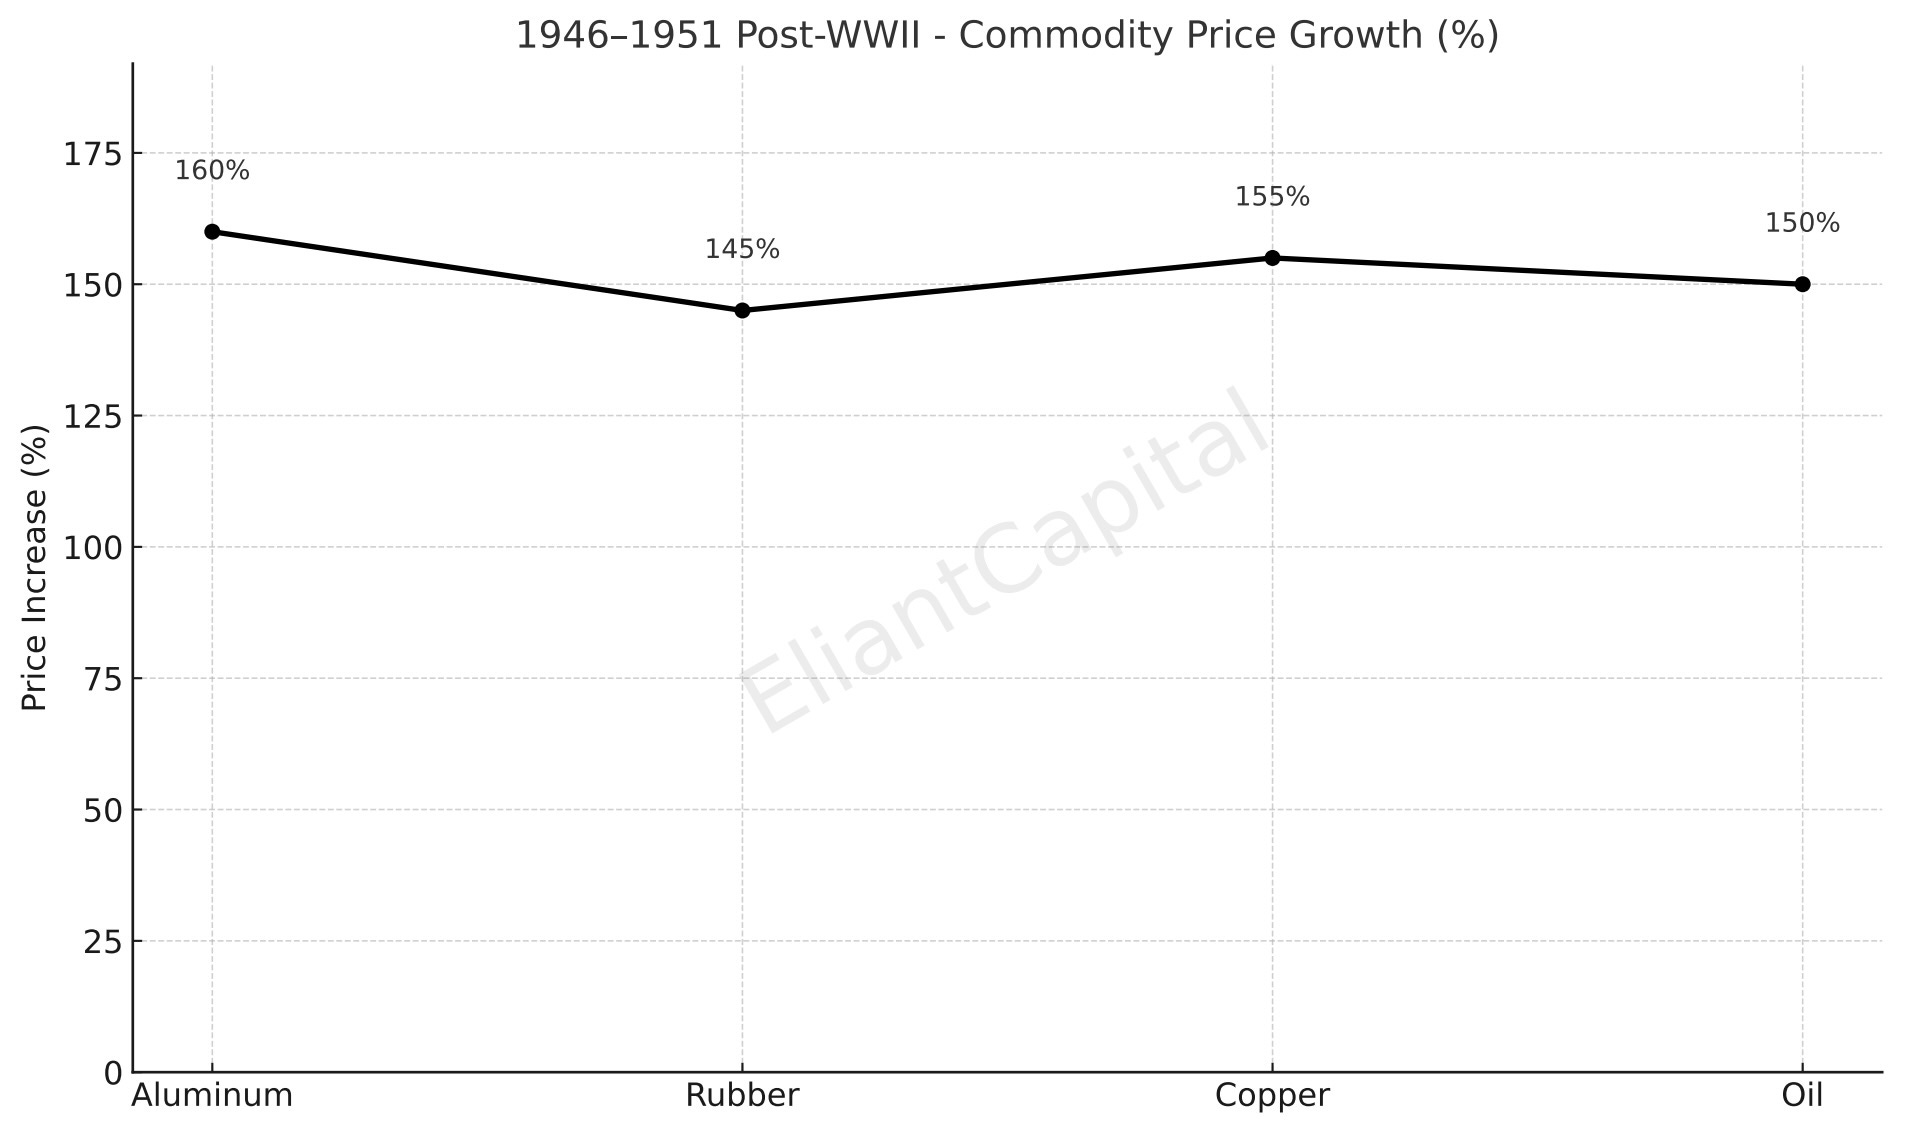
- Post-WWII Reconstruction (1946–1951)
The devastation of World War II left Europe and Asia in ruins, and rebuilding efforts kicked off one of the largest coordinated infrastructure booms in history. The U.S.-backed Marshall Plan funneled capital into construction, manufacturing, and transportation. Demand for aluminum, copper, oil, and rubber skyrocketed. Simultaneously, the Cold War catalyzed military production, while consumer demand for housing and automobiles surged. The creation of global institutions such as the IMF and World Bank helped stabilize capital markets and underwrite cross-border trade and infrastructure. This brief but intense cycle normalized global commodity flows and laid the foundation for modern multilateral finance.

Top Performing Commodities:
Aluminum +160% – Post-war aircraft & construction (World Bank DB)
Copper +155%, Rubber +145% – Marshall Plan & reindustrialization (OECD)
Oil +150% – Transport & global energy rebound (BP Stat. Review, 1955)
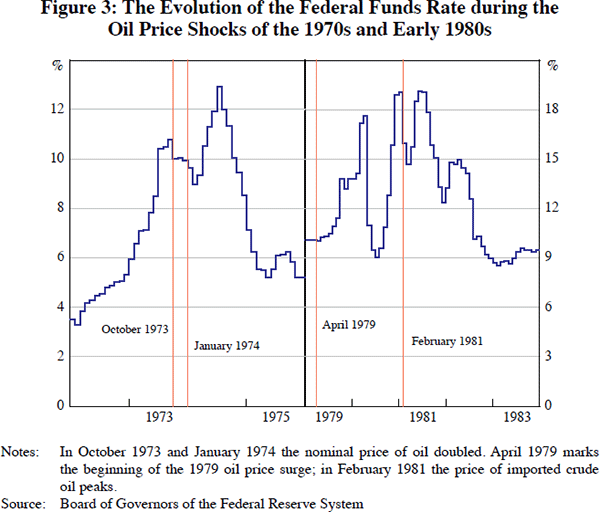
- The Oil and Inflation Shock (1971–1980)
This supercycle unfolded against a backdrop of deep monetary instability. After the U.S. ended the gold standard in 1971, inflation accelerated sharply. The 1973 oil embargo by OPEC—and the subsequent 1979 Iranian Revolution—led to an unprecedented spike in energy prices. Oil became a geopolitical weapon. At the same time, gold, silver, and agricultural commodities surged as investors sought refuge from currency devaluation. The decade was marked by stagflation, fiscal deficits, and protectionist sentiment. It ended when the U.S. Federal Reserve, under Paul Volcker, enacted a dramatic tightening of monetary policy, triggering a global recession and collapsing commodity prices.
The chart below illustrates how the Federal Reserve responded to the oil price shocks of the 1970s and early 1980s by aggressively raising interest rates—particularly in 1974, 1980, and 1981. Evidence points to oil shocks primarily acting through demand-side channels—reducing household purchasing power and triggering recessions—rather than through persistent inflation. This implies that central banks may have overreacted by hiking rates, mistaking temporary inflationary pressures for structural threats, and unintentionally deepening downturns.
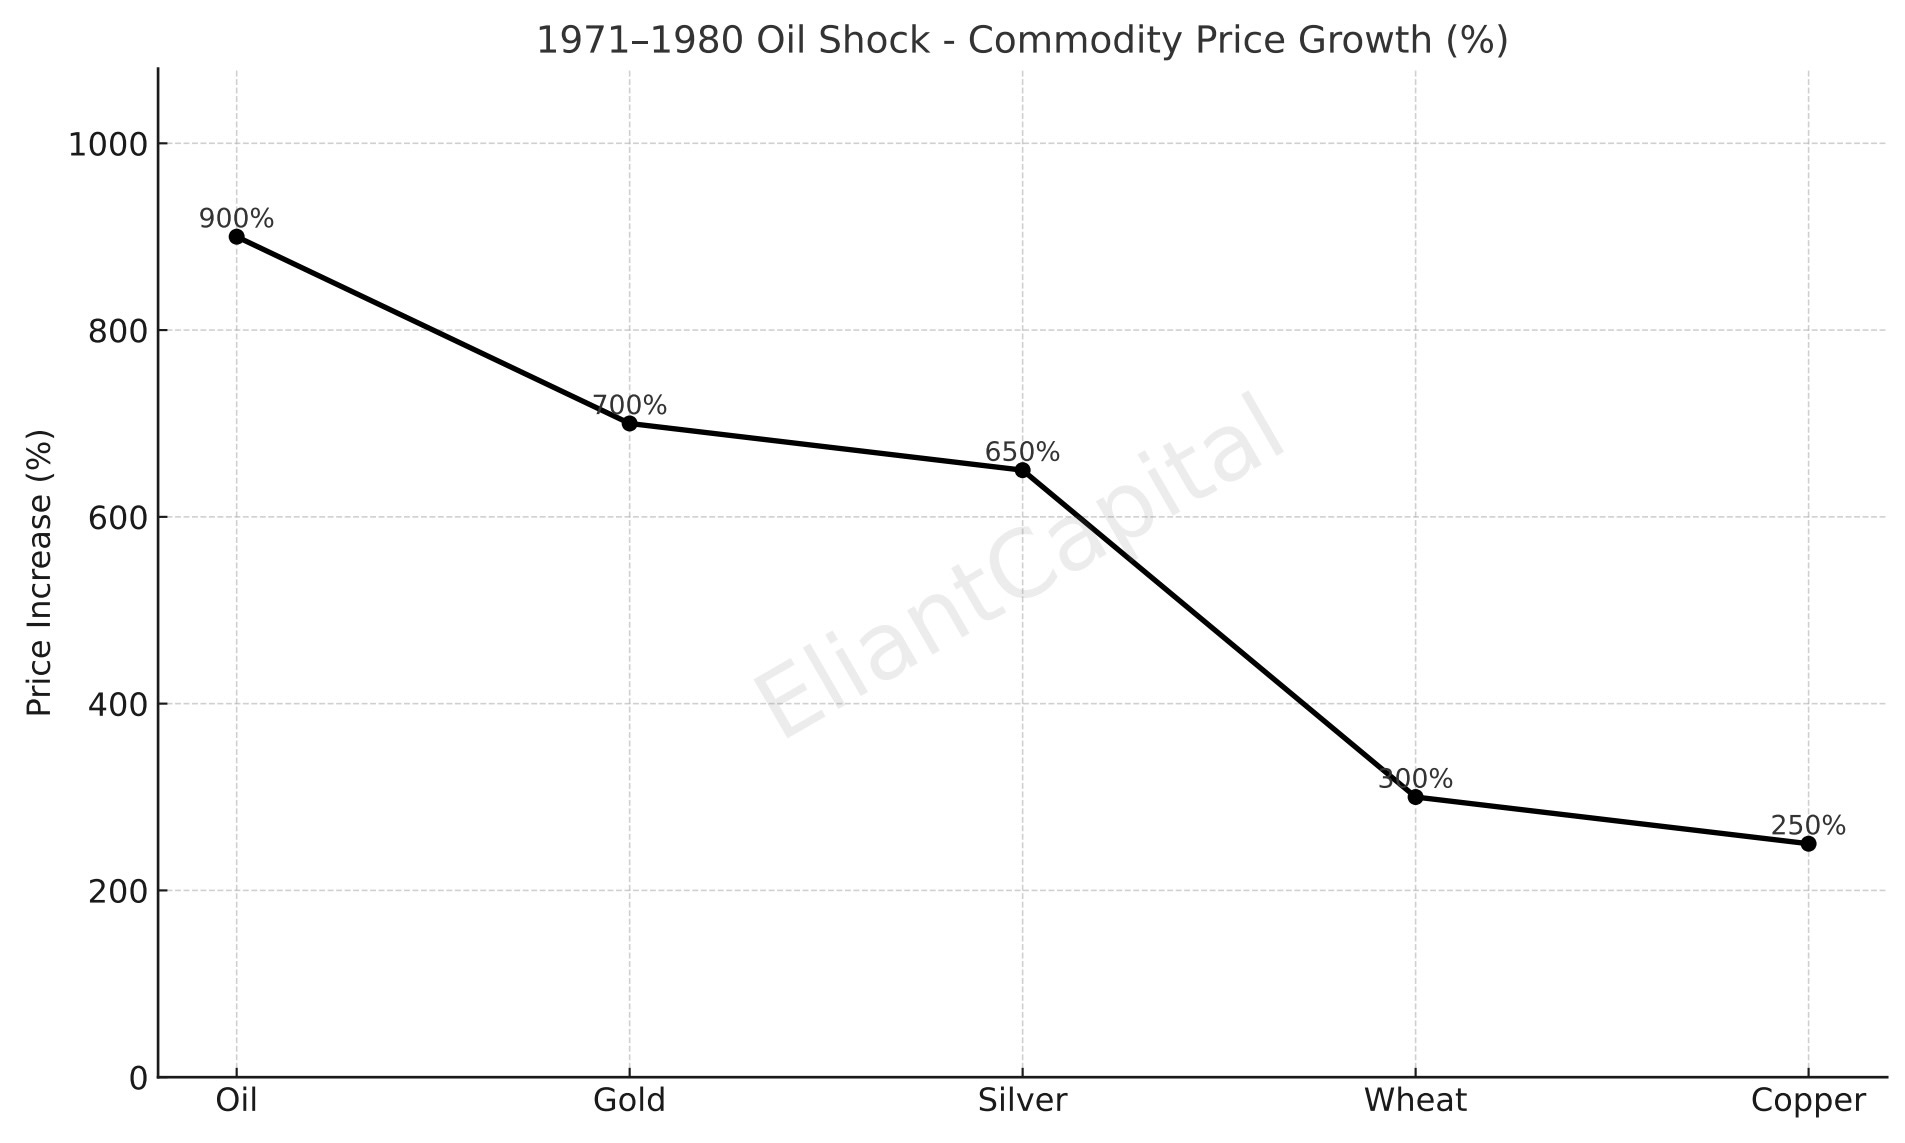
Top Performing Commodities:
Oil +900% – $3 to ~$40/barrel (EIA)
Gold +700%, Silver +650% – Bretton Woods collapse, inflation hedge (LBMA)
Wheat +300%, Copper +250% – Global inflation/supply shocks (FAO, IMF)
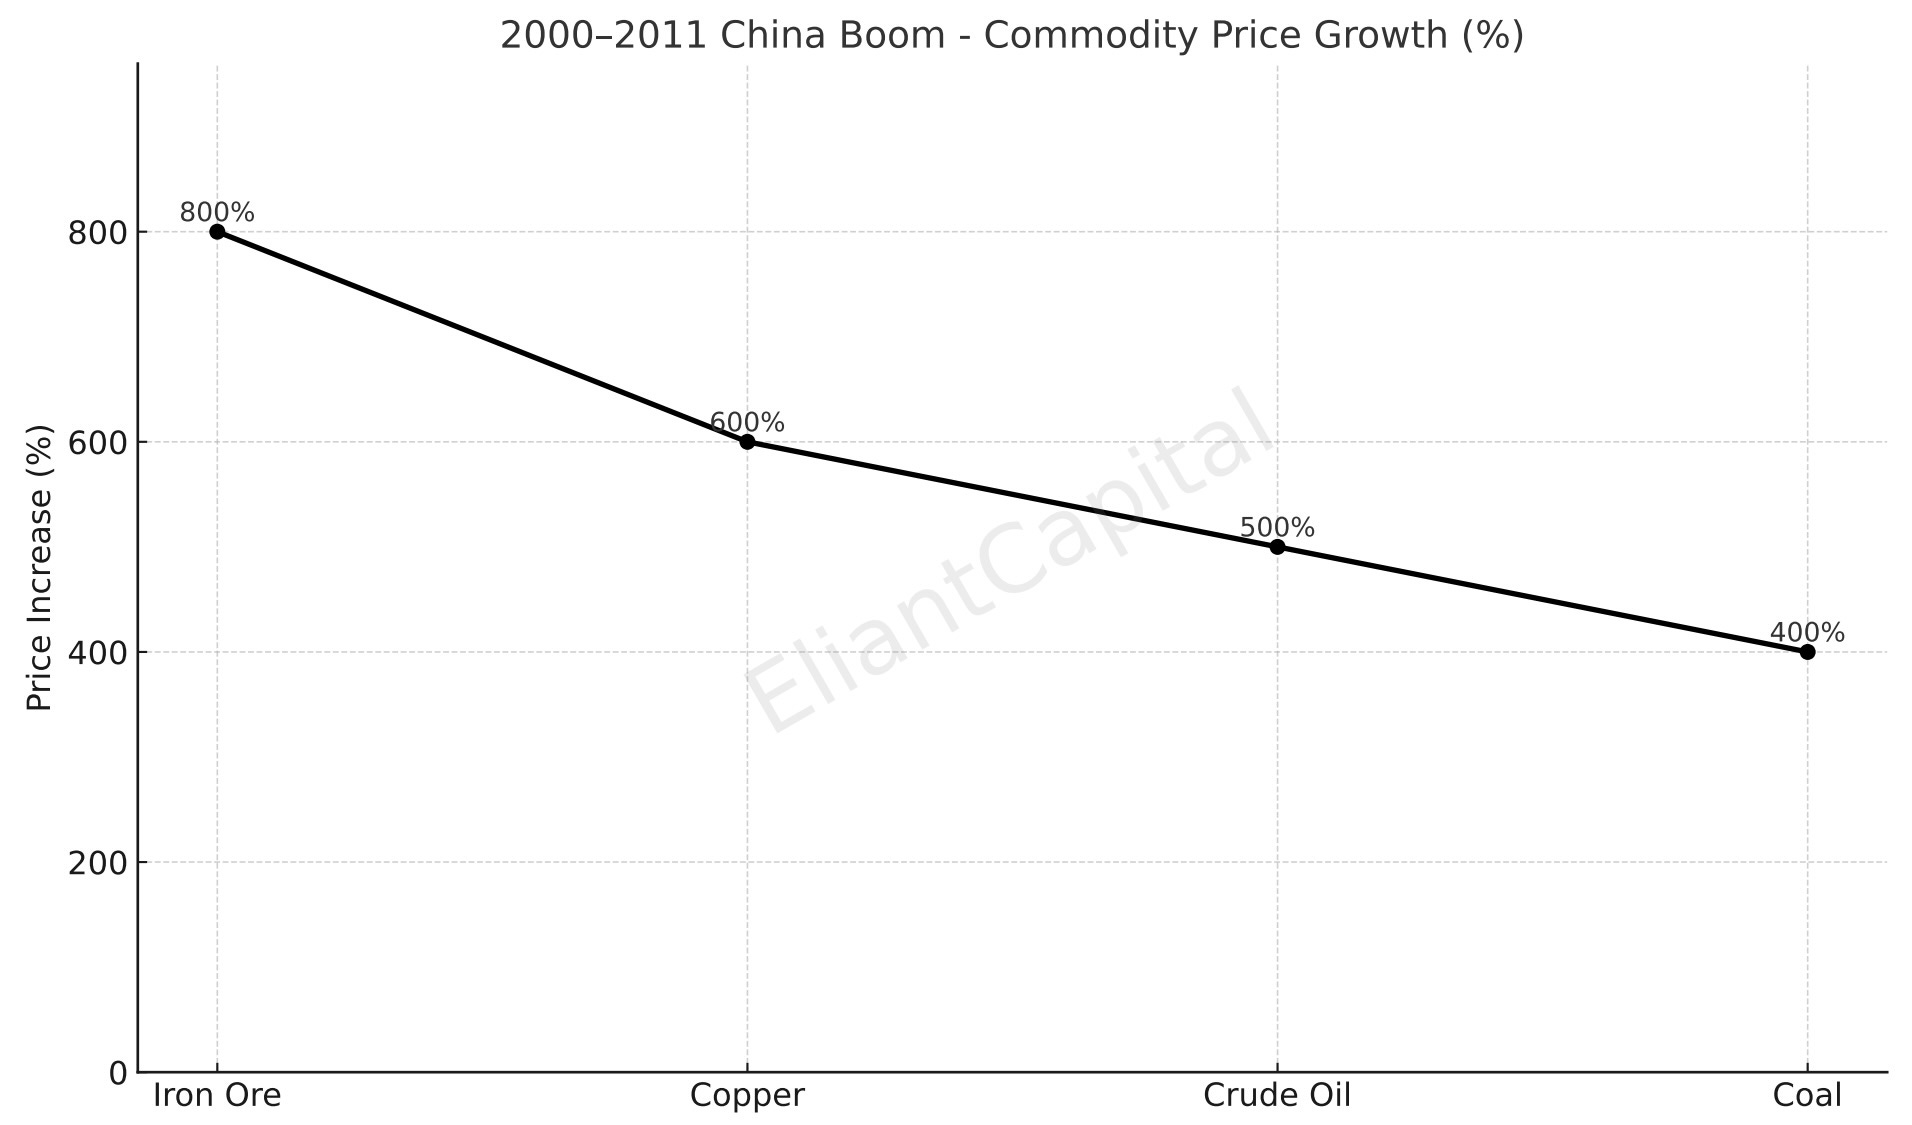
- The China-Led Infrastructure Boom (2000–2011)
The most recent supercycle was driven by China’s integration into the global economy and its unprecedented infrastructure buildout following WTO accession. Over a span of just two decades, China became the world’s top consumer of steel, iron ore, copper, aluminum, and coal. The country built megacities, expanded highways and ports, and massively scaled its manufacturing output. The commodity windfall spread to resource-rich nations such as Brazil, Australia, and South Africa, which experienced massive trade surpluses and capital inflows. Mining companies launched multibillion-dollar projects, and sovereign wealth funds flourished. But this cycle ran out of steam as China’s growth slowed, and years of overinvestment created excess supply.
From 2000 to 2011, Iron ore, copper, and precious metals led the cycle, far outpacing equities—marking one of the strongest commodity supercycles of the modern era.
Top Performing Commodities:
Iron Ore +800%, Copper +600% – China infrastructure & WTO entry (IMF, Bloomberg)
Crude Oil +500% – $20s to $140 peak (EIA, World Bank)
Coal +400% – Power demand from China/India (BP Energy Yearbook)