The Week Ahead 1/5/25

Hello All,
For starters, I wanted to wish you all a Happy New Years & start to ‘25 as we get ready to kick off. Wishing you all plentiful & outlier returns into the new year.
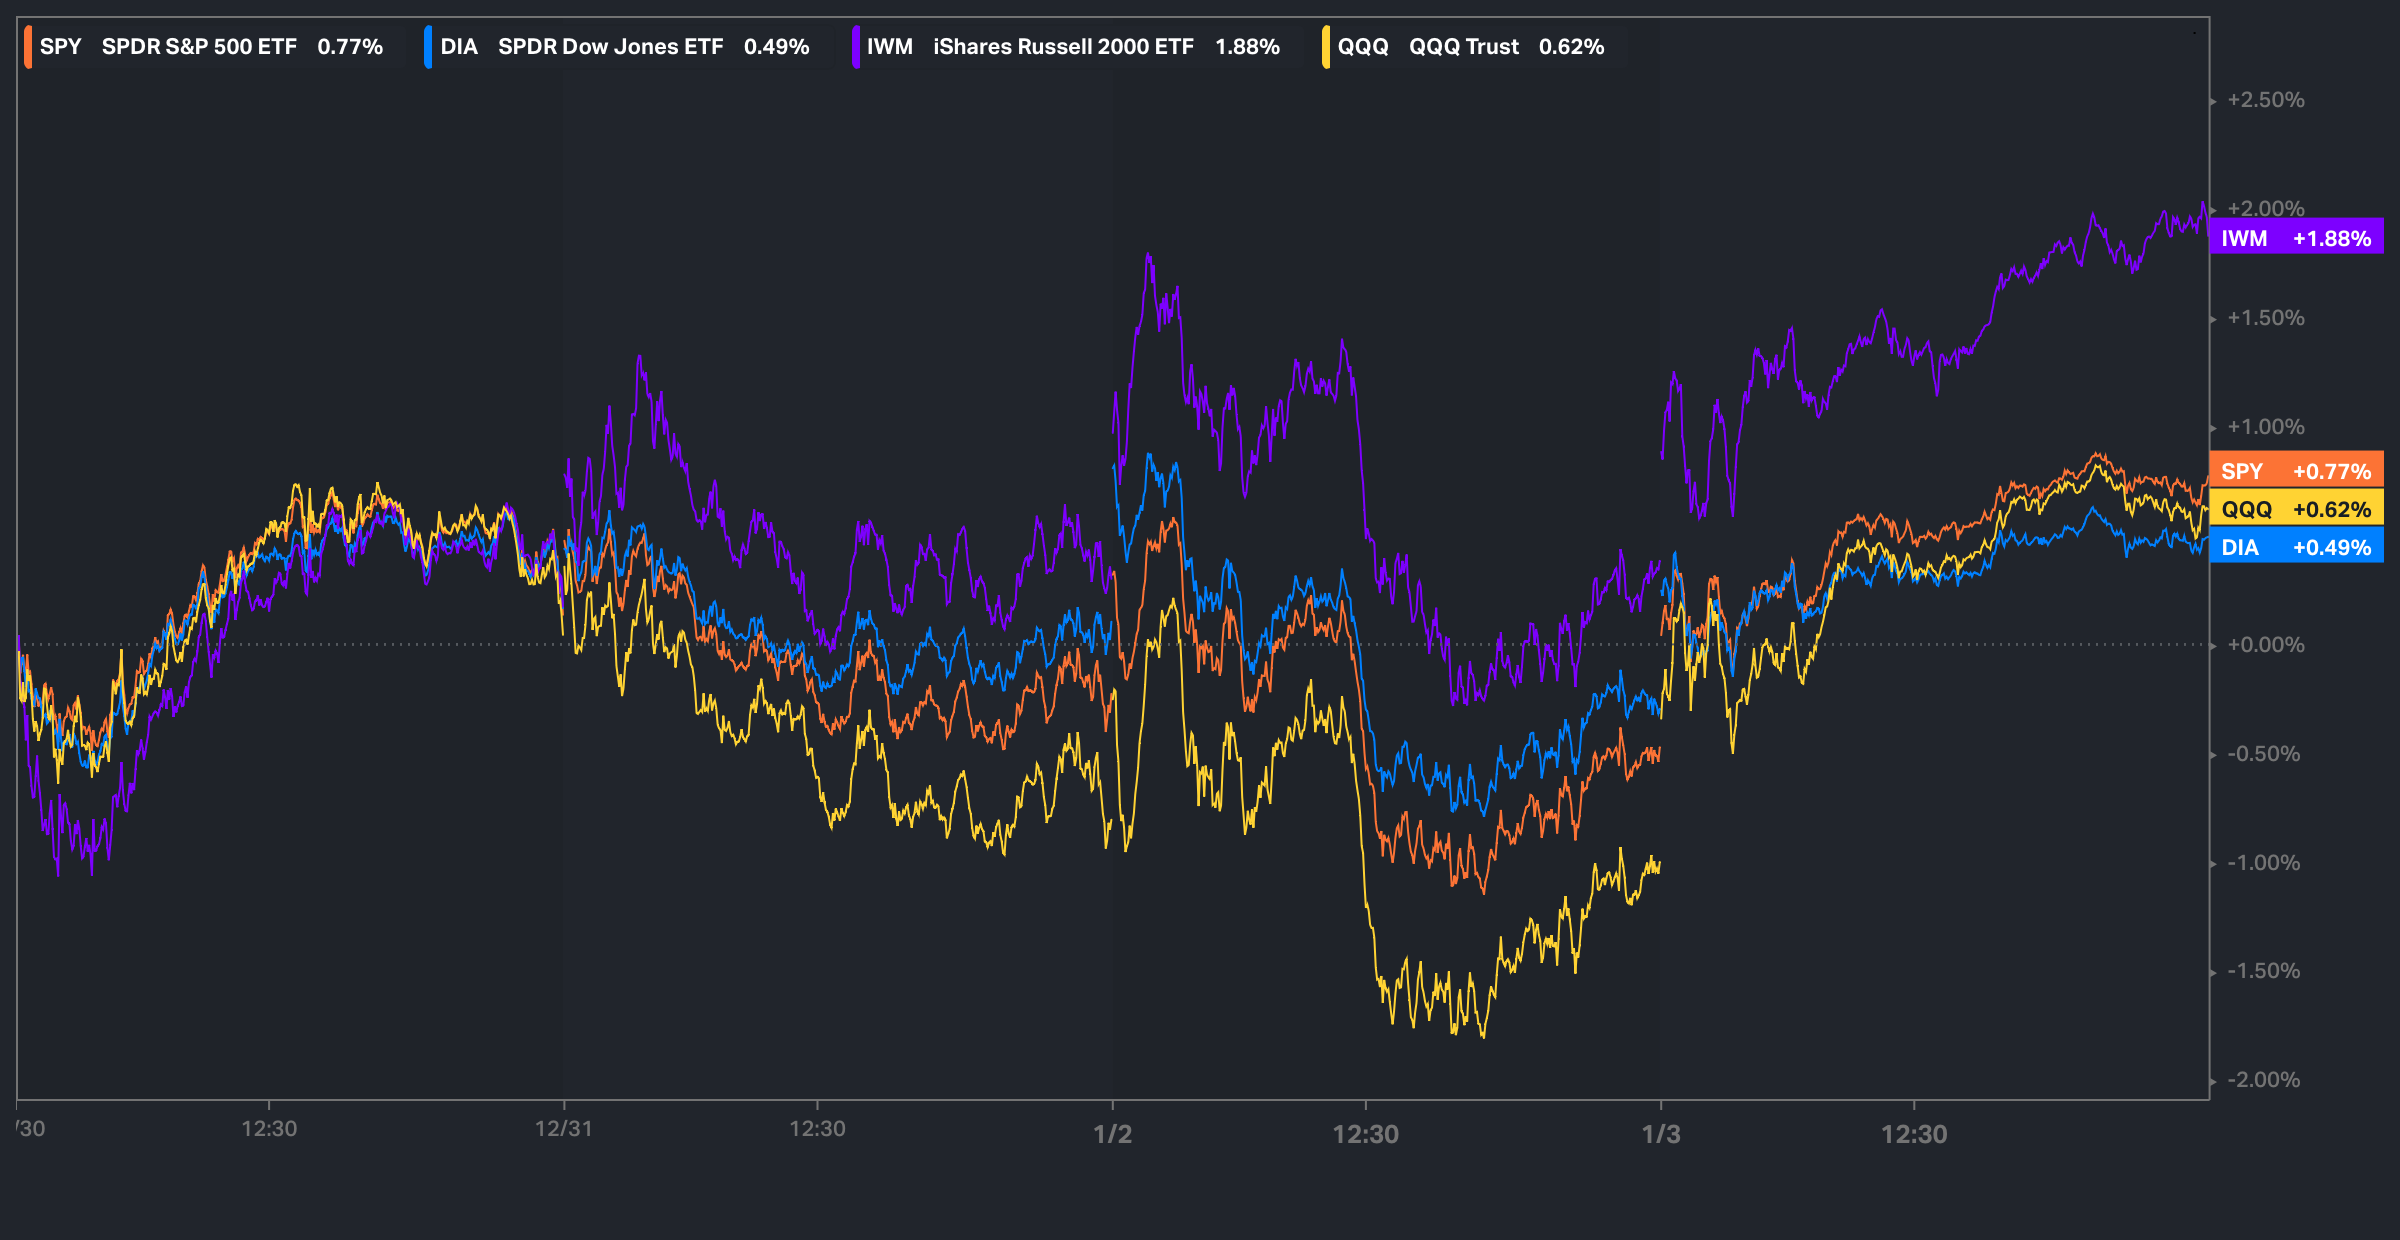
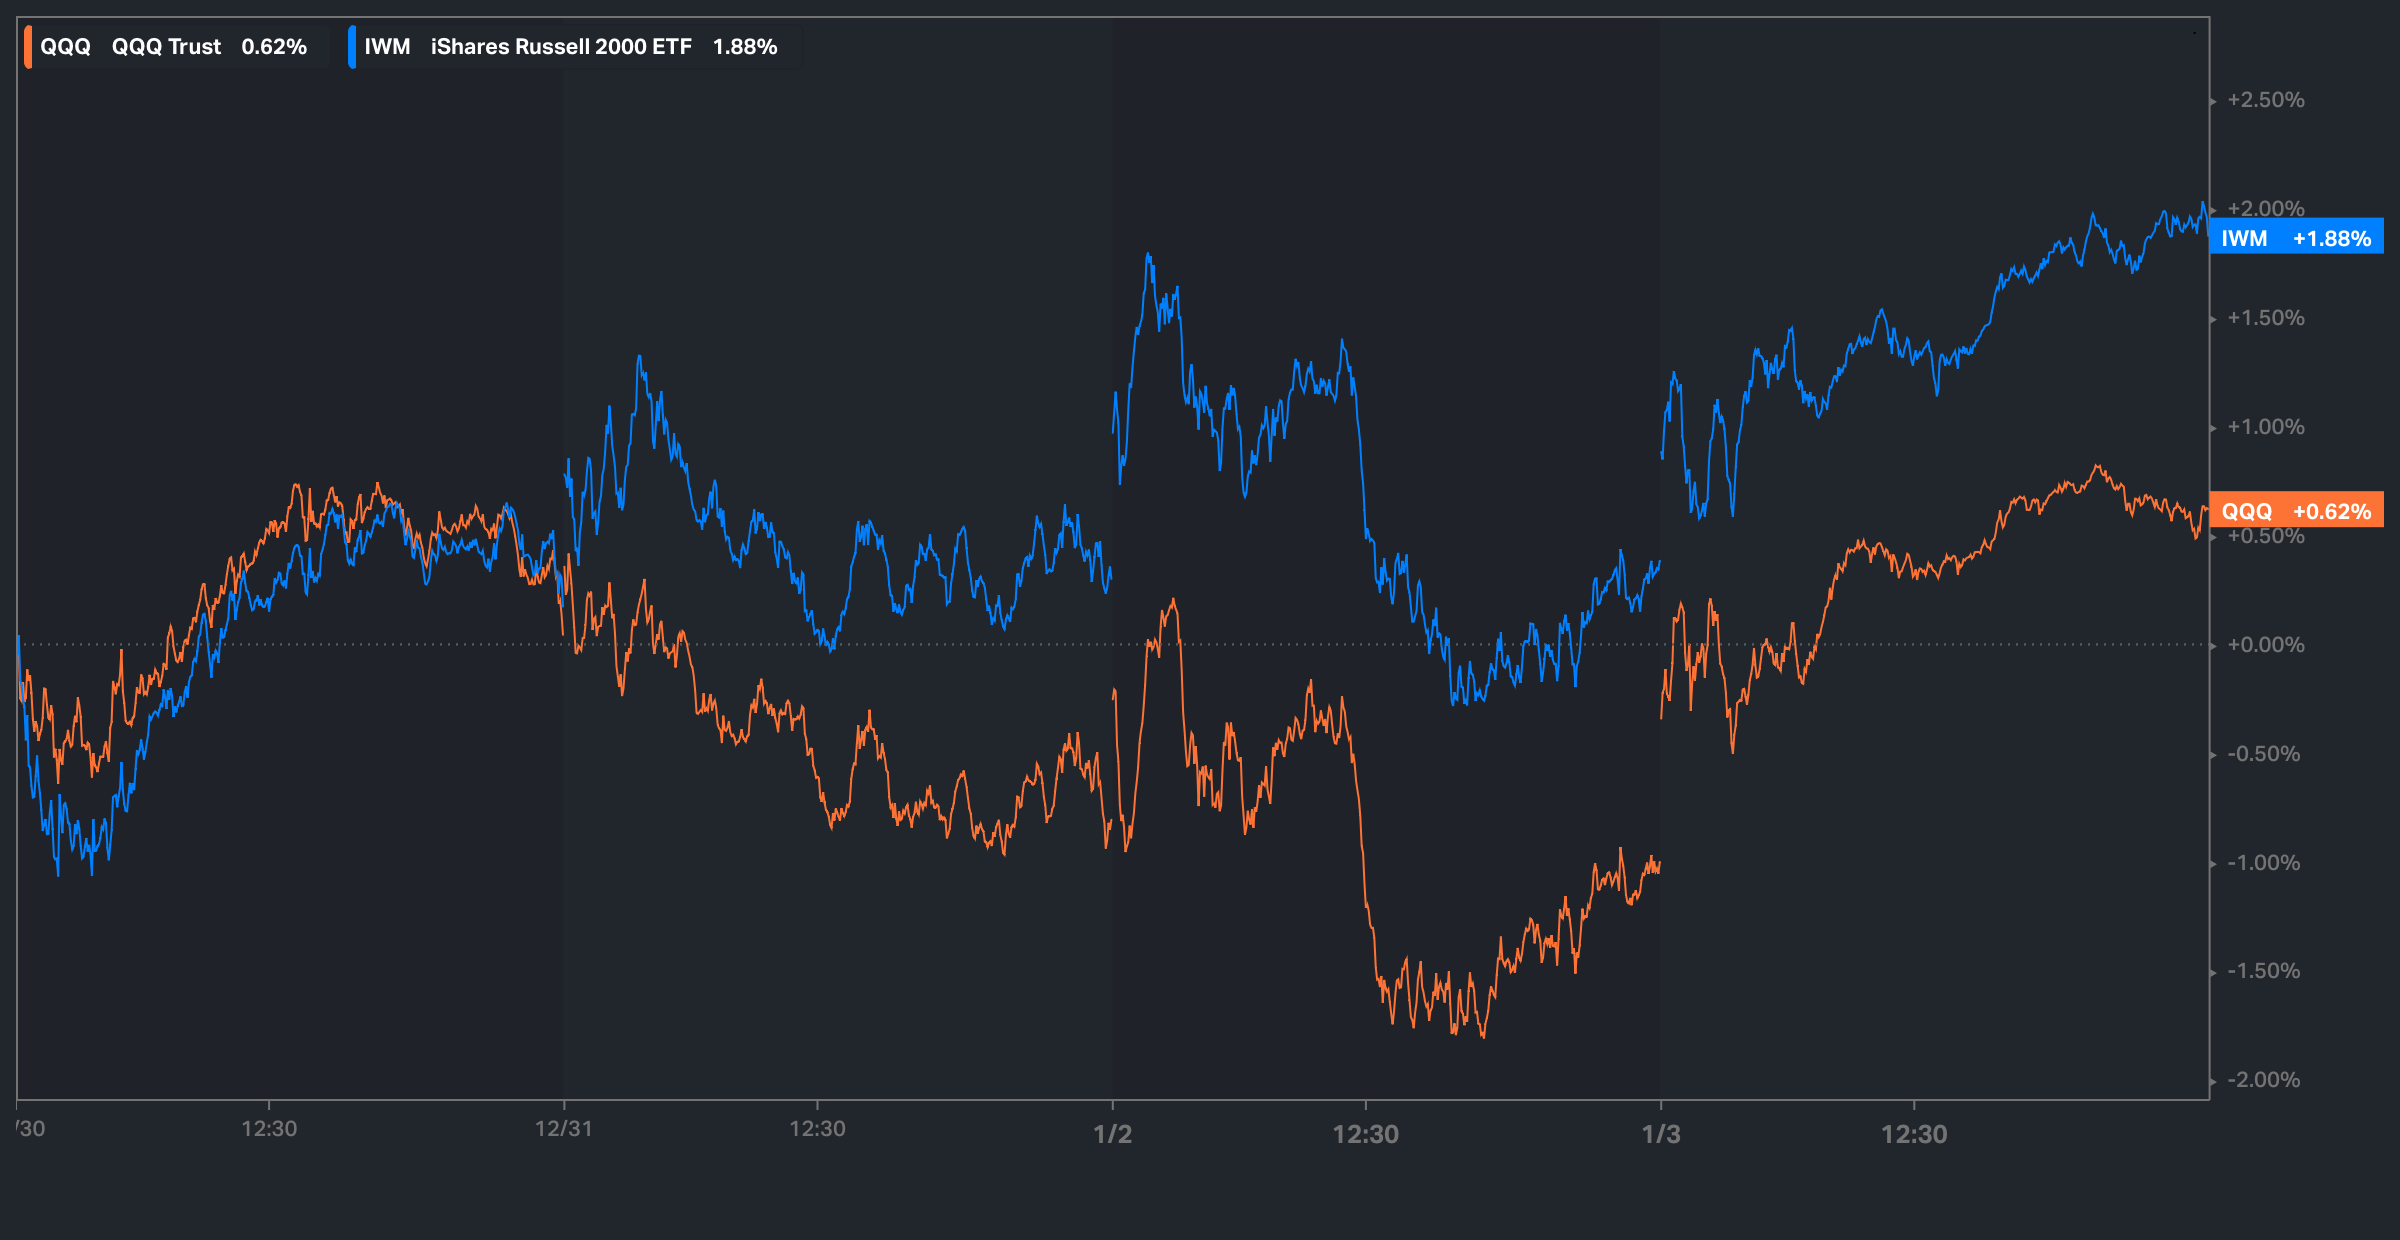
Looking back at this past week, we saw a bit of rotationary forces underway as small-caps ended up being the best performer this past week closing up over 180bps whereas the remaining indices all pretty much performed inline with each other in the 50-70bps range for the week.
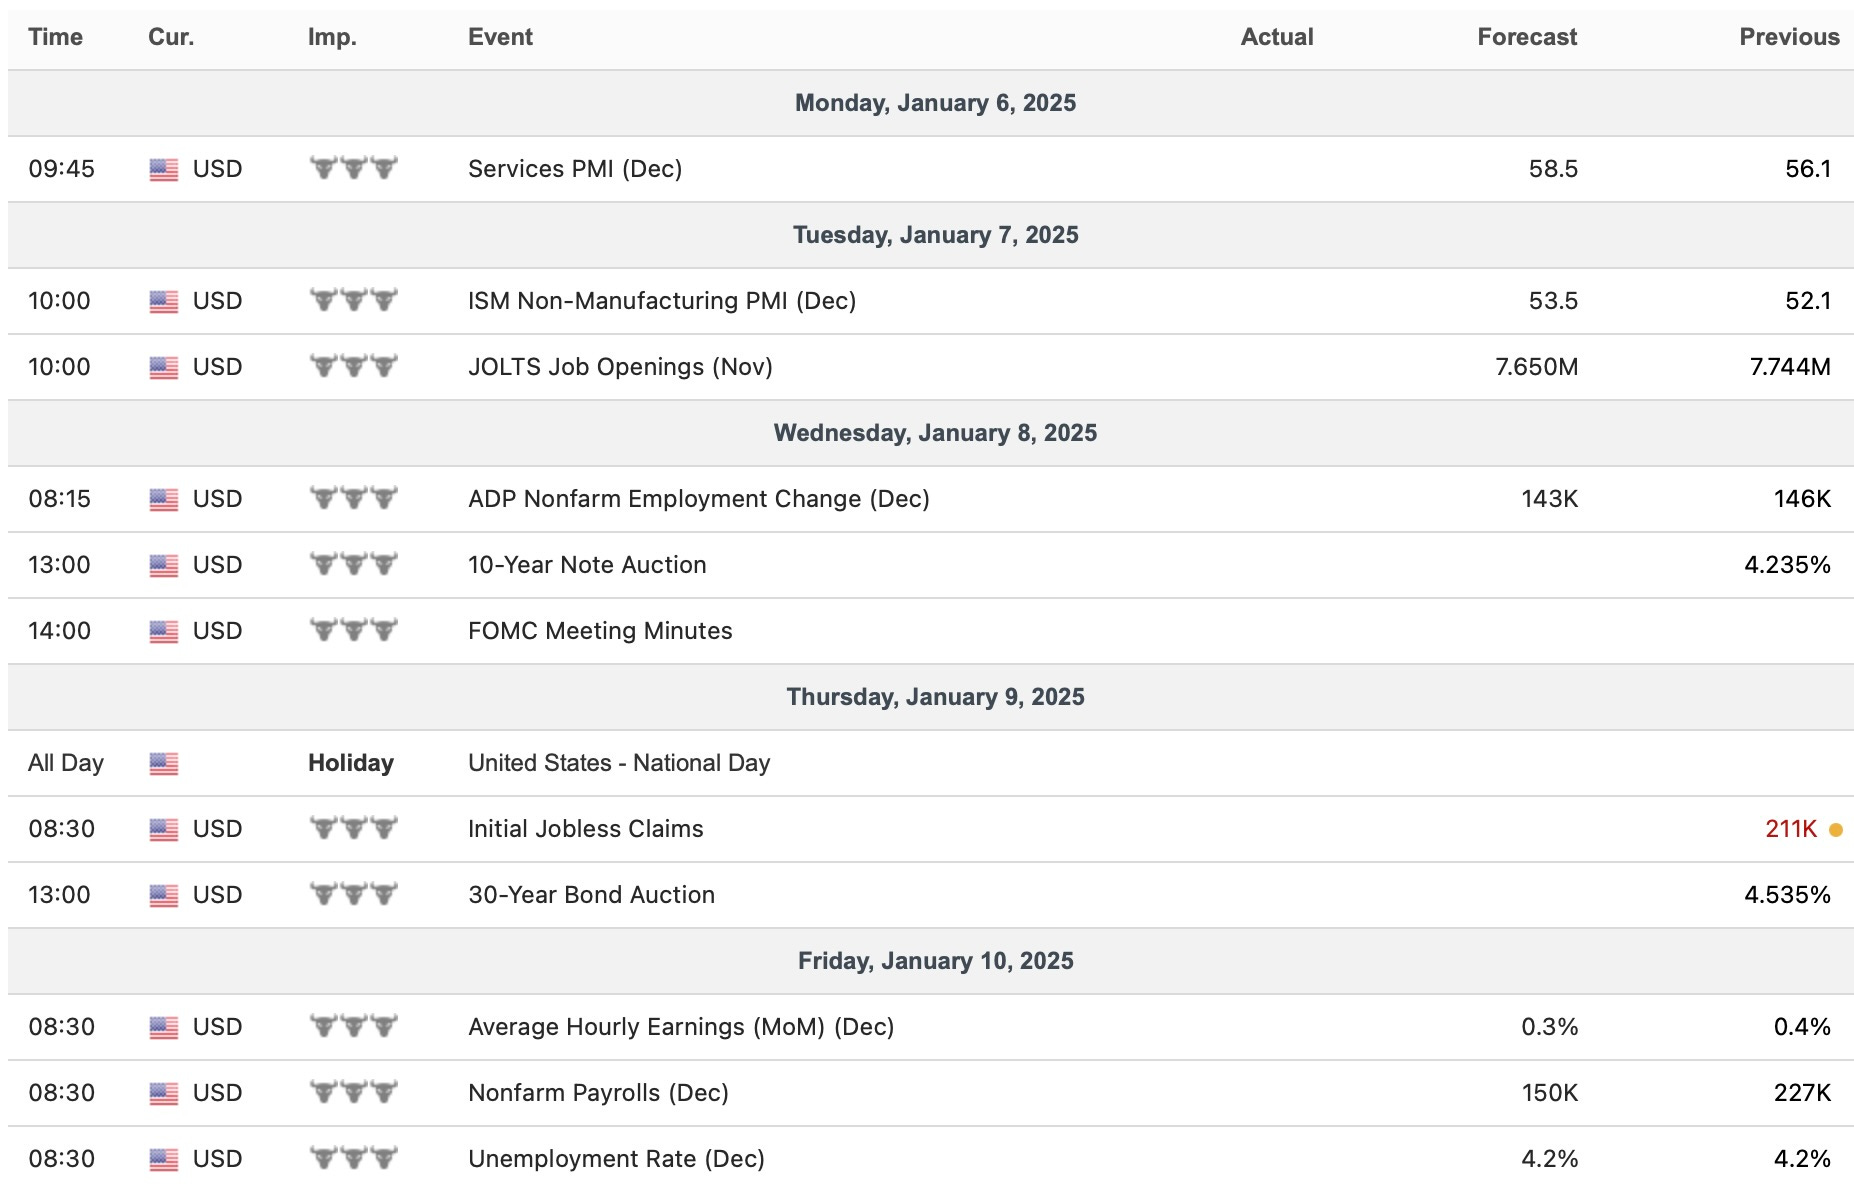
- Economic Data for the Coming Week:
Looking ahead into this coming week, we have ANOTHER shortened week as markets will be closed on the 9th in remembrance of Jimmy Carter due to his recent passing, but in regard to economic data, we have a plethora of jobs data ahead along with a couple of bond auctions scattered throughout the week as well & its generally an important week, given this recent FOMC, the Fed gave themselves VERY little room for error in regard to weakness with the labor market, so if we did start to see a shift, this past FOMC could end up looking like another policy mistake & we could see the hawkish tone shift right back towards the dovishness to be supportive of the labor market, but in general, if the economy continues to hum along, we likely will need to see disinflation resume to give the Fed more confidence in the cutting cycle & bring back that dovishness.
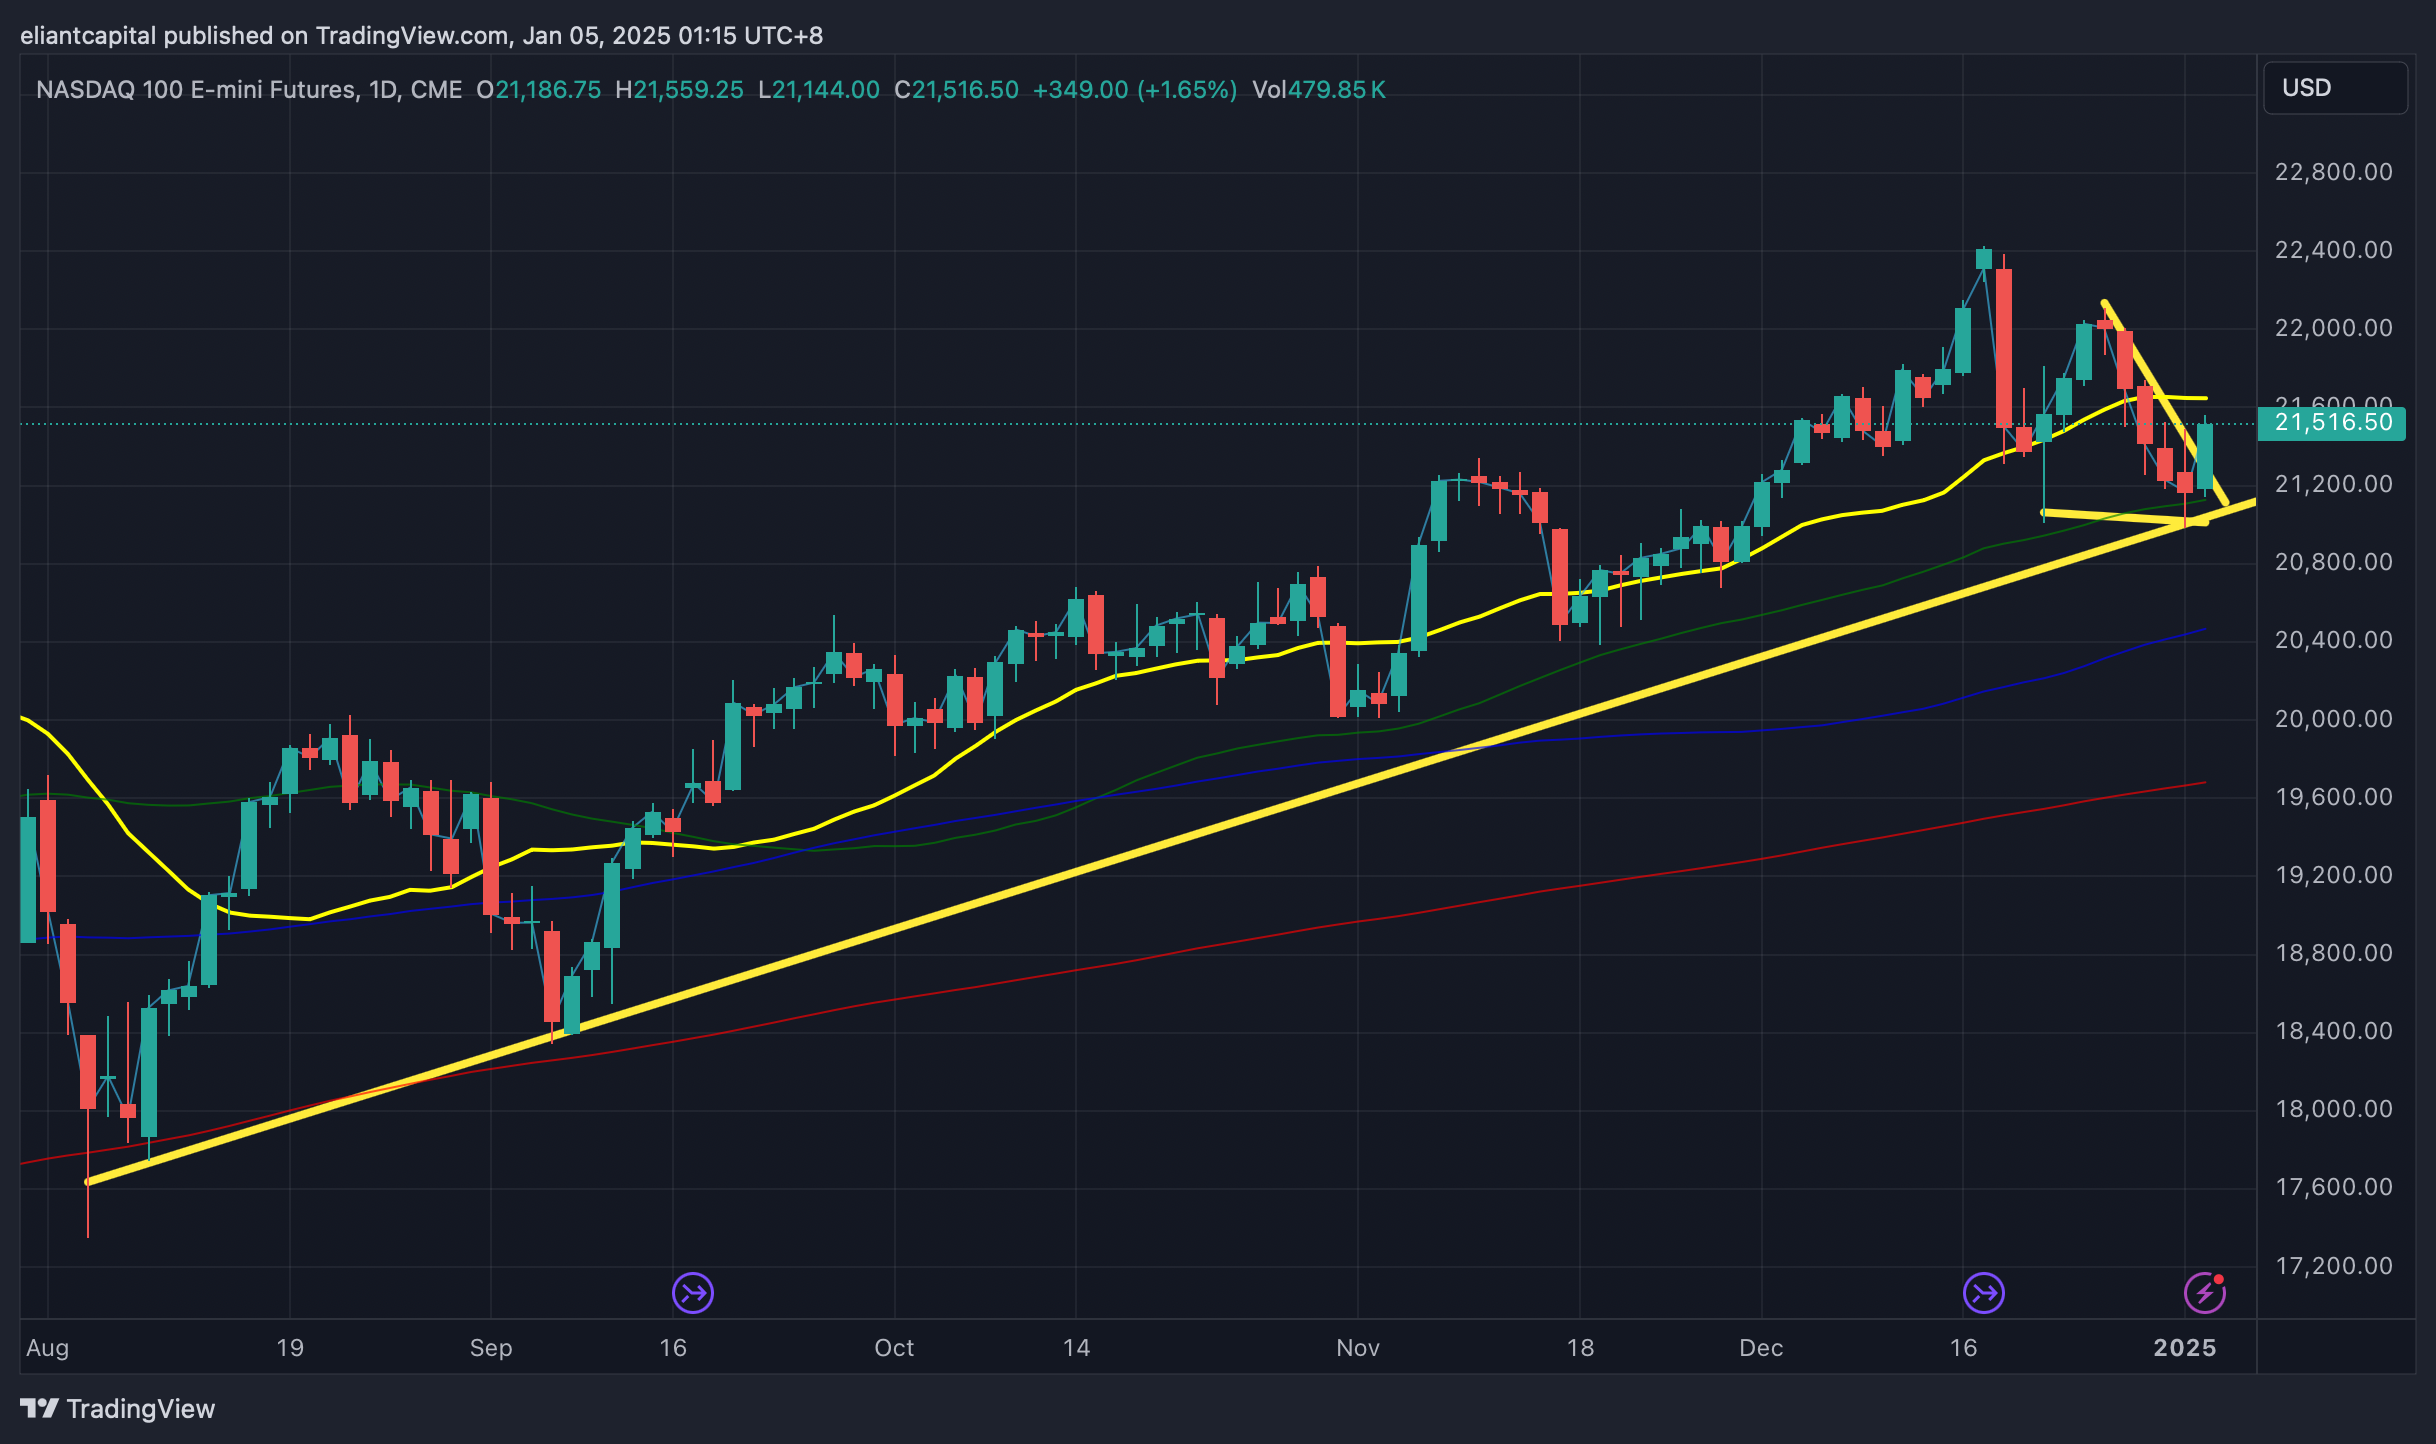
- STD Channels on Indices for Perspective: Daily TF
- SPY
- QQQ
- IWM
- DJIA
Since starting this Substack back in June of ‘23, between individual names / tactical trades / baskets, we have netted a 100.33% return whilst in the same period, the Q's have returned 46.43% / Spooz has returned 40.02% / Dow has returned 30.11% & Small-caps have returned 26.68%, so nice outperformance against all the indices whilst having a 81.1% win rate, averaging a 19.37% return on realized gains / winners & a 12.06% loss on realized losses / losers.
Looking forward to the future as we kick off ‘25.
We recently published our ‘25 Outlook / Year Ahead which has a plethora of coverage on a wide variety of topics / themes as we get ready to head into ‘25 after coming off a strong ‘24 & for those who would like to read & prep for ‘25, I included a link to the report / write-up here.

Lastly, I published an educational post as it had been highly requested. Below is the broad range of topics that were included and requested by subscribers:
- General background / knowledge on all option strategies
- In-depth talk on risk / reversals & how to go about expressing / utilizing them
- Options Structuring
- When to used naked calls / puts vs. spreads
- Choosing expiration dates
- Identifying key pivots / supports / resistance zones
- General briefing on stock gaps
- What to look for in regards to fundamentals
- Implementing fundamental / macro / technicals into a trade
- Hedging
- Creating risk/reward setups
- Taking profits / managing losses
- Overall Process
- Book recommendations
A link to the educational write-up can be found here.
Educational Piece Part DEUX, which has been highly requested, will be published this upcoming week, likely earlier on in the week.
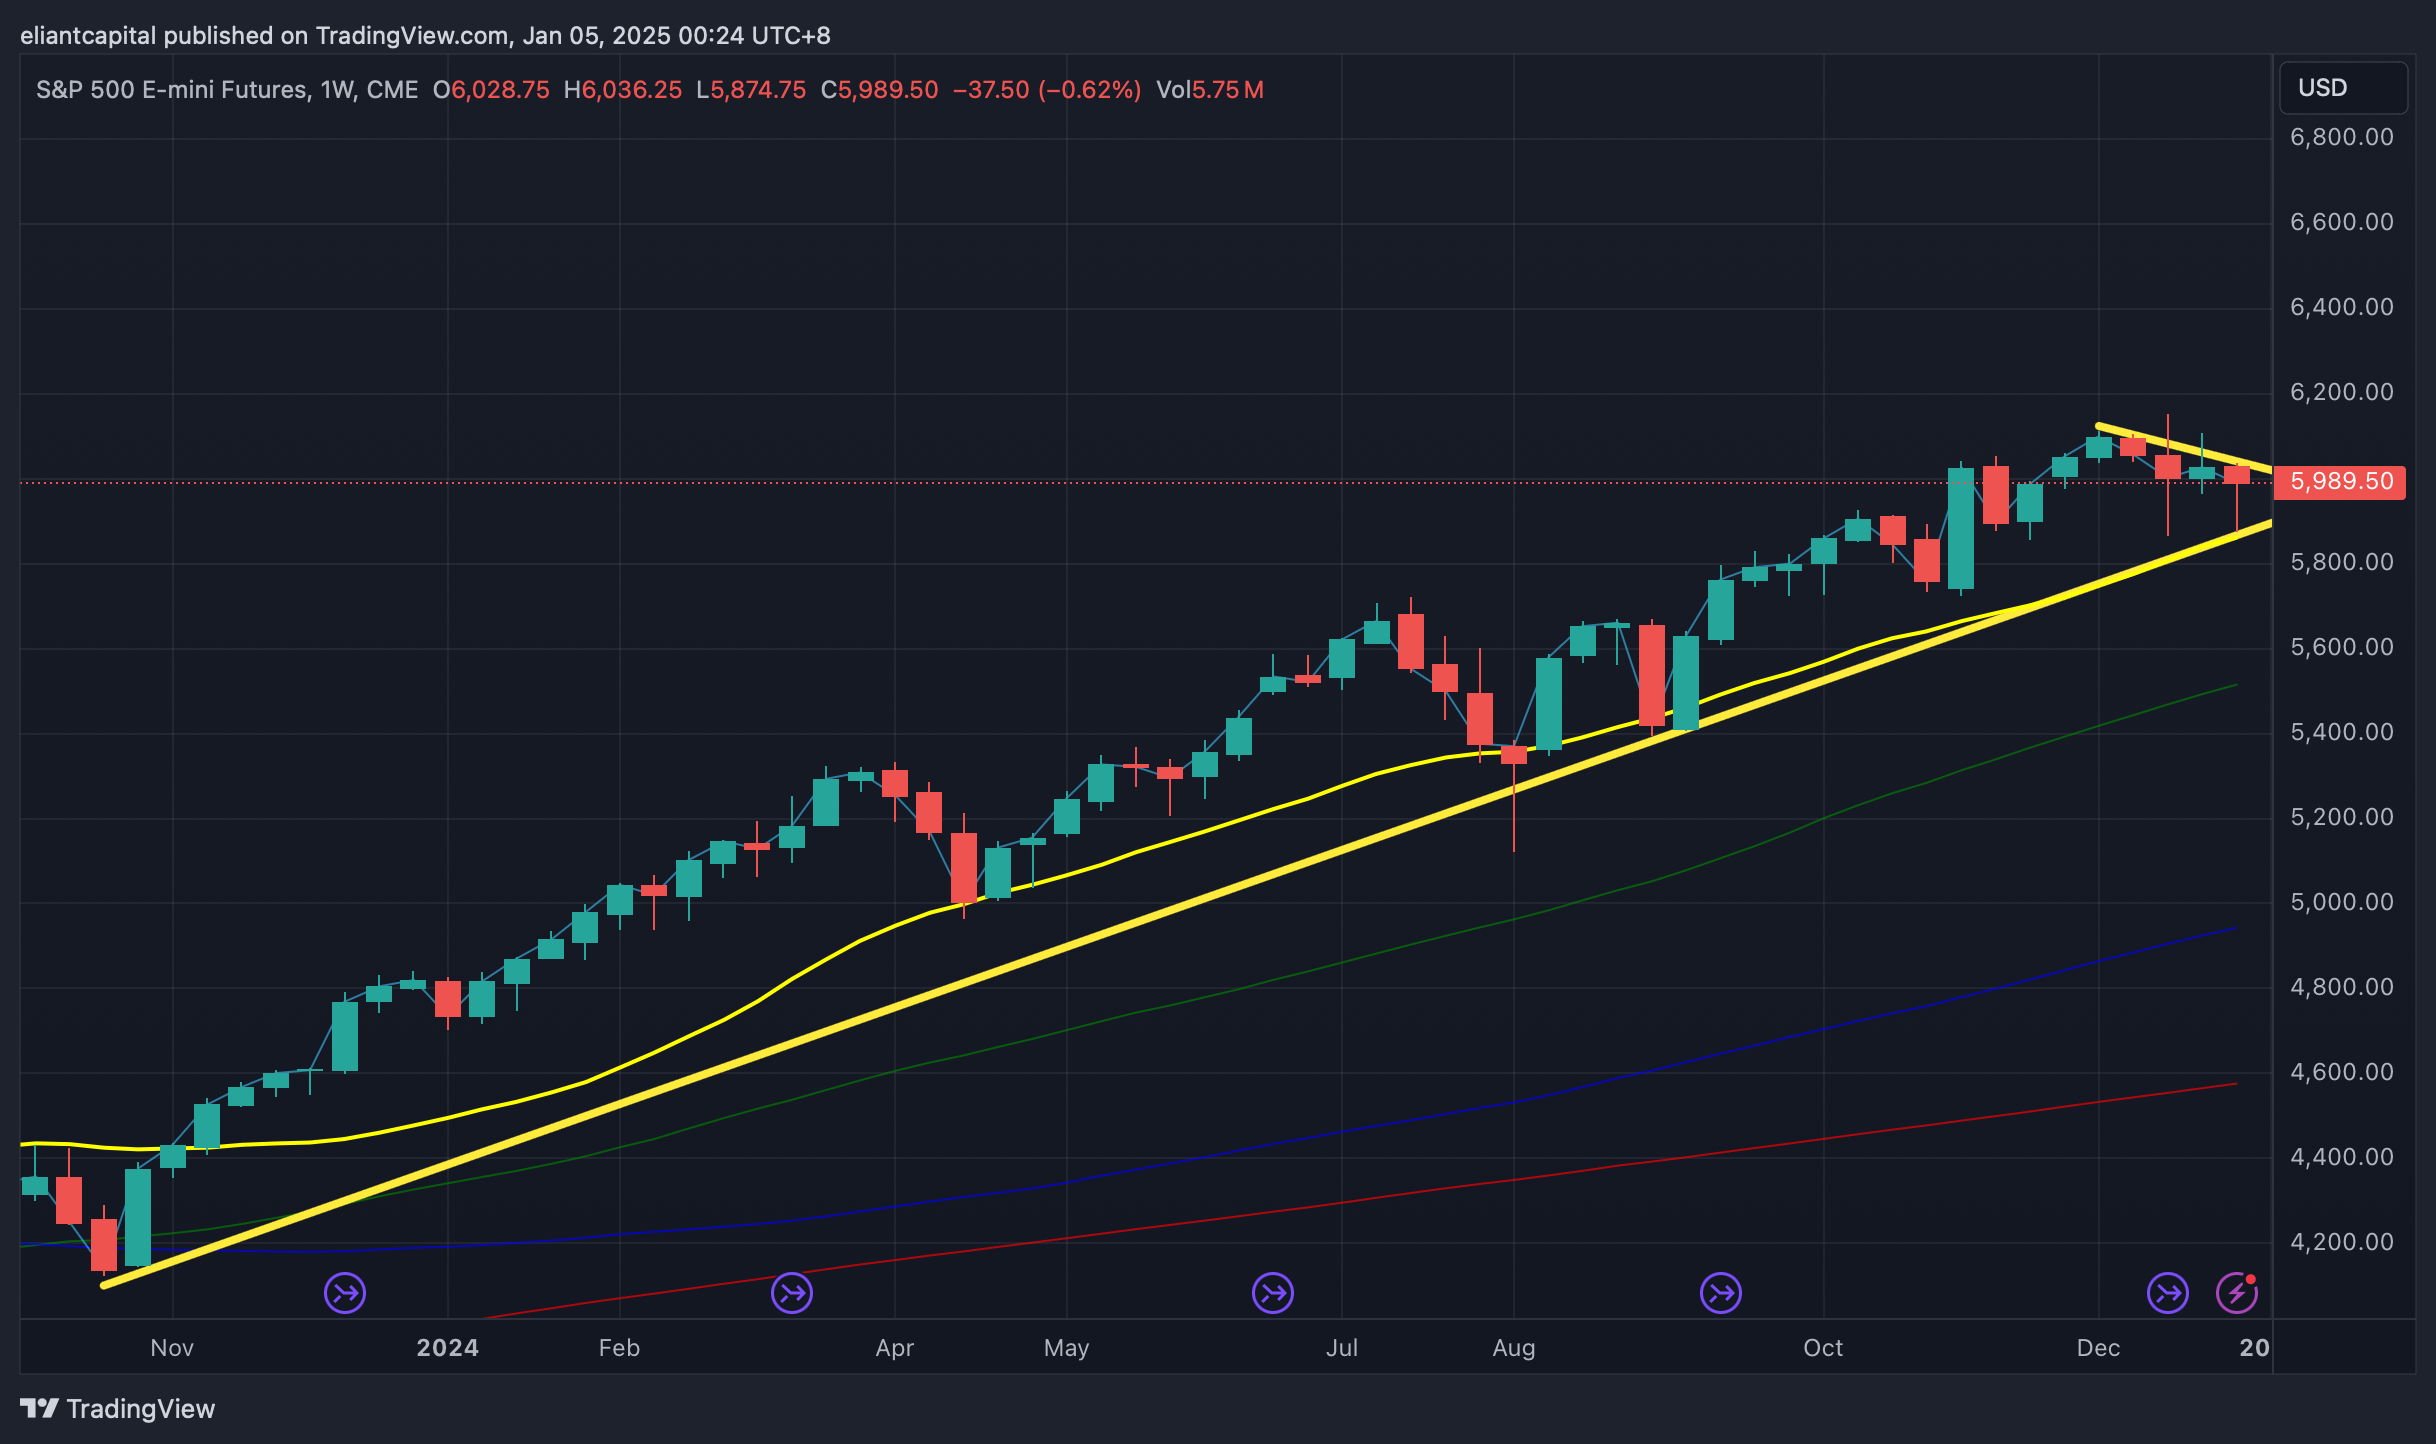
- SPY
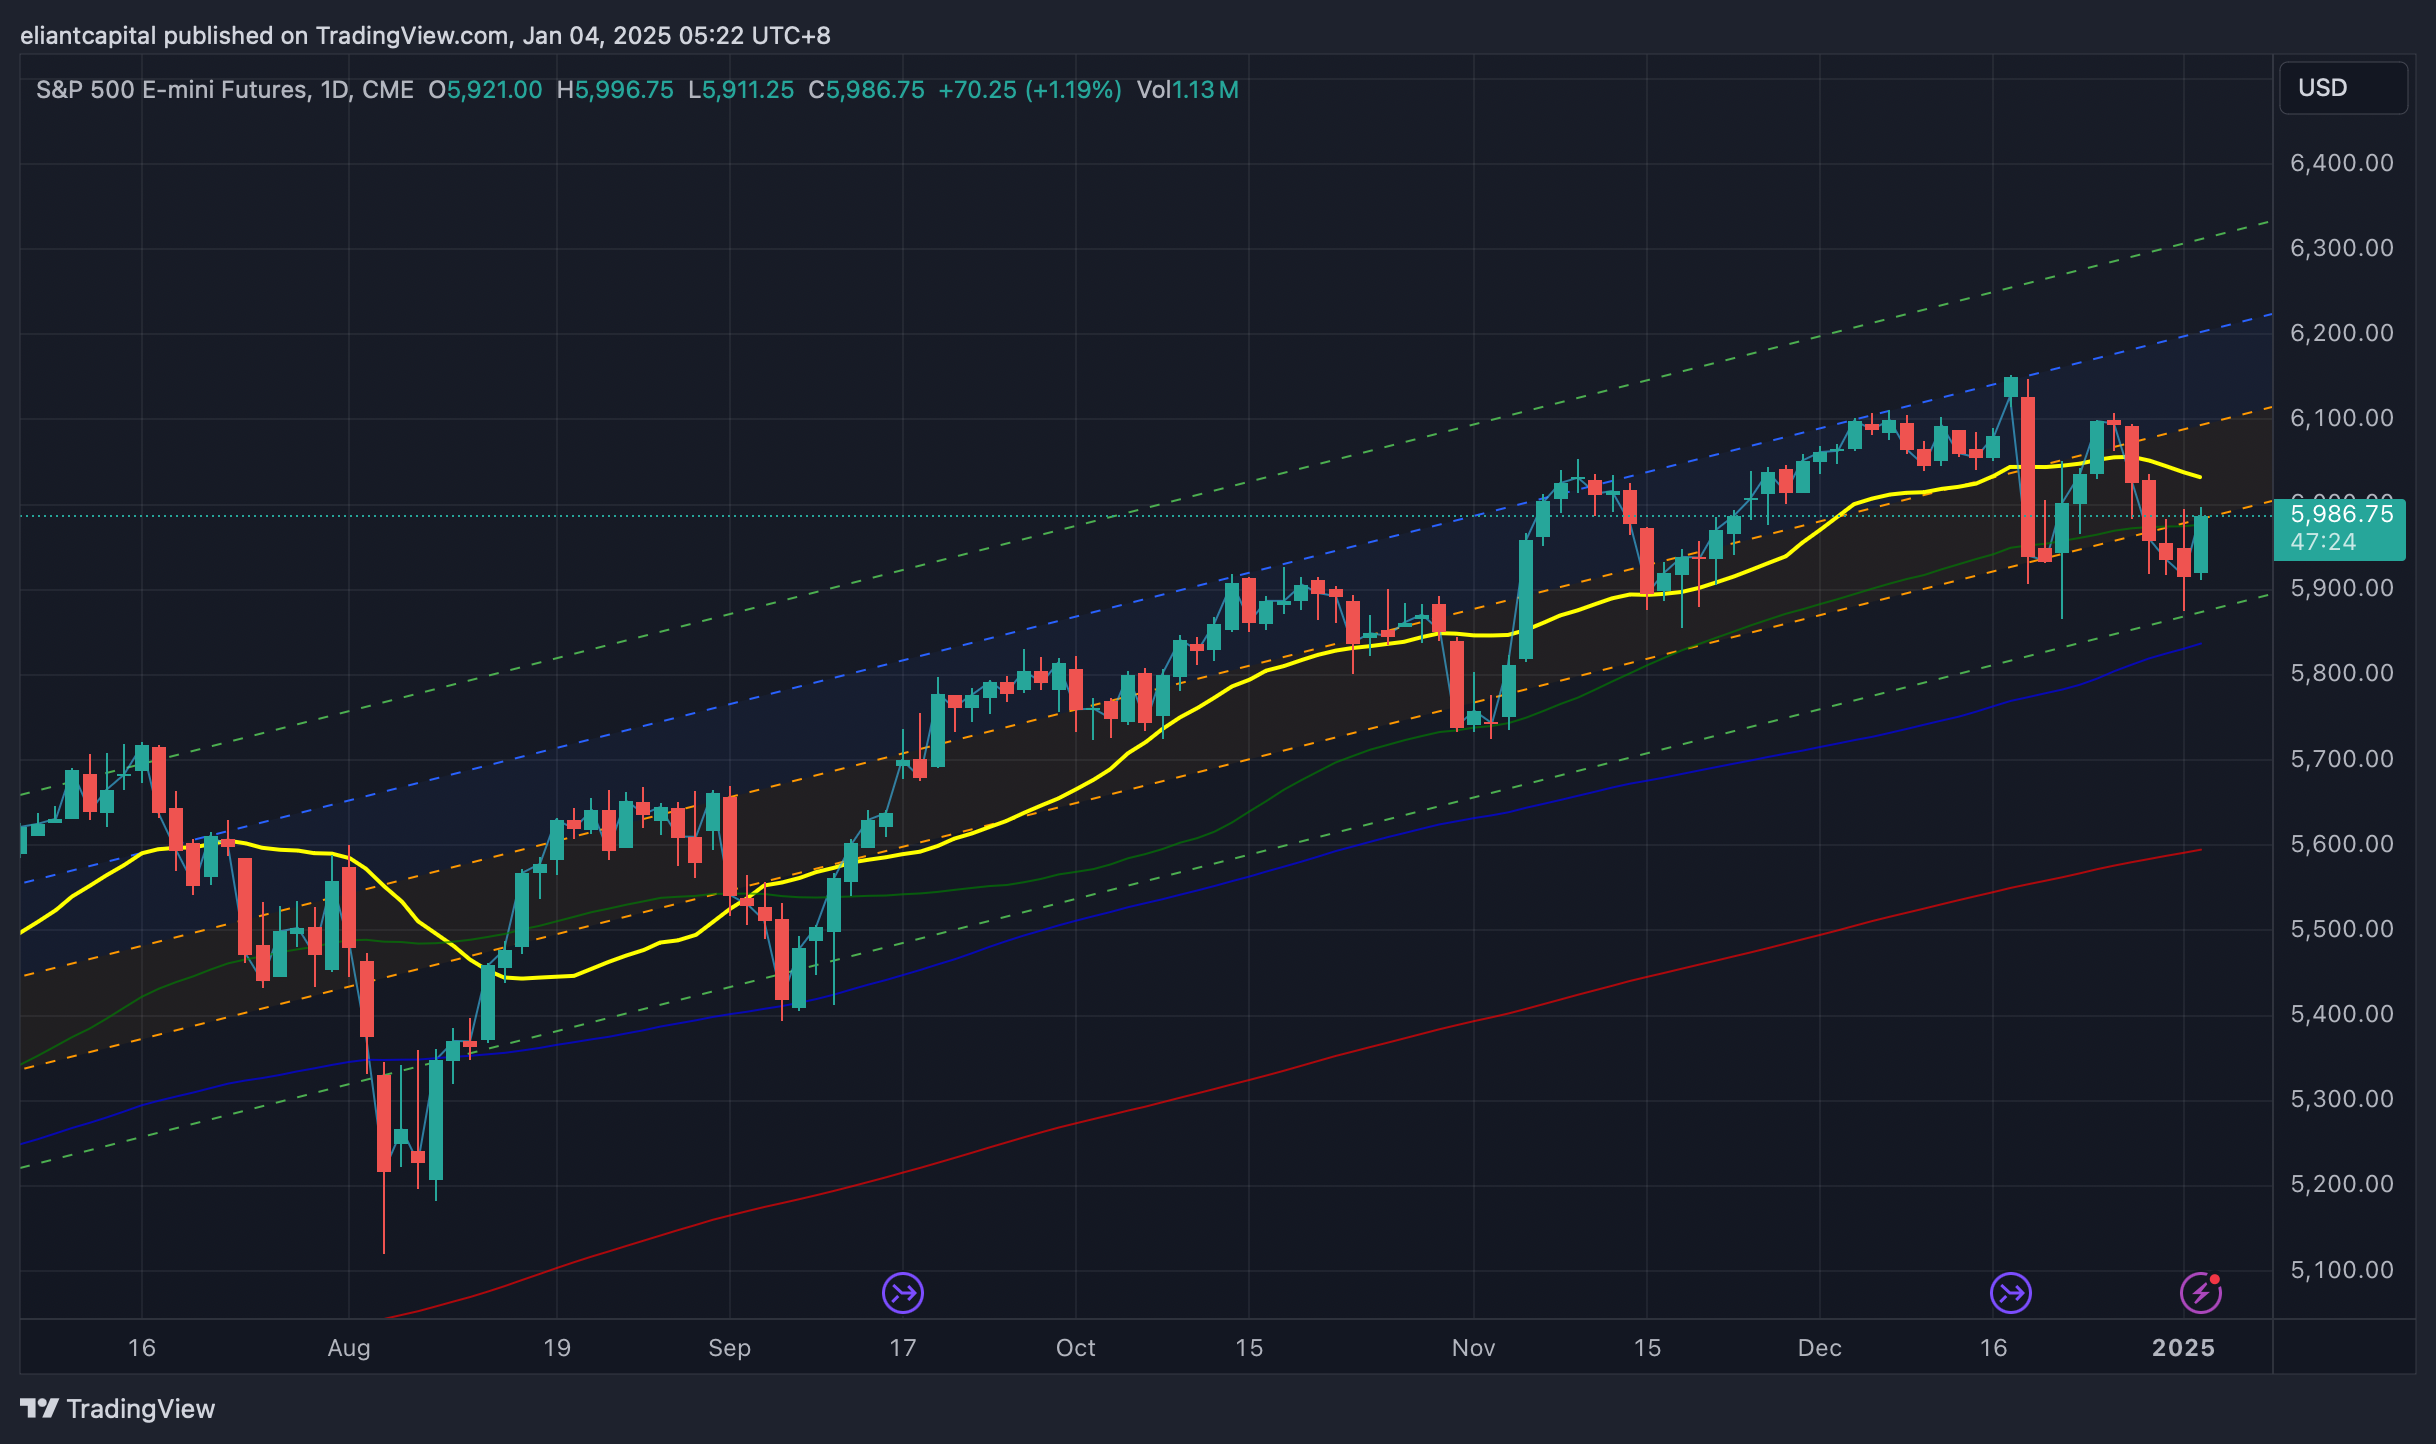
As we get ready to head into next week, we have quite a jam-packed week in regard to economic data as we have a plethora of jobs data along with NFP #’s on Friday most importantly, & I’d argue its a fairly important week & it all circles back to this most recent FOMC. Those that recall, but the Fed outlined their ‘25 expectations & they issued a 4.3 cap on the unemployment rate & as of now, the unemployment rate sits at 4.245ish… what’s that mean? The Fed essentially gave themselves ZERO wiggle room to be wrong on the job market for the entirety of ‘25… if jobs remain strong this week & or even the UER ticks lower, that would be a large positive for the Fed given their expectations on jobs for ‘25, but if we were to see a weaker report / more tame (not as strong as expected), the current “hawkish” expectations priced into the market (less than 50bps of cuts for the entirety of ‘25), will likely see a good bit of repricing / normalization given how skewed things currently are.
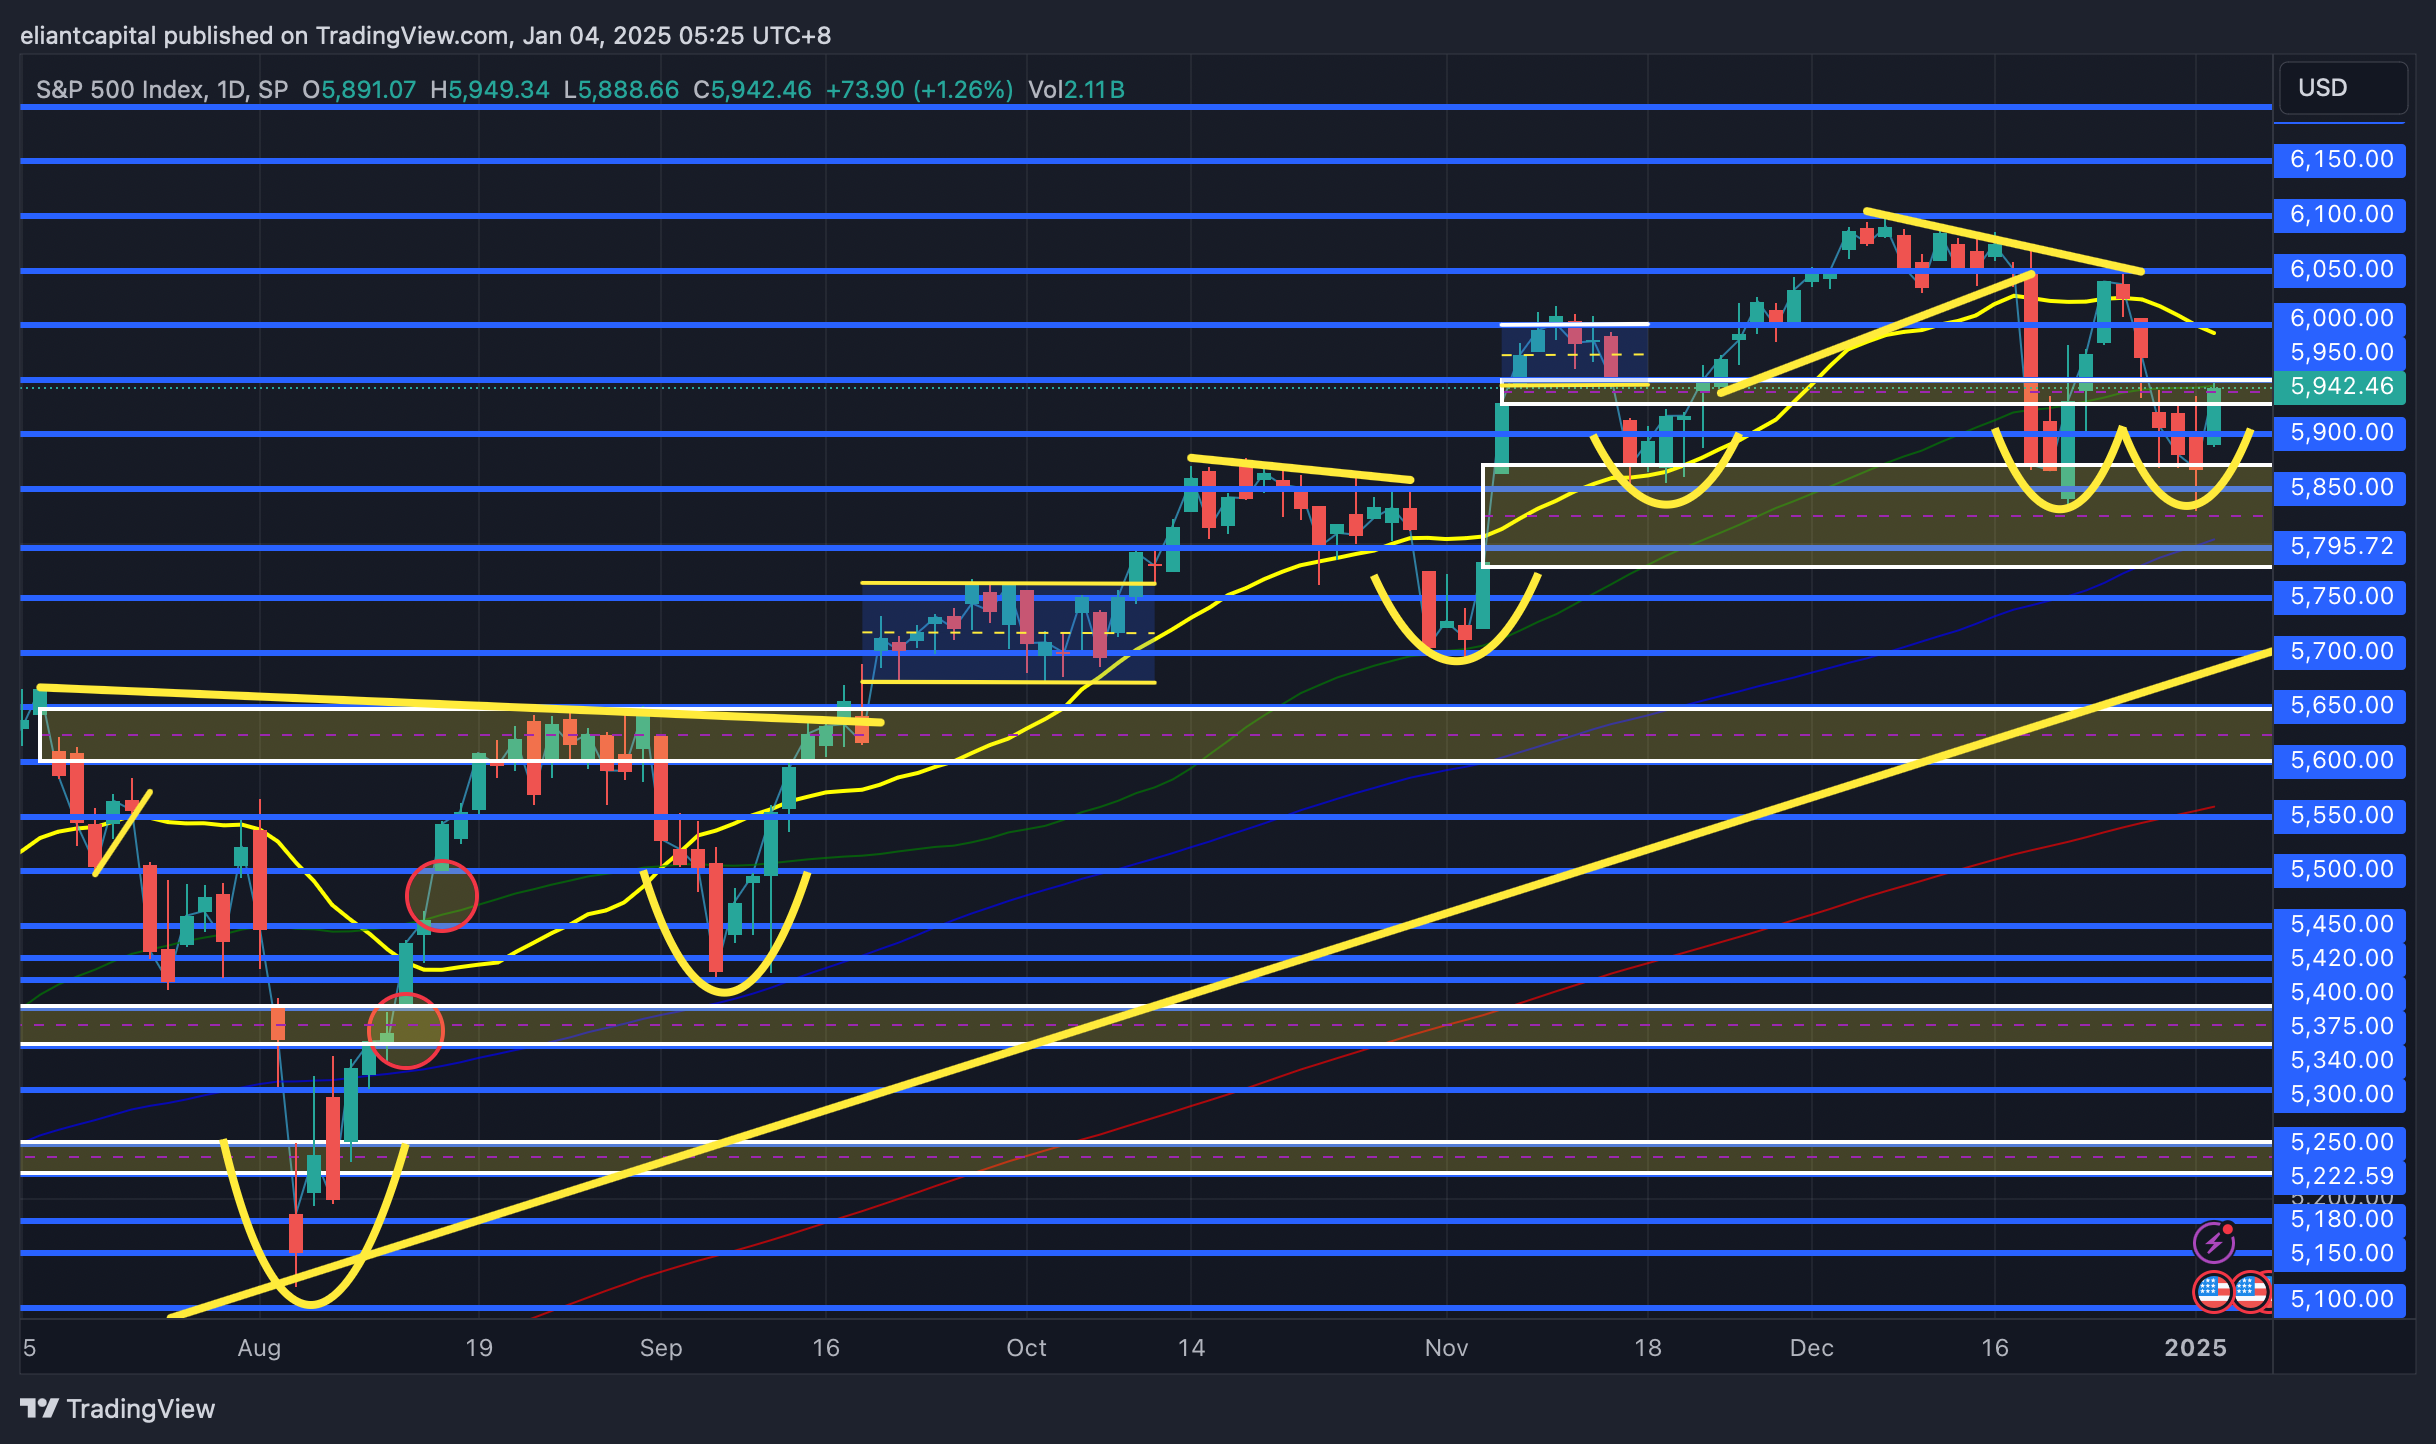
In regard to Spooz this past week, we ended up making a slightly lower low (a couple of ticks) before having a big rebound to finish off the week & Spooz essentially tapped the 20wk which came in as support along with this support TL dating back to the late ‘23 lows, so a good bit of supportive confluence with the current market junction.
Given the rebound on Friday & really two days of “good breadth” (despite indices closing lower on Thursday, breadth was still generally “good”), the % of stocks above the 20D MA had a decent rebound to finish off the week & has worked off a bit of those oversold conditions, but still generally remains in oversold territory, but definitely saw a bit of normalization / mean-reversion this past week.
Same story with the % of stocks above the 50D MA, although we haven’t really seen a big rebound comparatively to the % of stocks above the 20D MA as shown above & it still remains largely in oversold territory… yes, still sitting near the August lows when the Spooz was 800+ points lower & had undergone a 10%+ correction.
In regard to Spooz as we get ready to head into next week, we once again tried to fill the election gap this past week, but failed as 5850ish, give or take, continues to be a big LIS for bulls & it once again came in and acted supportive which arguably has set up this double bottom setup… especially along with the other confluence of the 20wk coming in supportive along with the support TL dating back to the ‘23 lows as shown above earlier as well.
Spooz ended up closing a tick below the 50d & still remains below the 20d as well & ultimately, for firm upside, I think we need to see Spooz regain 6050ish to start working back towards the highs / potentially new highs on the horizon… otherwise, we may see Spooz continue to remain rangebound between 5850ish / 6050ish, until one side ends up caving in… what could break us higher? Economic data continuing to hum along (Good jobs data / UER ticking lower) along with inflation remaining tame & disinflation starting to resume after this recent blip these past few months… on the contrary, economic data starting to weaken & or inflation data continuing to remain stubborn / ticking higher would add to pressure on Spooz thus likely breaking the rangebound action lower. If bonds as well do remain under pressure, that could put further pressure on Spooz / general indices as well, but following last week, I’d argue price action was very constructive, but we likely will see volume start to show up again this coming week now that we’re through the holidays, so we’ll see how things shape up, but as of now, even with Spooz still remaining below the 20d / 50d, I’d argue bulls have edge following Fridays close as the election bull gap continues to remain protected & supportive and as long as 5850ish continues to come in as support along with markets / under the hood still remaining generally oversold, I think there’s edge to lean towards upside.
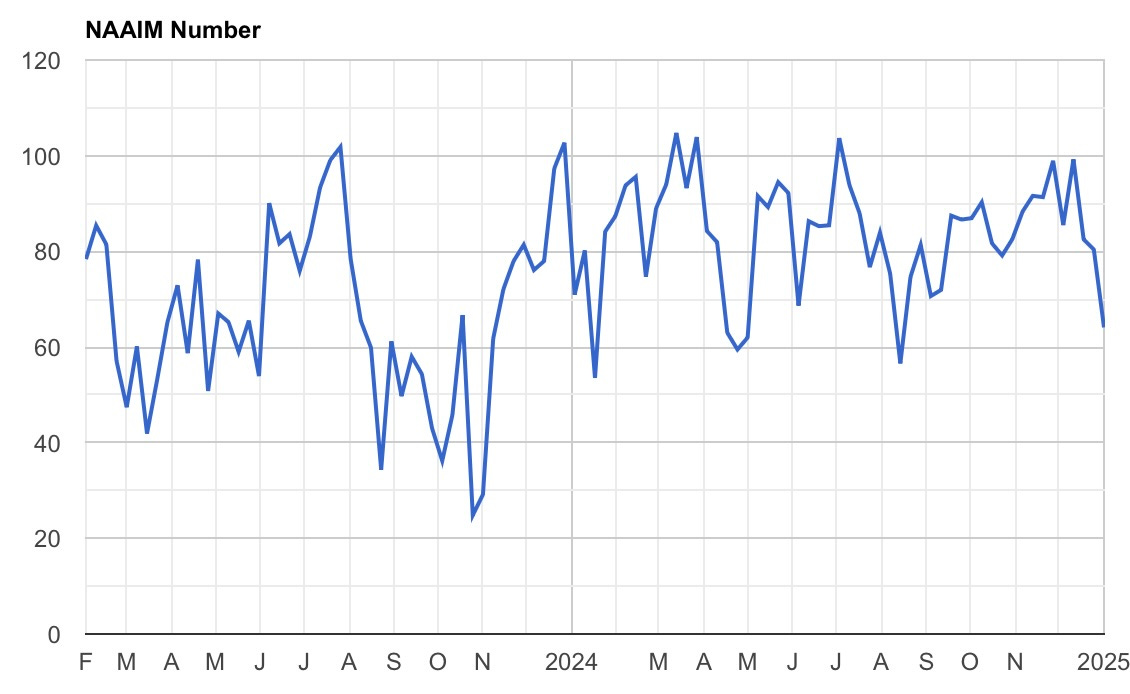
Something else worth pointing out is NAAIM dropped off quite a bit this past week… for those unfamiliar, the NAAIM Exposure Index measures the average exposure to U.S. equity markets reported by members of the National Association of Active Investment Managers. It reflects the sentiment and positioning of active investment managers, with values ranging from -200% (leveraged short) to +200% (leveraged long).
Well, given the price action in December of ‘24 & the de-grossing that we saw, NAAIM coming off the highs of near 100 to now nearly 60 does make a lot of sense, but it also means we could be reaching a potential pain trade if markets start to continue to trek higher & even head to new highs given the recent de-grossing we have seen & equity exposure coming down quite a bit… if you’re a PM / HF mngr. & lagged the indices this past year & goal is to outperform this year, you’re likely most fearful of kicking off the year with under-performance, so if economic data continues to remain supportive / fuel for indices to head higher, it could lead to a bit of a chase in regard to getting equity exposure back on after this recent de-grossing… just something else to consider & keep in the back of the mind.
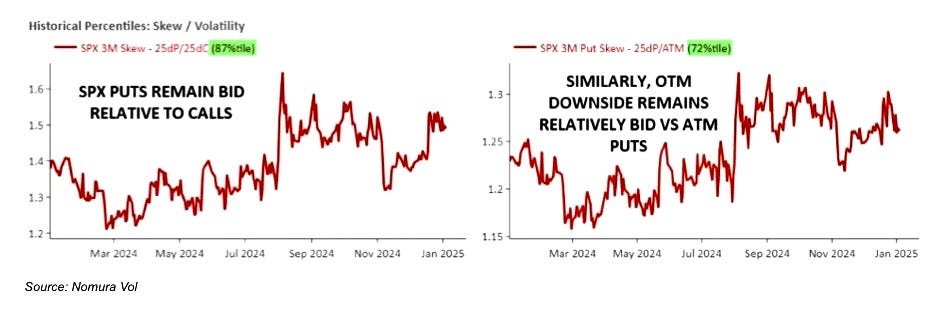
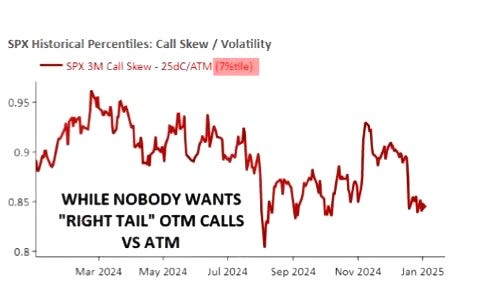
I thought these were two interesting charts worth sharing as well from Nomura Vol, but essentially, everyone is worried about left-tail in regard to hedging & not right-tail… the upside trade isn’t crowded at all whereas the downside trade is where individuals seem to be solely focused on.
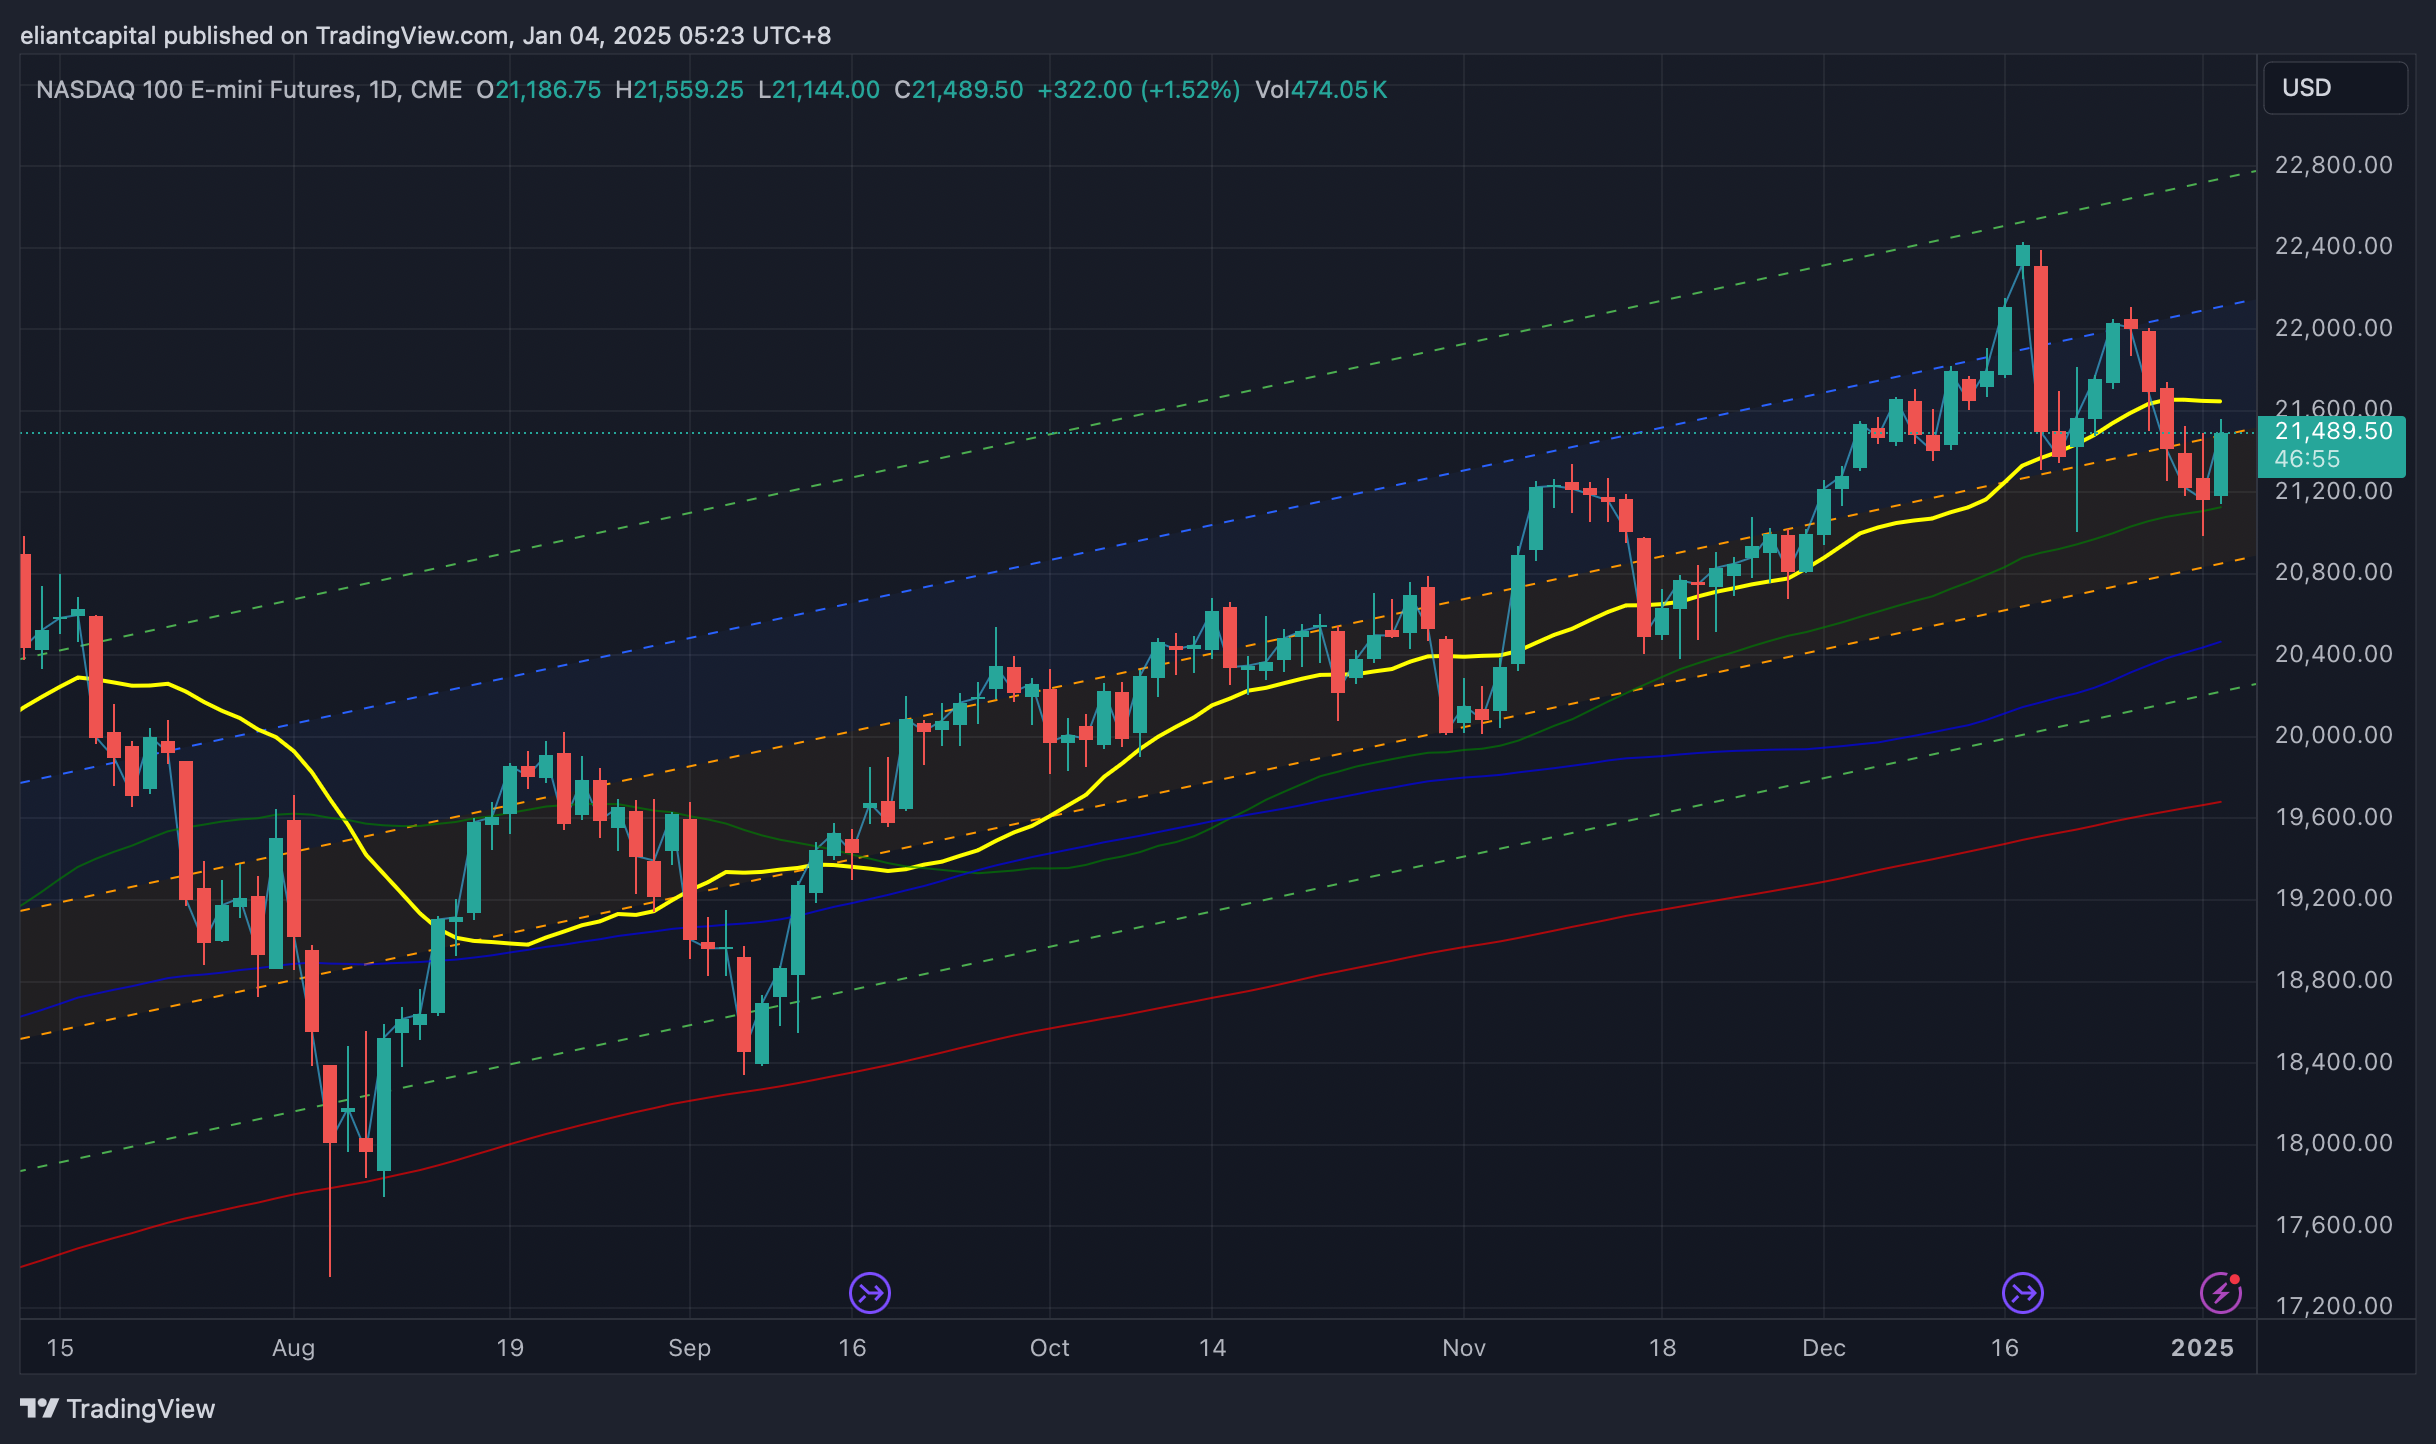
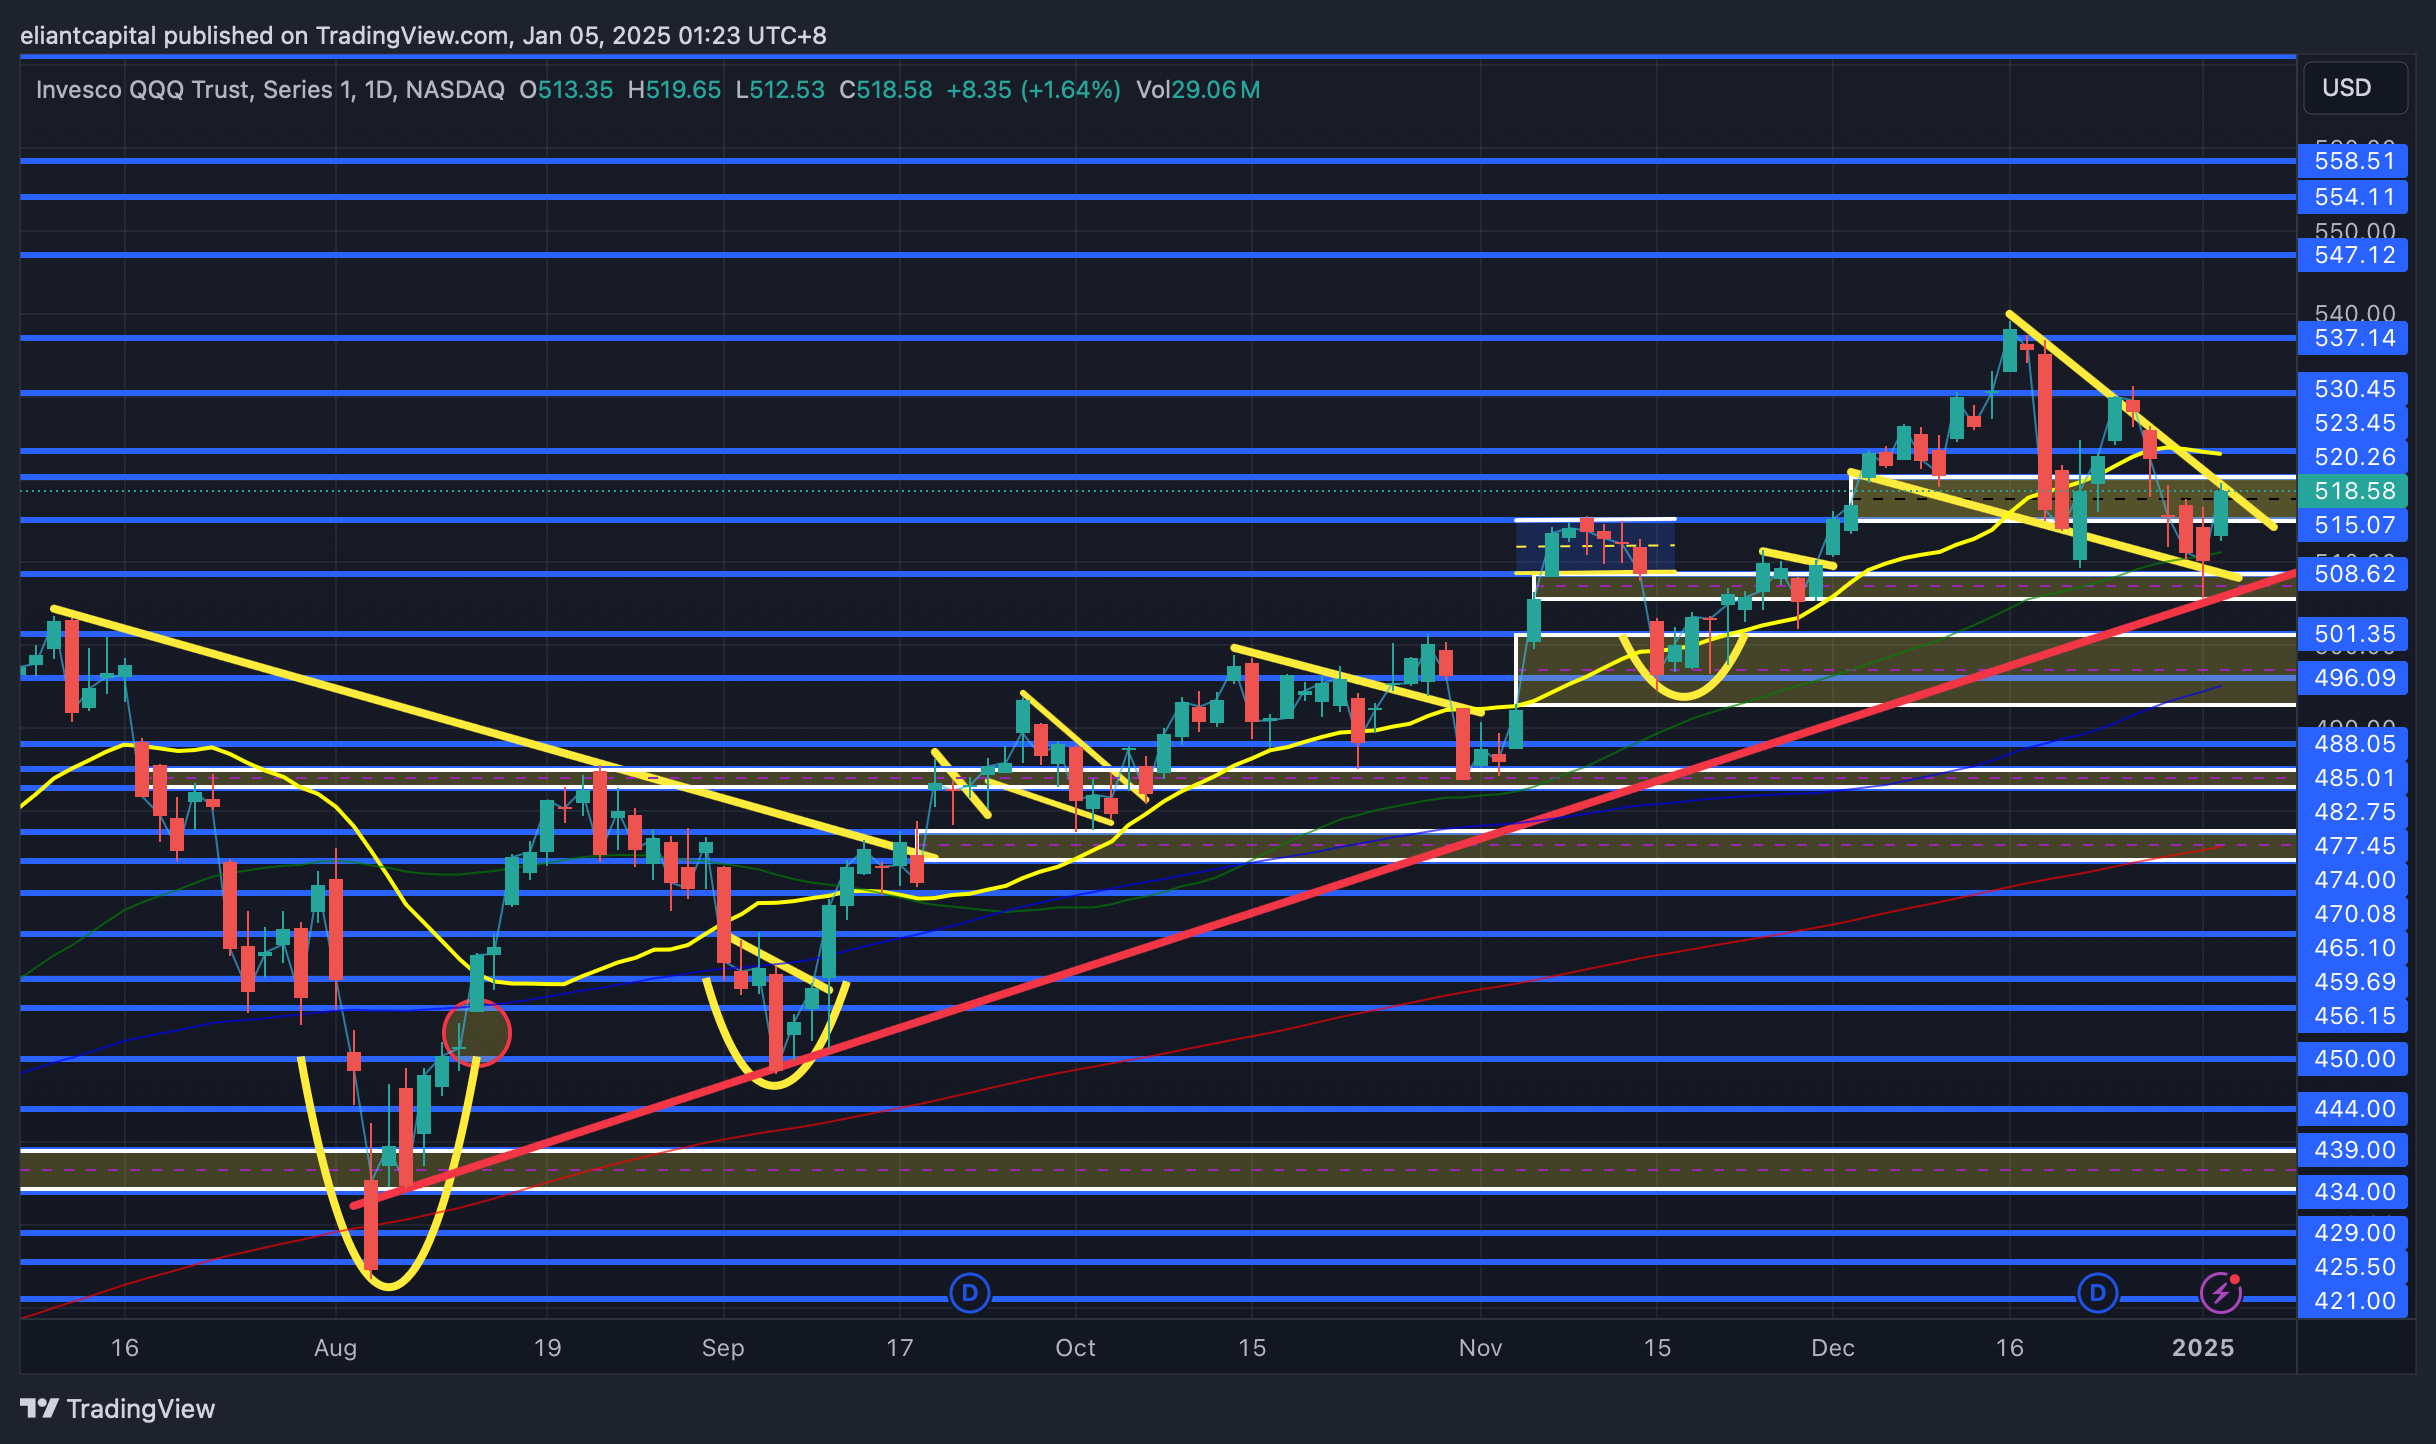
- QQQ
The Q’s ended up finishing off the week on a quiet note, closing up around 60bps after being down over 150bps on the week at one point & we also ended up seeing a 130bps spread between the Q’s & Small-caps, so a bit of a rotationary signal this past week.
The Q’s ended up closing the week out above this support TL dating back to the August ‘24 lows which has held & acted as support in several instances prior whilst also closing the week out just below 20d, but above the 50d as it ended up coming in as support this past week as well for added confluence along with the support TL dating back to the August lows of ‘24 as well.
As we look ahead into next week, the Q’s did end up making a lower low this past week, but bottomed right near the 50d (did a look below and fail), and the Q’s ended up snapping back higher to close out the week strong on Friday. The Q’s currently look like they are within a falling wedge / flag right into the 50d / support TL dating back to the August lows, so I would argue that as long as last weeks lows hold near 508ish, bulls will continue to remain with edge, but for more firm upside action, we likely need to see the Q’s regain the 20d near 520ish to start working higher towards the 530 - 537ish range. If we were to see last weeks lows taken out / they falter, we could see the Q’s rollover to retest the 100d near 501 - 496ish which also happens to coincide with the Mid-November lows, so that should be a bigger support in general if it were to be tested.
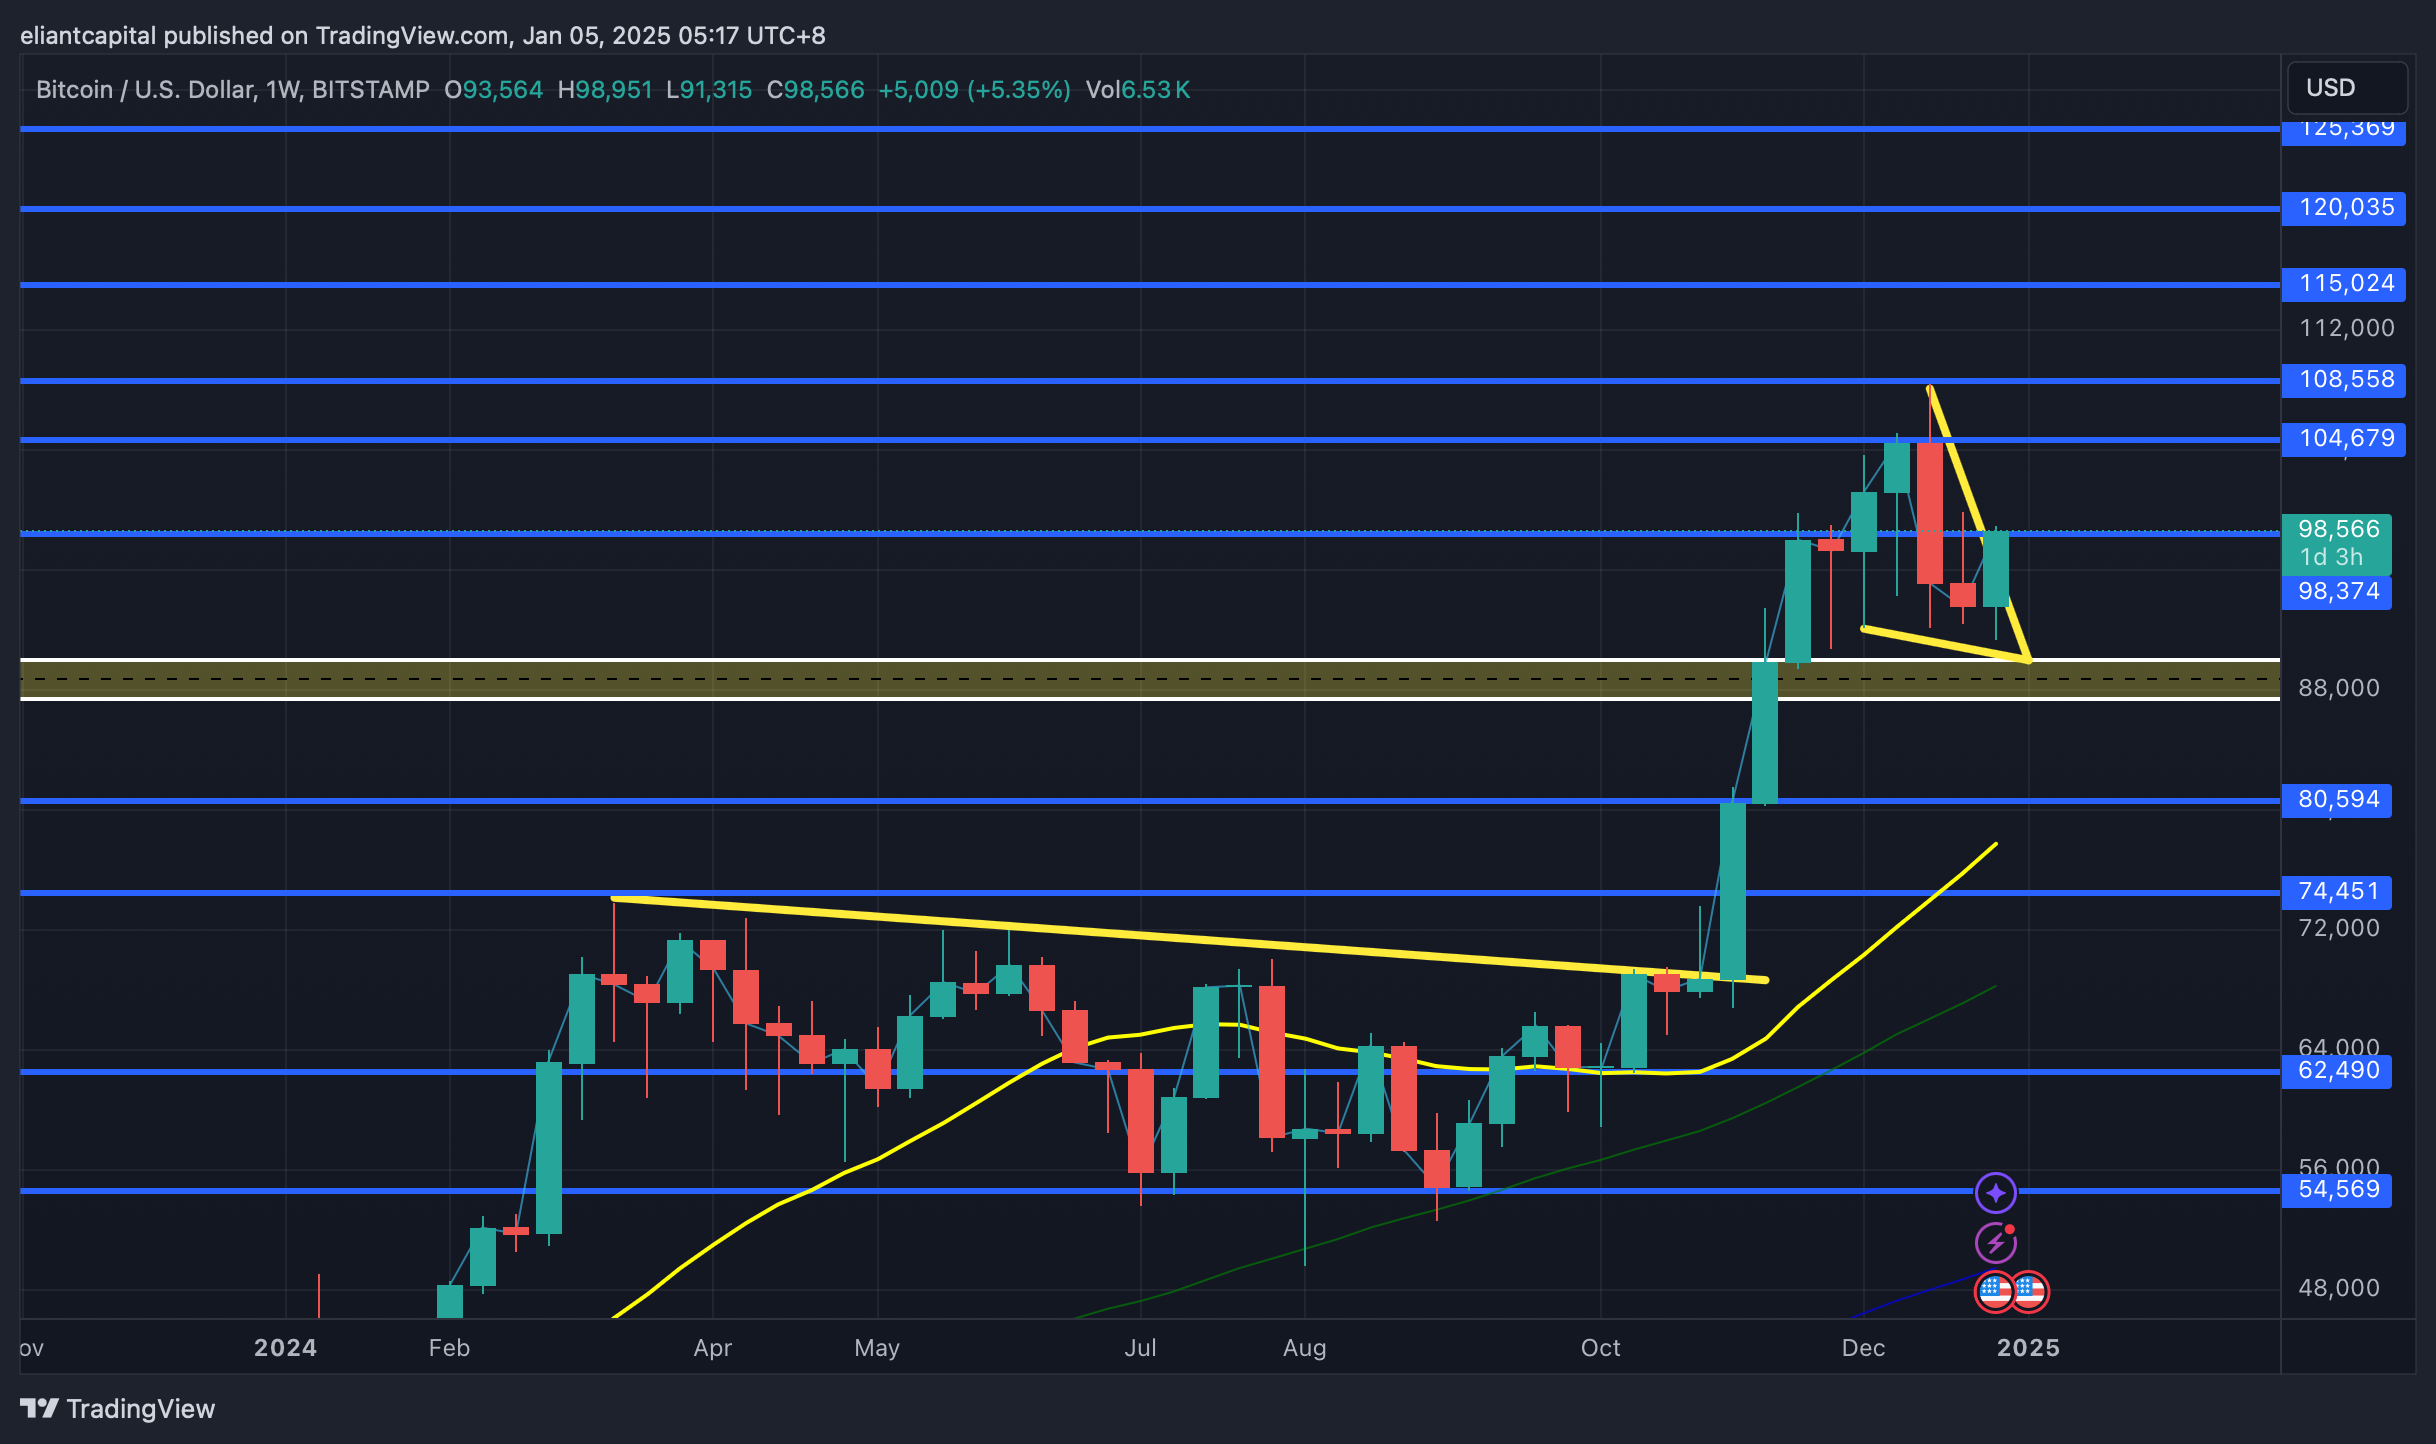
Something else I wanted to talk about this weekend given inauguration is coming up & its no secret the incoming administration is very pro-crypto is Bitcoin & COIN.
Bitcoin saw a decent pullback from its highs, 108k → 90k in the period of a couple of weeks & Bitcoin has since snapped right back up towards 98k & this recent action more so looked like a retest of demand & now Bitcoin is edging higher out of this wedge / flag pattern… I think as long as the lows near 90k hold, we likely will see Bitcoin breakout towards 115-125k range.
We already have exposure towards the miners & have done generally well in that area & still remain long and positive (CORZ / IREN / BTBT), but I do think COIN looks fairly good here as well… corrected 30%+ off the highs & is now wedging / flagging similar to Bitcoin in itself & given the continued MSTR dilution, it wouldn’t be of too much surprise if capital started to rotate a bit more towards COIN as they’re arguably a bit more investor friendly… risk on the setup essentially being a loss of the 20wk / highlighted demand zone below fails to come in as support with interim and extended targets above for a 3.36 risk-reward ratio (long again 232 to target 400).
If wanted an upside bet / to express via options, I think 330/400C spreads for 3/25 for around 10.00 with max risk being premium paid & max return being around a 6X as a fairly good expression as well.
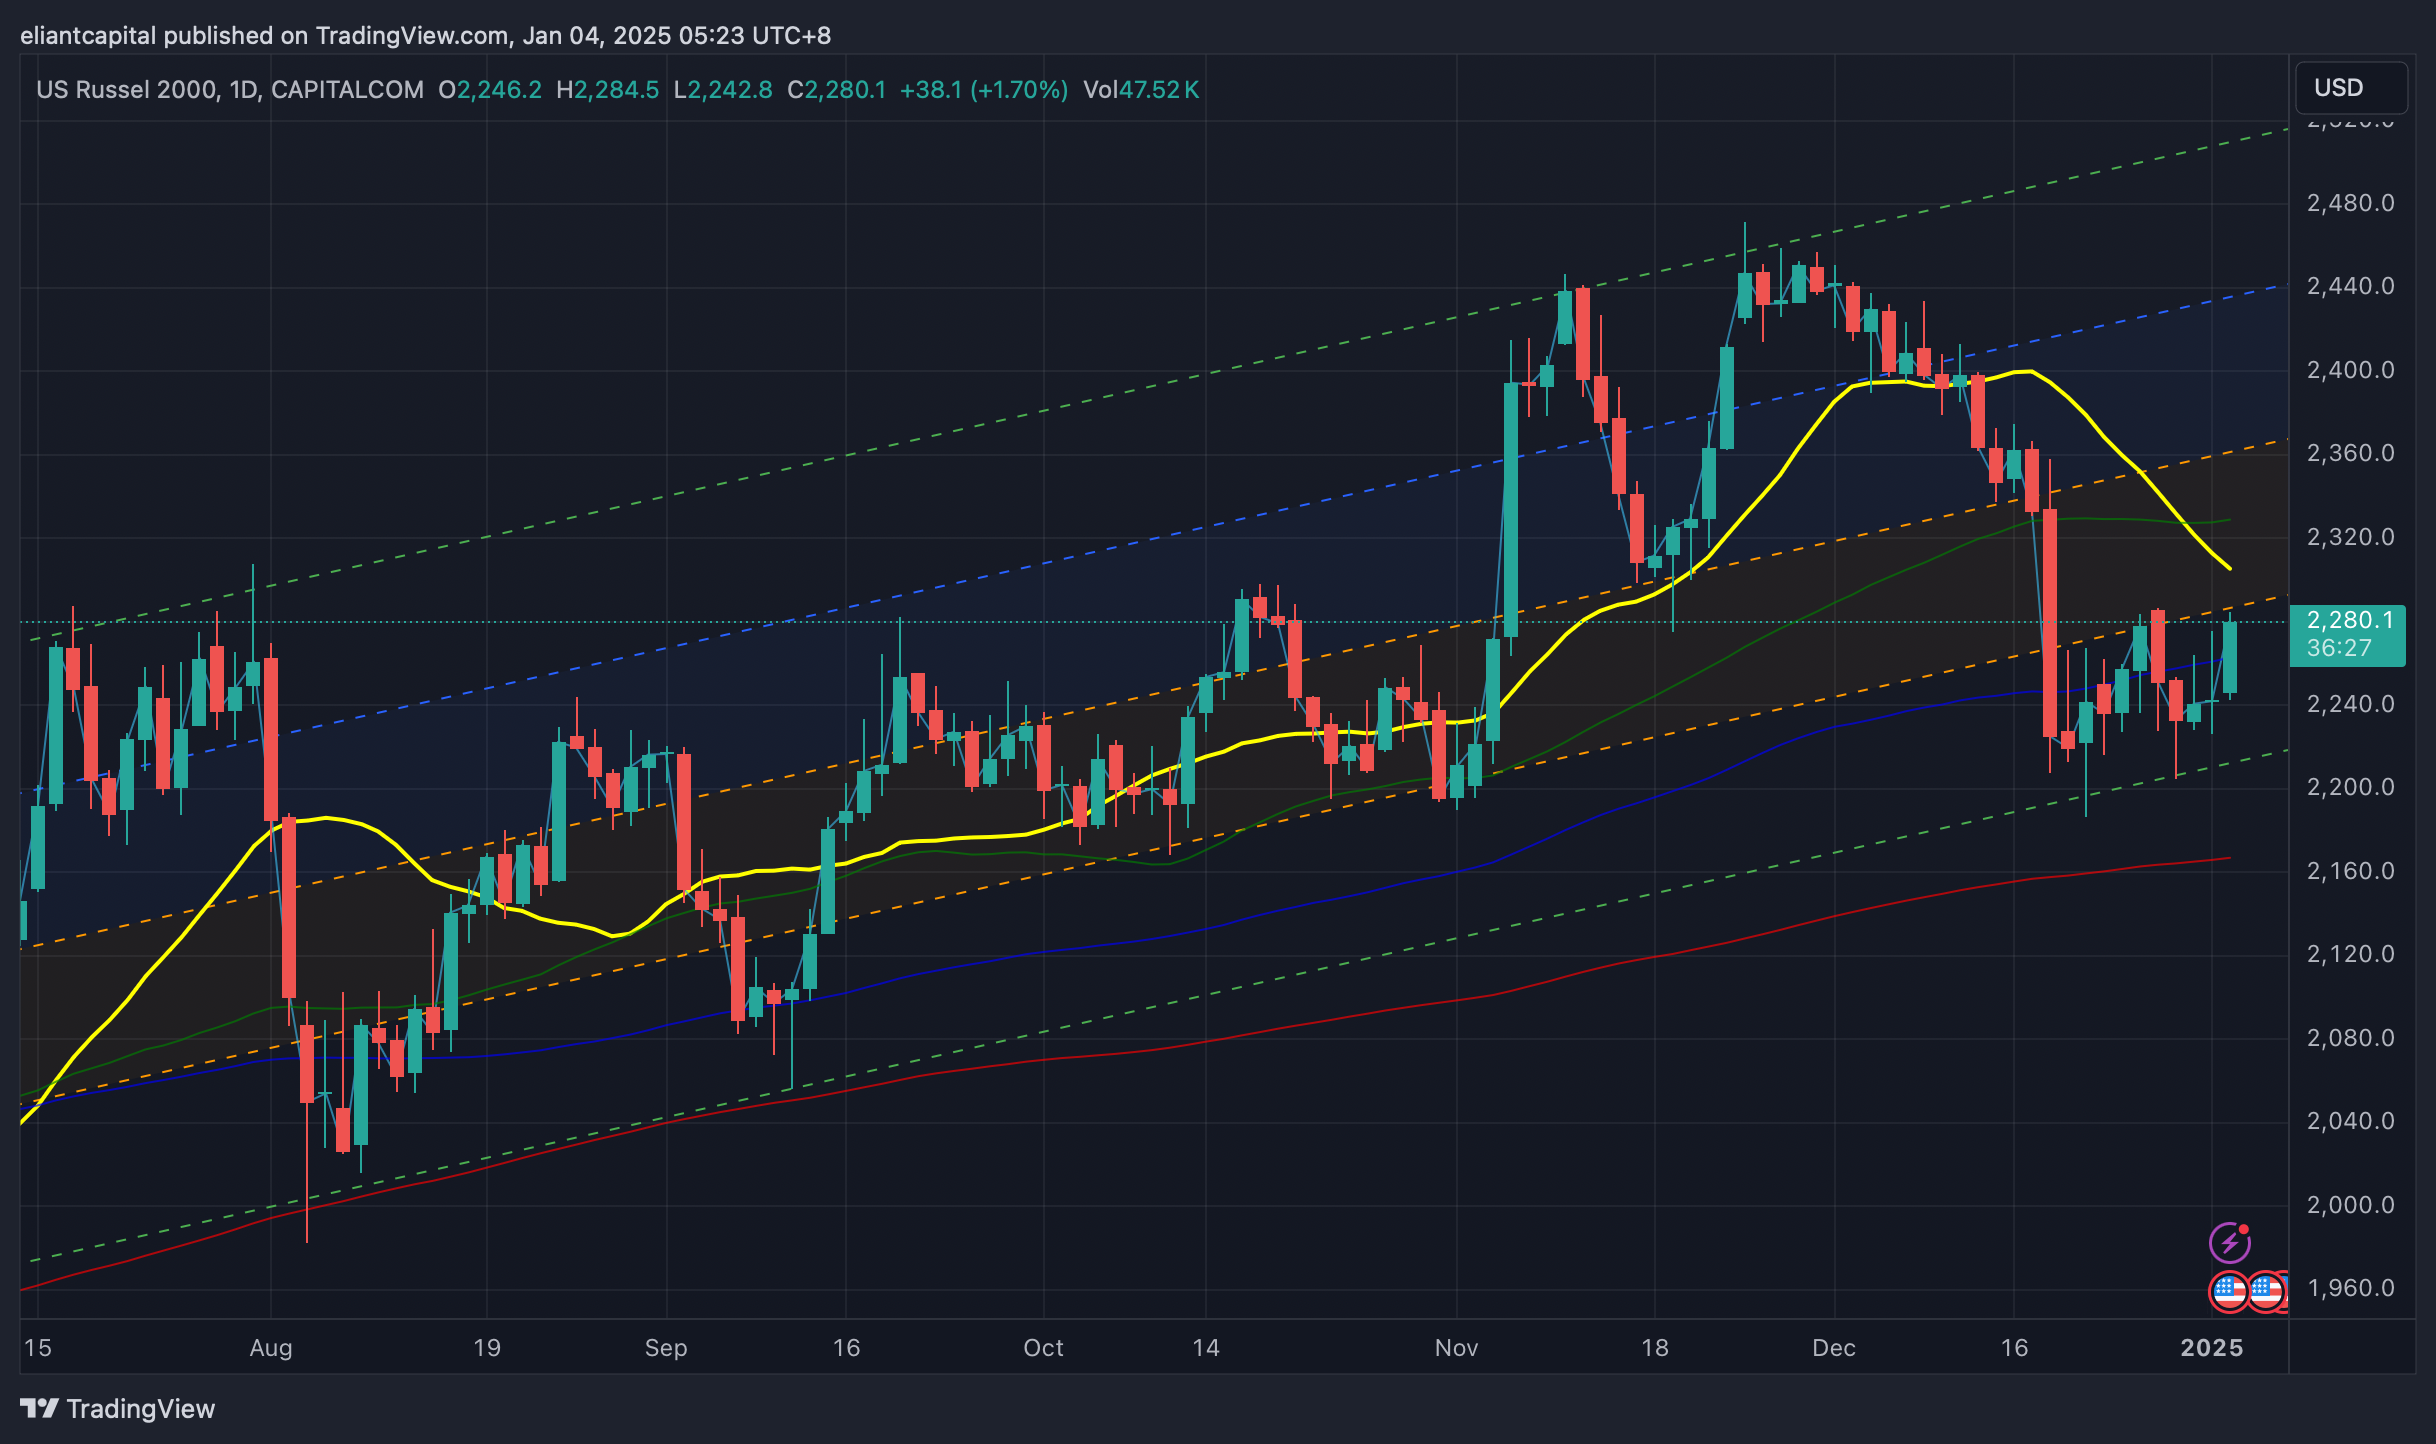
- IWM
As we noted above, but small-caps ended up being the best performing index this past week, closing up just over 160bps & there ended up being a 100bps spread between the Q’s and Small-caps… a bit of a rotationary signal.
A potential higher low in IWM/QQQ?
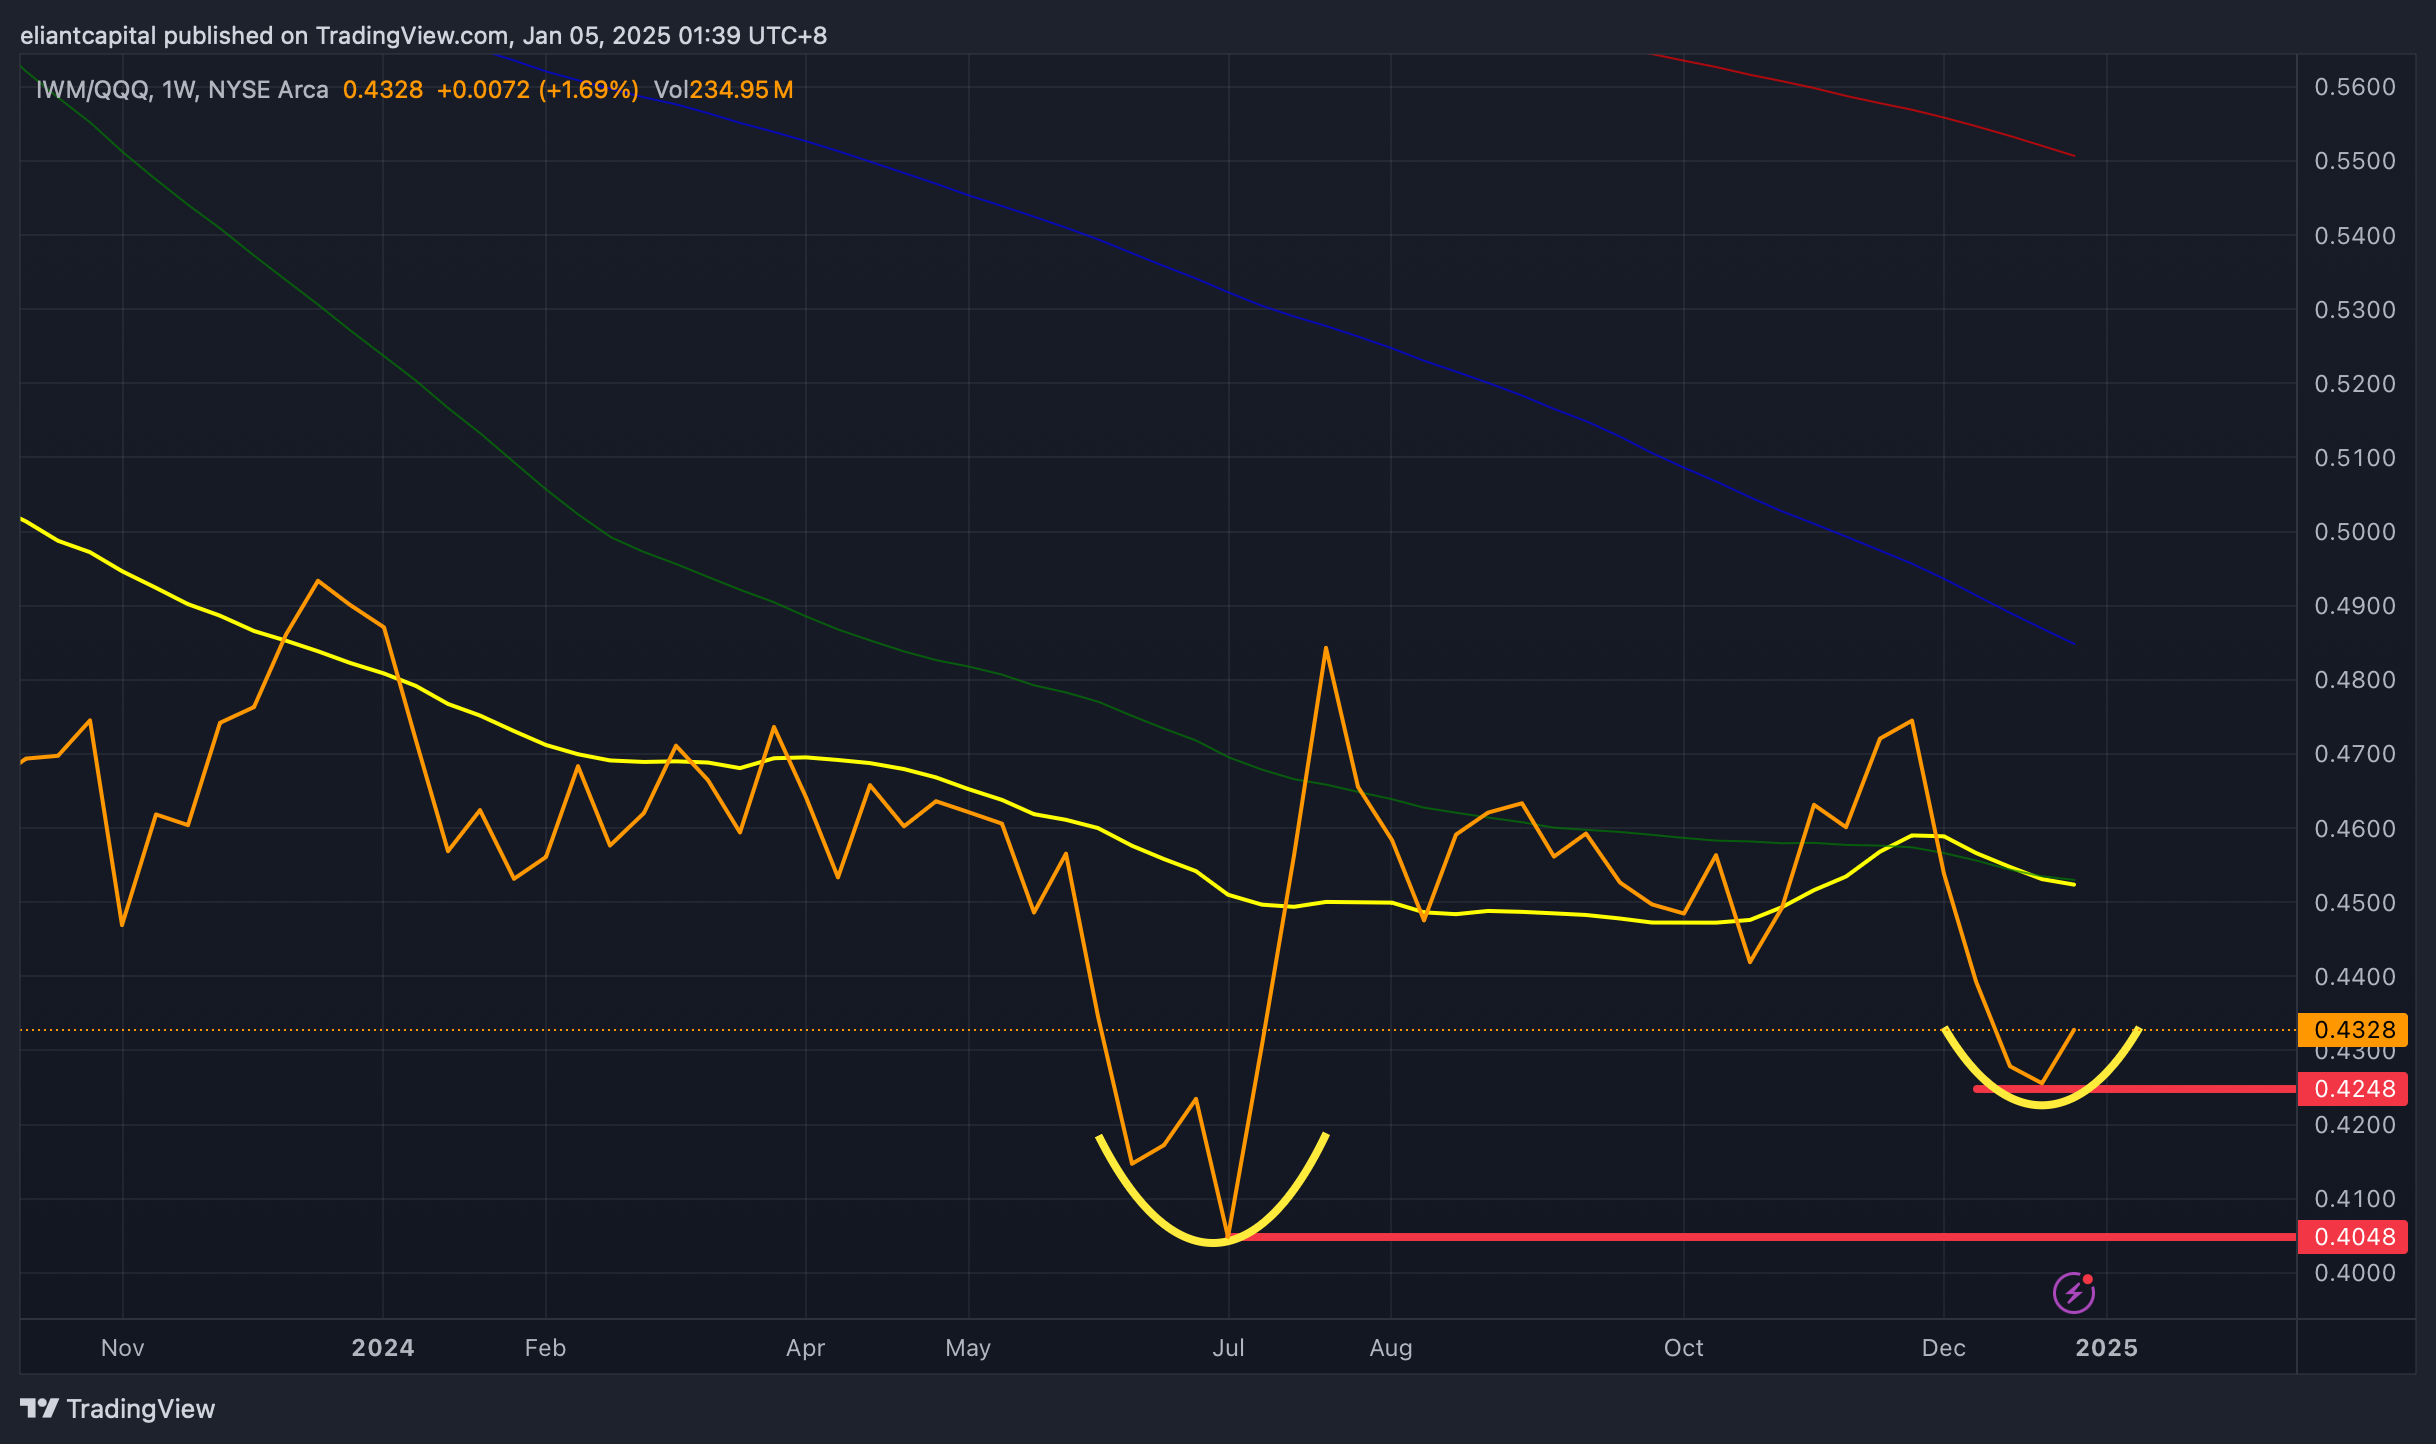
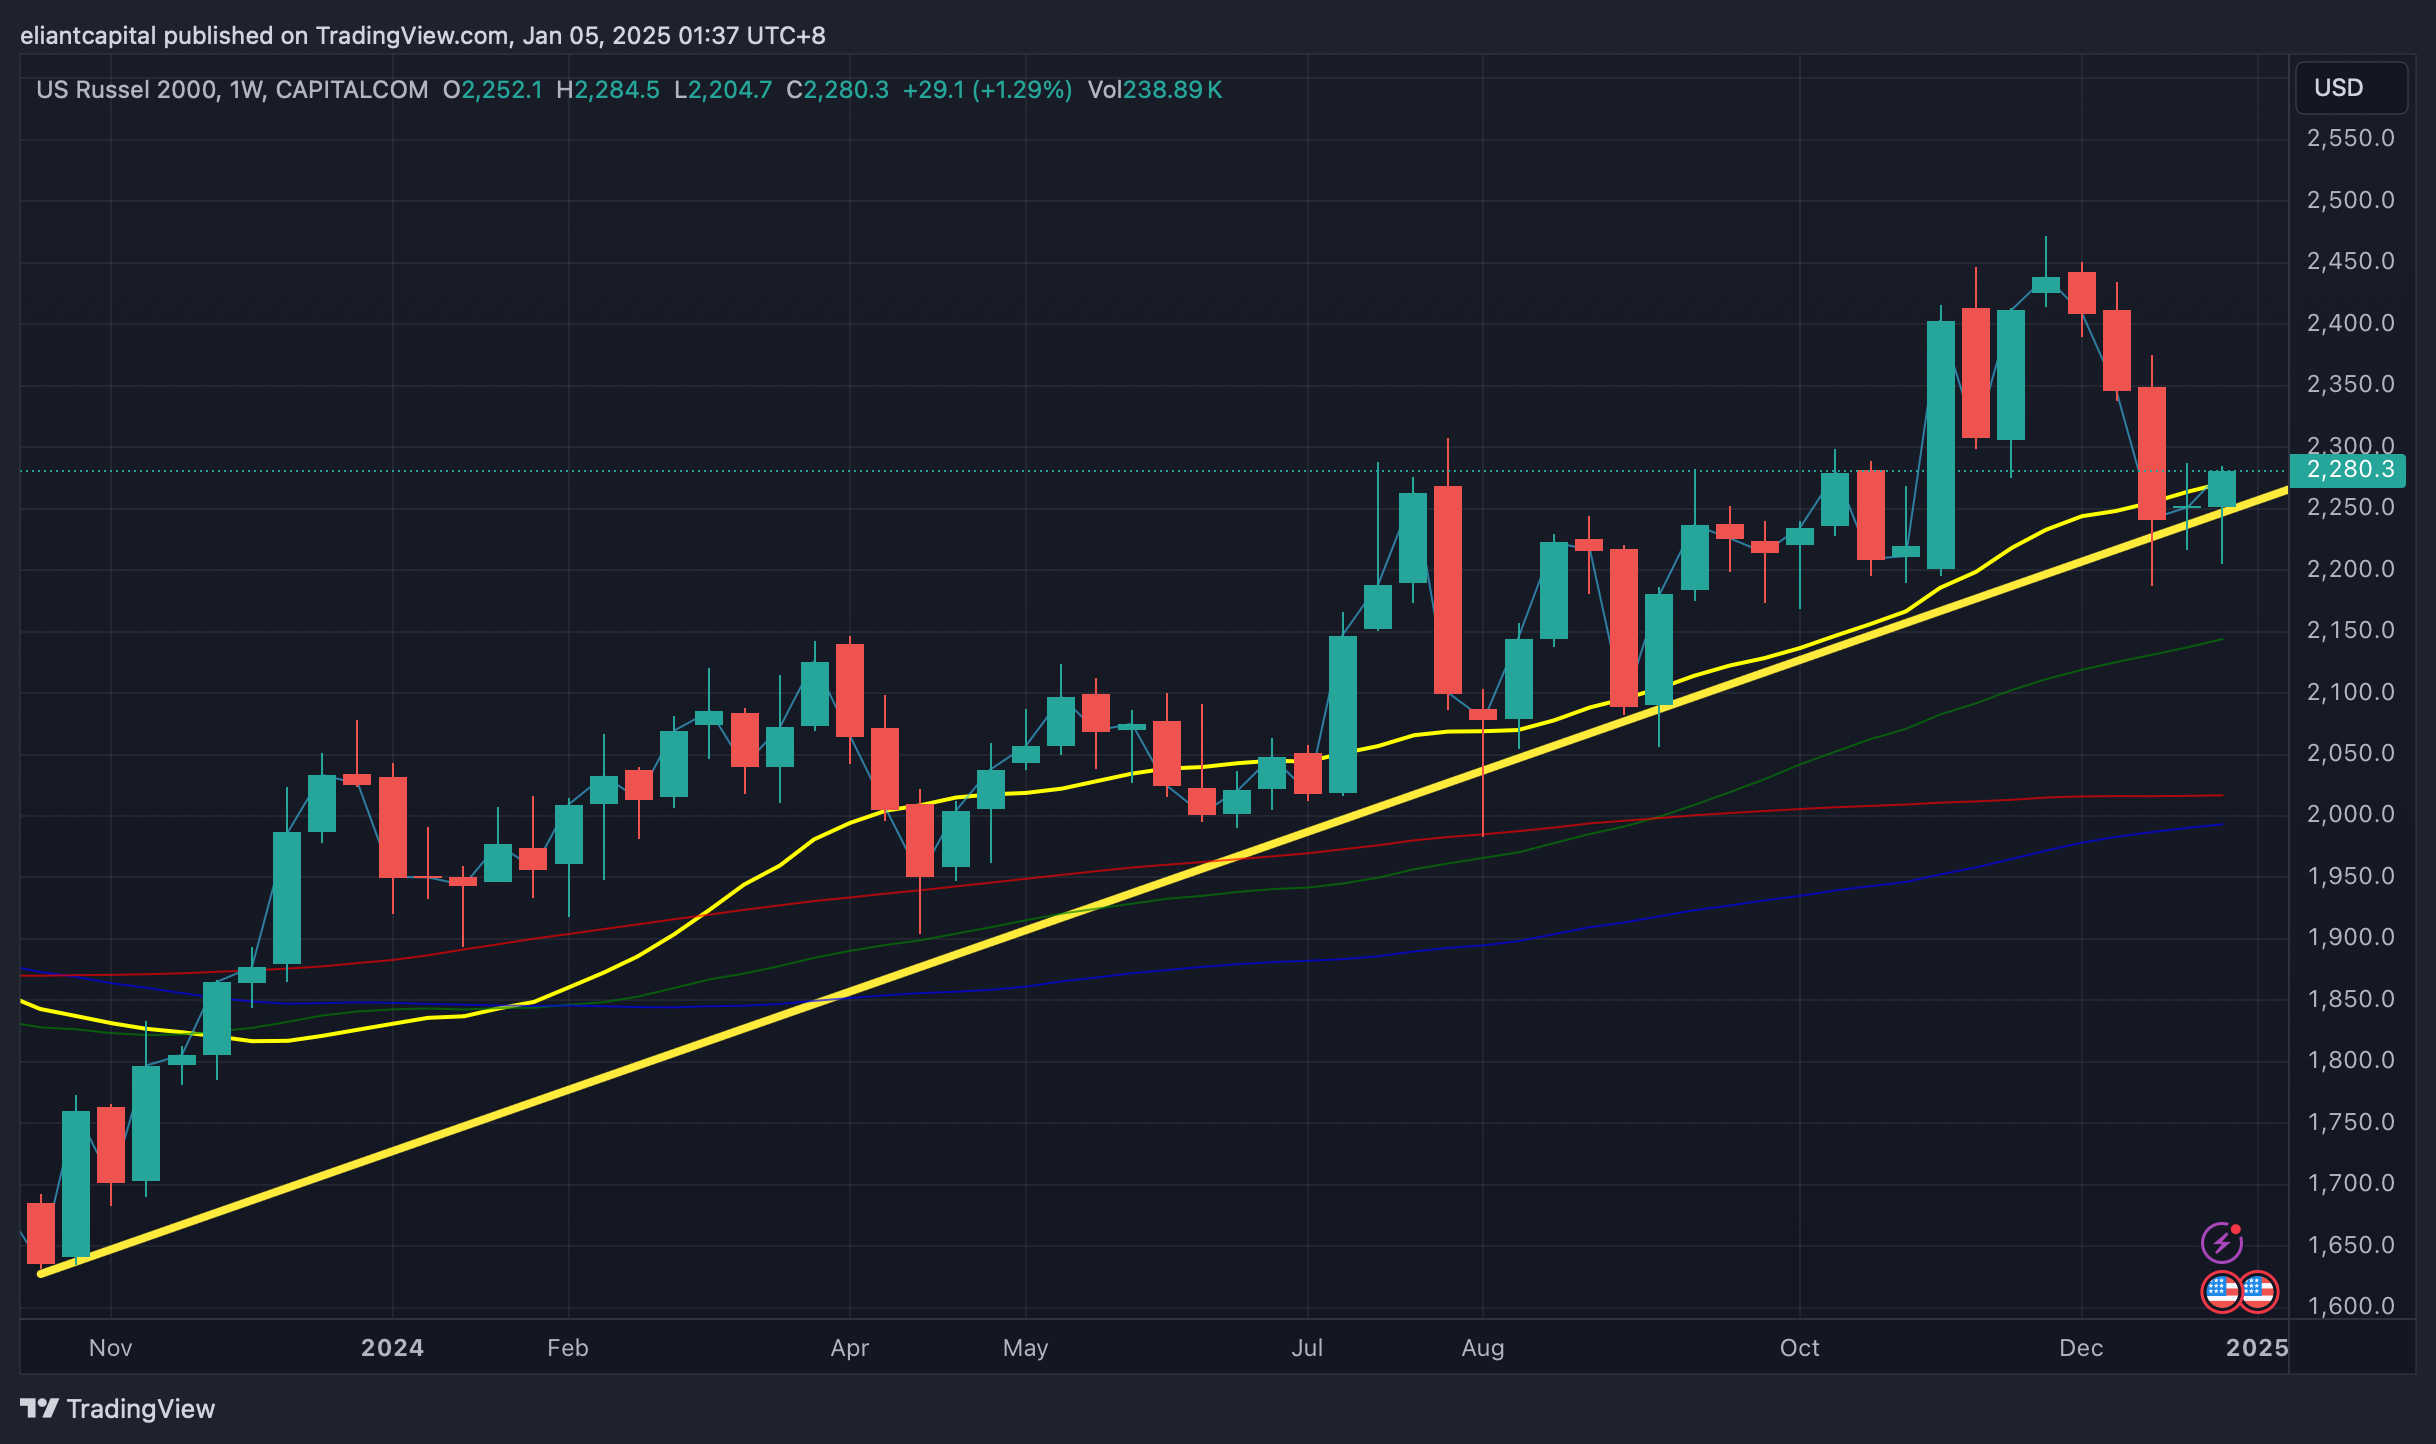
Small-caps once again ended up finishing the week above this support TL dating back to the late ‘23 lows as well as finishing the week off above the 20wk as well… big areas of confluence holding definitely gives edge to bulls for now in the interim.
As we noted earlier, but we do have a plethora of jobs data next week… jobs are expected to come in around 150k whereas the UER is expected to remain unchanged near 4.2ish… thats a fairly goldilocks #’s in regard to expectations… if jobs were to be reported at expectations, I’d expect small-caps to perform the best, keeping in mind we still have plenty of other jobs data throughout the week as well.
Another factor that has weighed on small-caps as of late is the recent & continued decline in bonds… If we were to see bonds stabilize around these levels / potentially revert higher as small-caps hold this area of confluence (support TL dating back to late ‘23 lows / 20wk / 100d), I think we could see small-caps mean revert higher towards 228 / 230ish (20d / 50d) before potentially being met with resistance & for further upside to start to work back up towards the highs, I think we will need more firm confirmation that this recent blip in inflation was indeed a blip & disinflation is now back intact along with economic data continuing to be generally supportive as well (goldilocks).
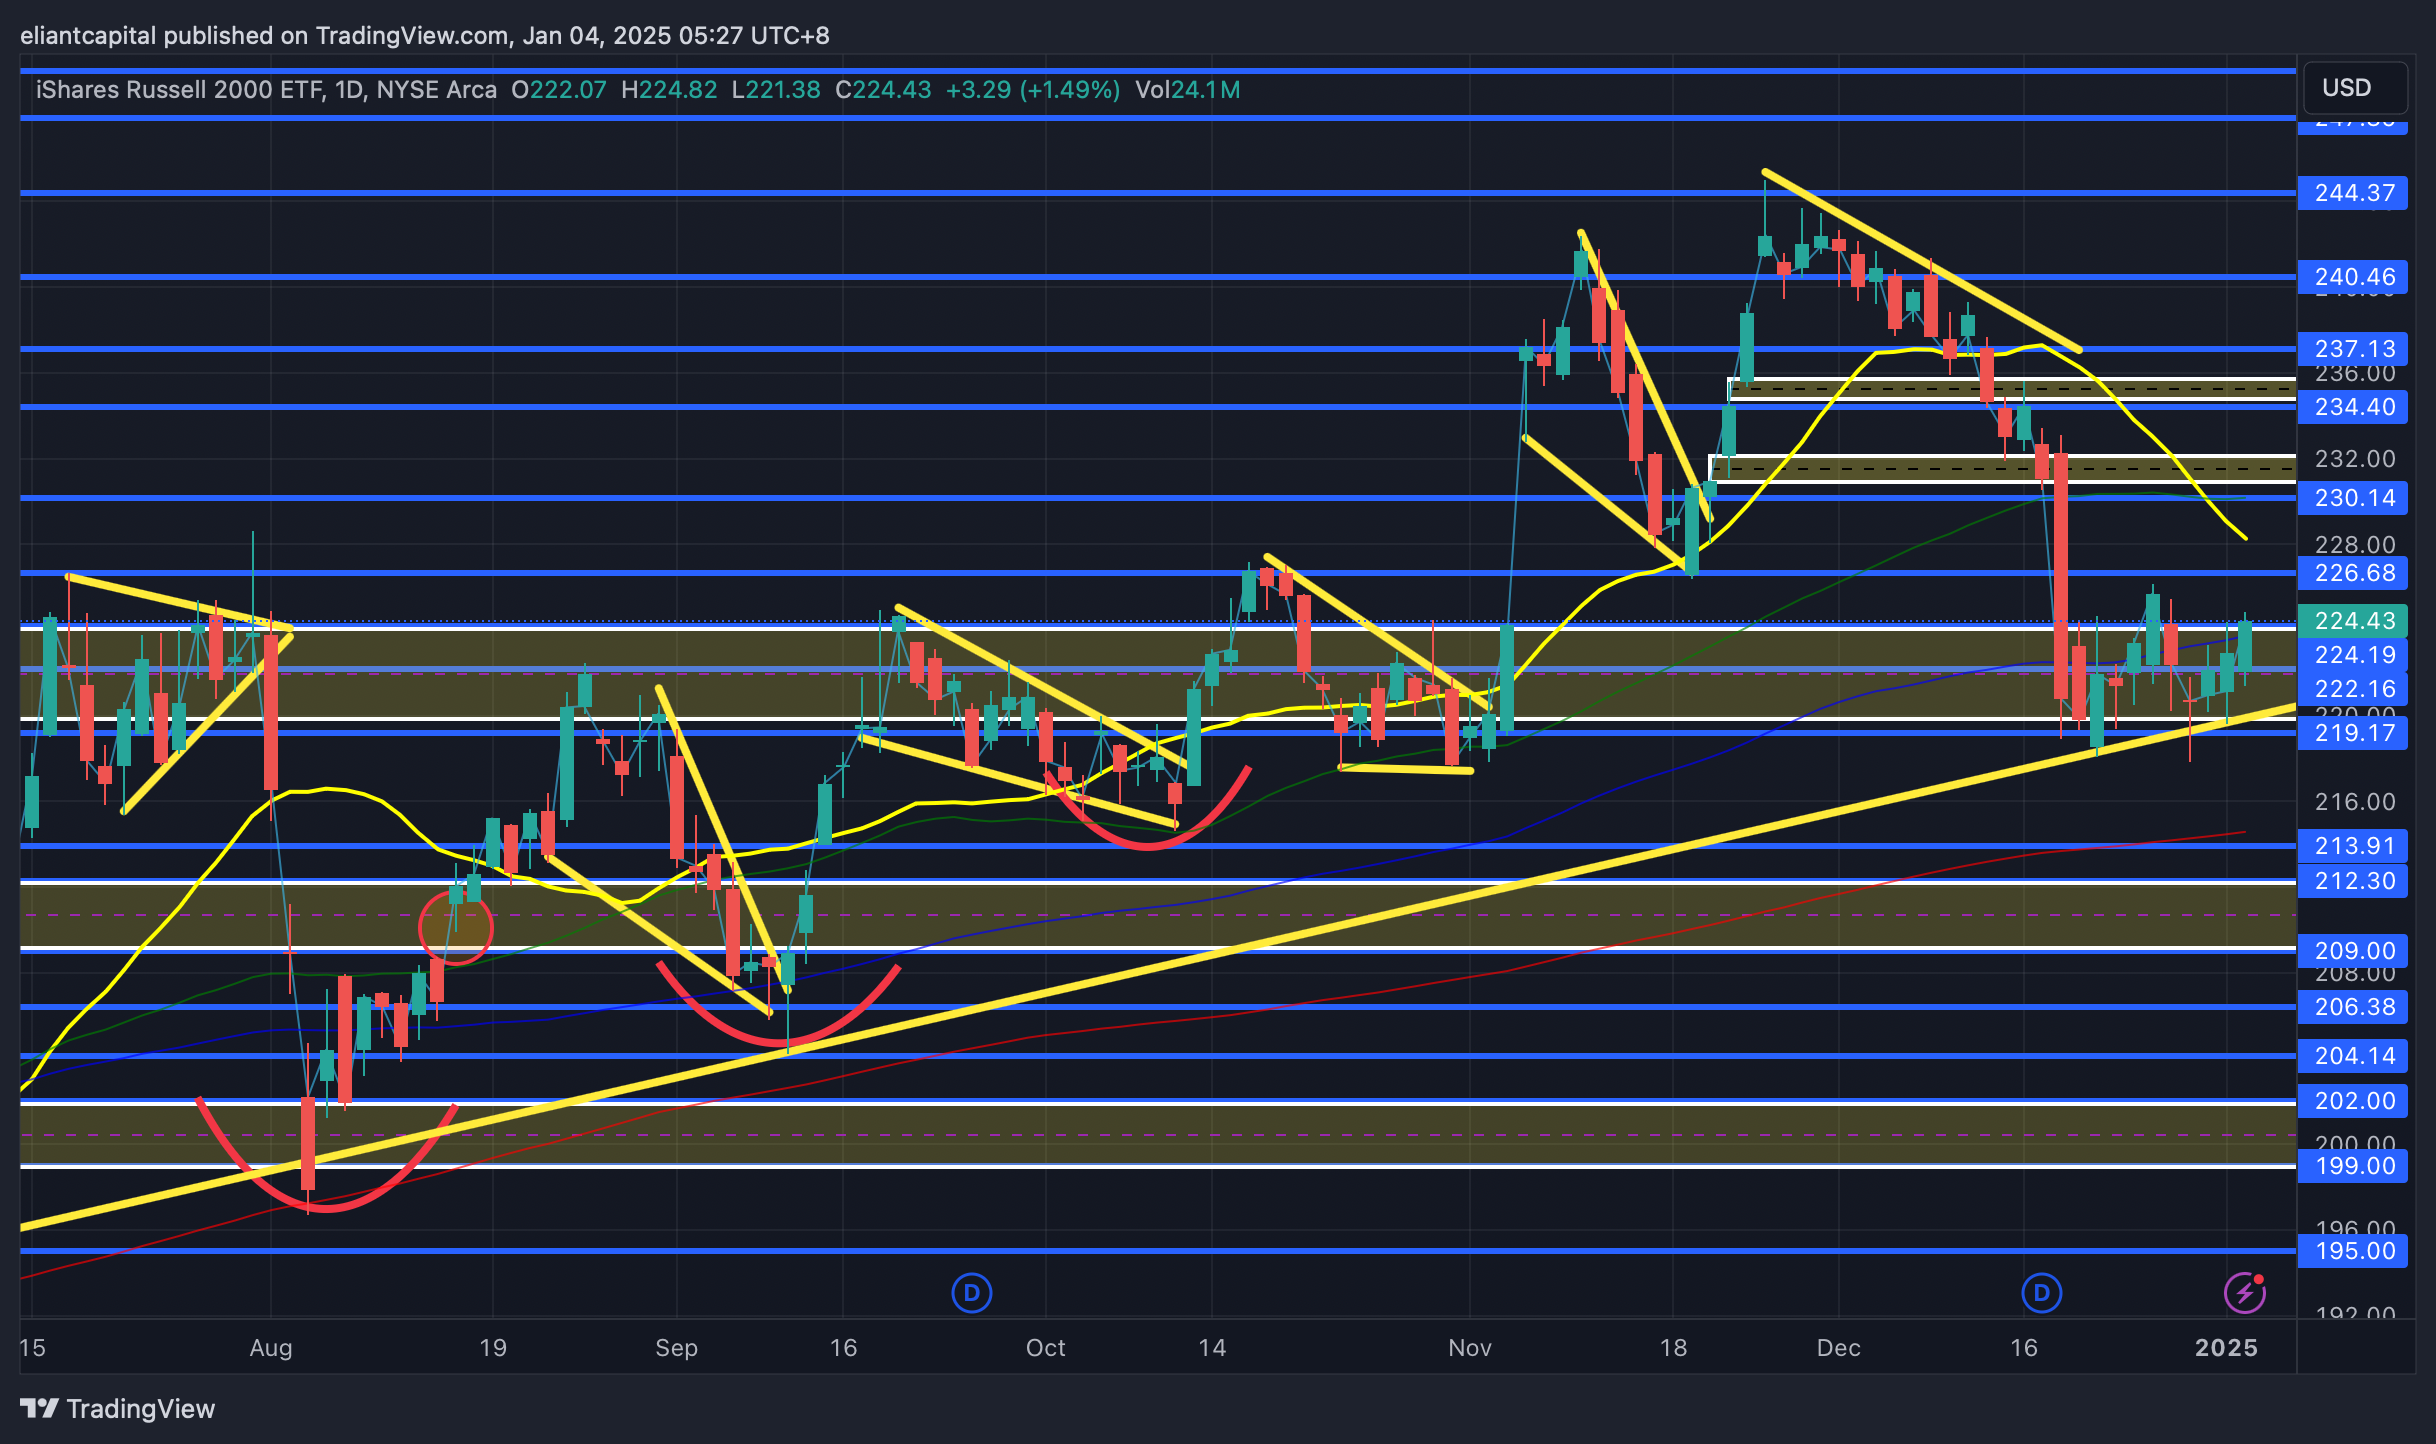
On the contrary, if the pressure in bonds continues / goldilocks data gets invalidated (bad jobs data this week / higher inflation data), I think we could see IWM flush below this longer-term support TL dating back to the ‘23 lows to go on and retest the 200d below around 214ish which also pretty much coincides with a bigger demand zone (209-212ish highlighted demand zone below), so it generally should be a bigger area of support if it were to be tested. Small-caps do still remain in a trend of higher lows & higher highs & barring recessionary data, I still think small-caps are a favorable risk-reward around these levels, again, given the facts that we’re likely at peak hawkishness & or right about there (need to see disinflation resume in ‘25) / along with the technical confluence lining up as we’ve covered & lastly, a big driver of the selloff as we’ve noted has been due to pressure in bonds & with sentiment remaining stretched, it doesn’t take much to see a complete narrative shift (softer data likely needed) to see a bigger snapback in bonds which would then lead to relief across all markets, but especially small-caps specifically.
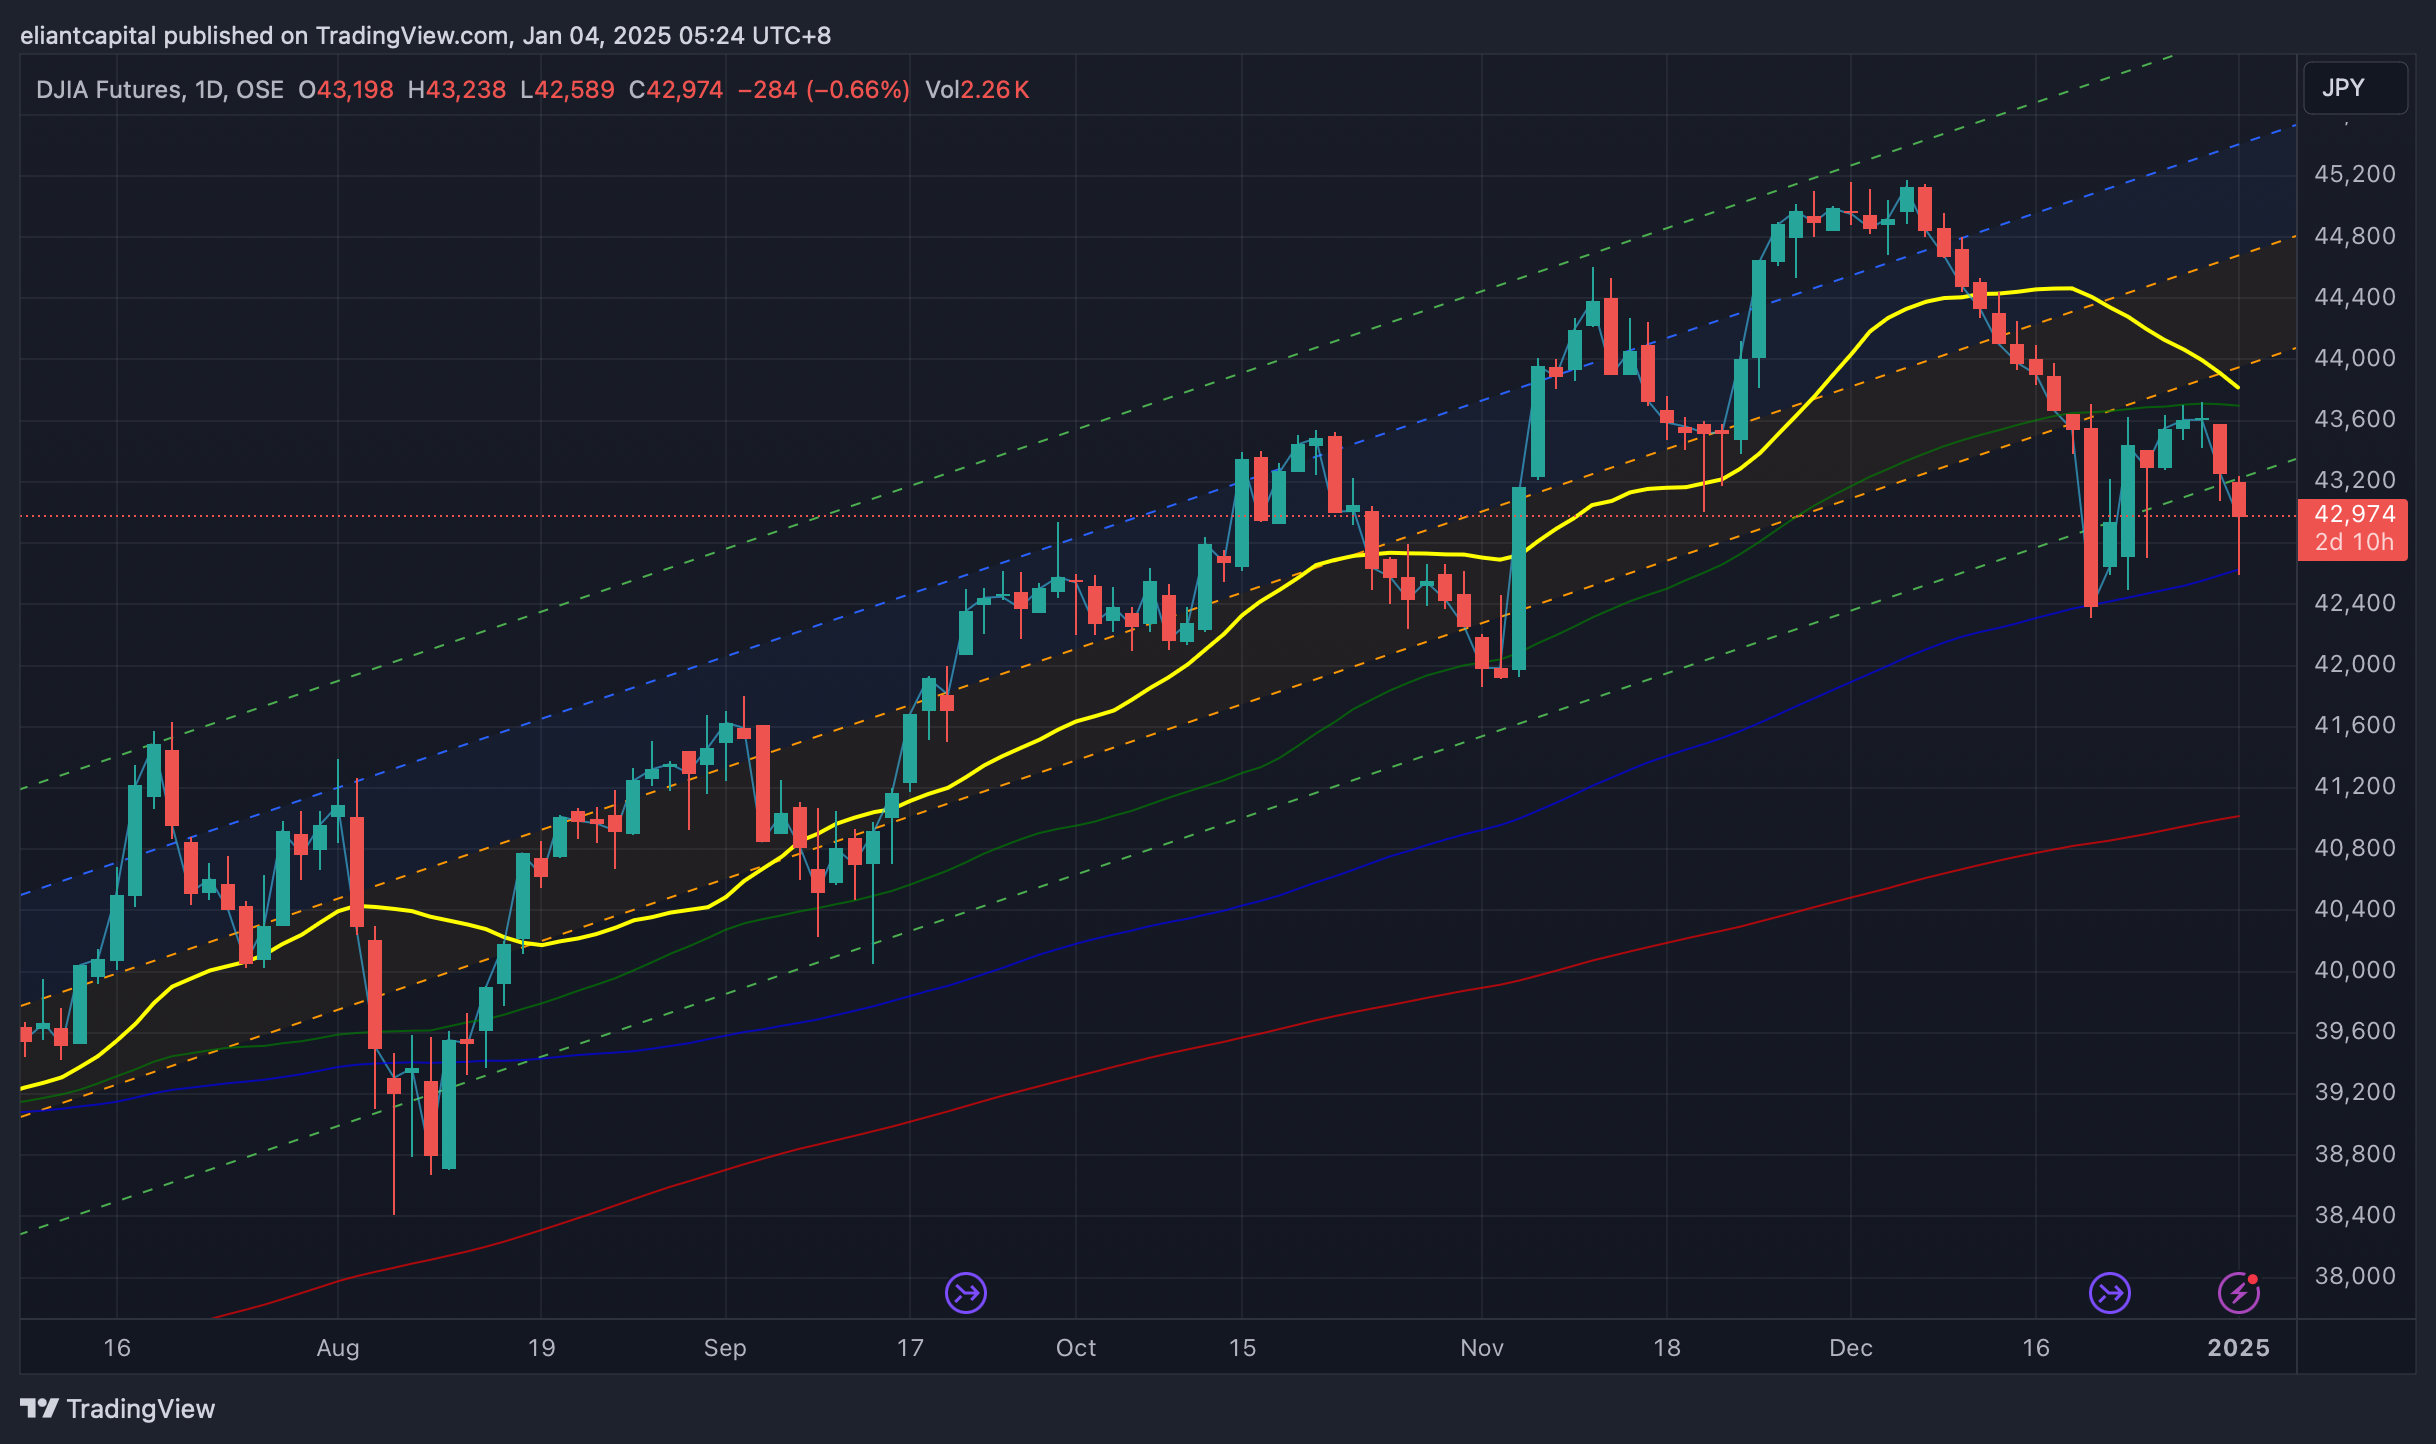
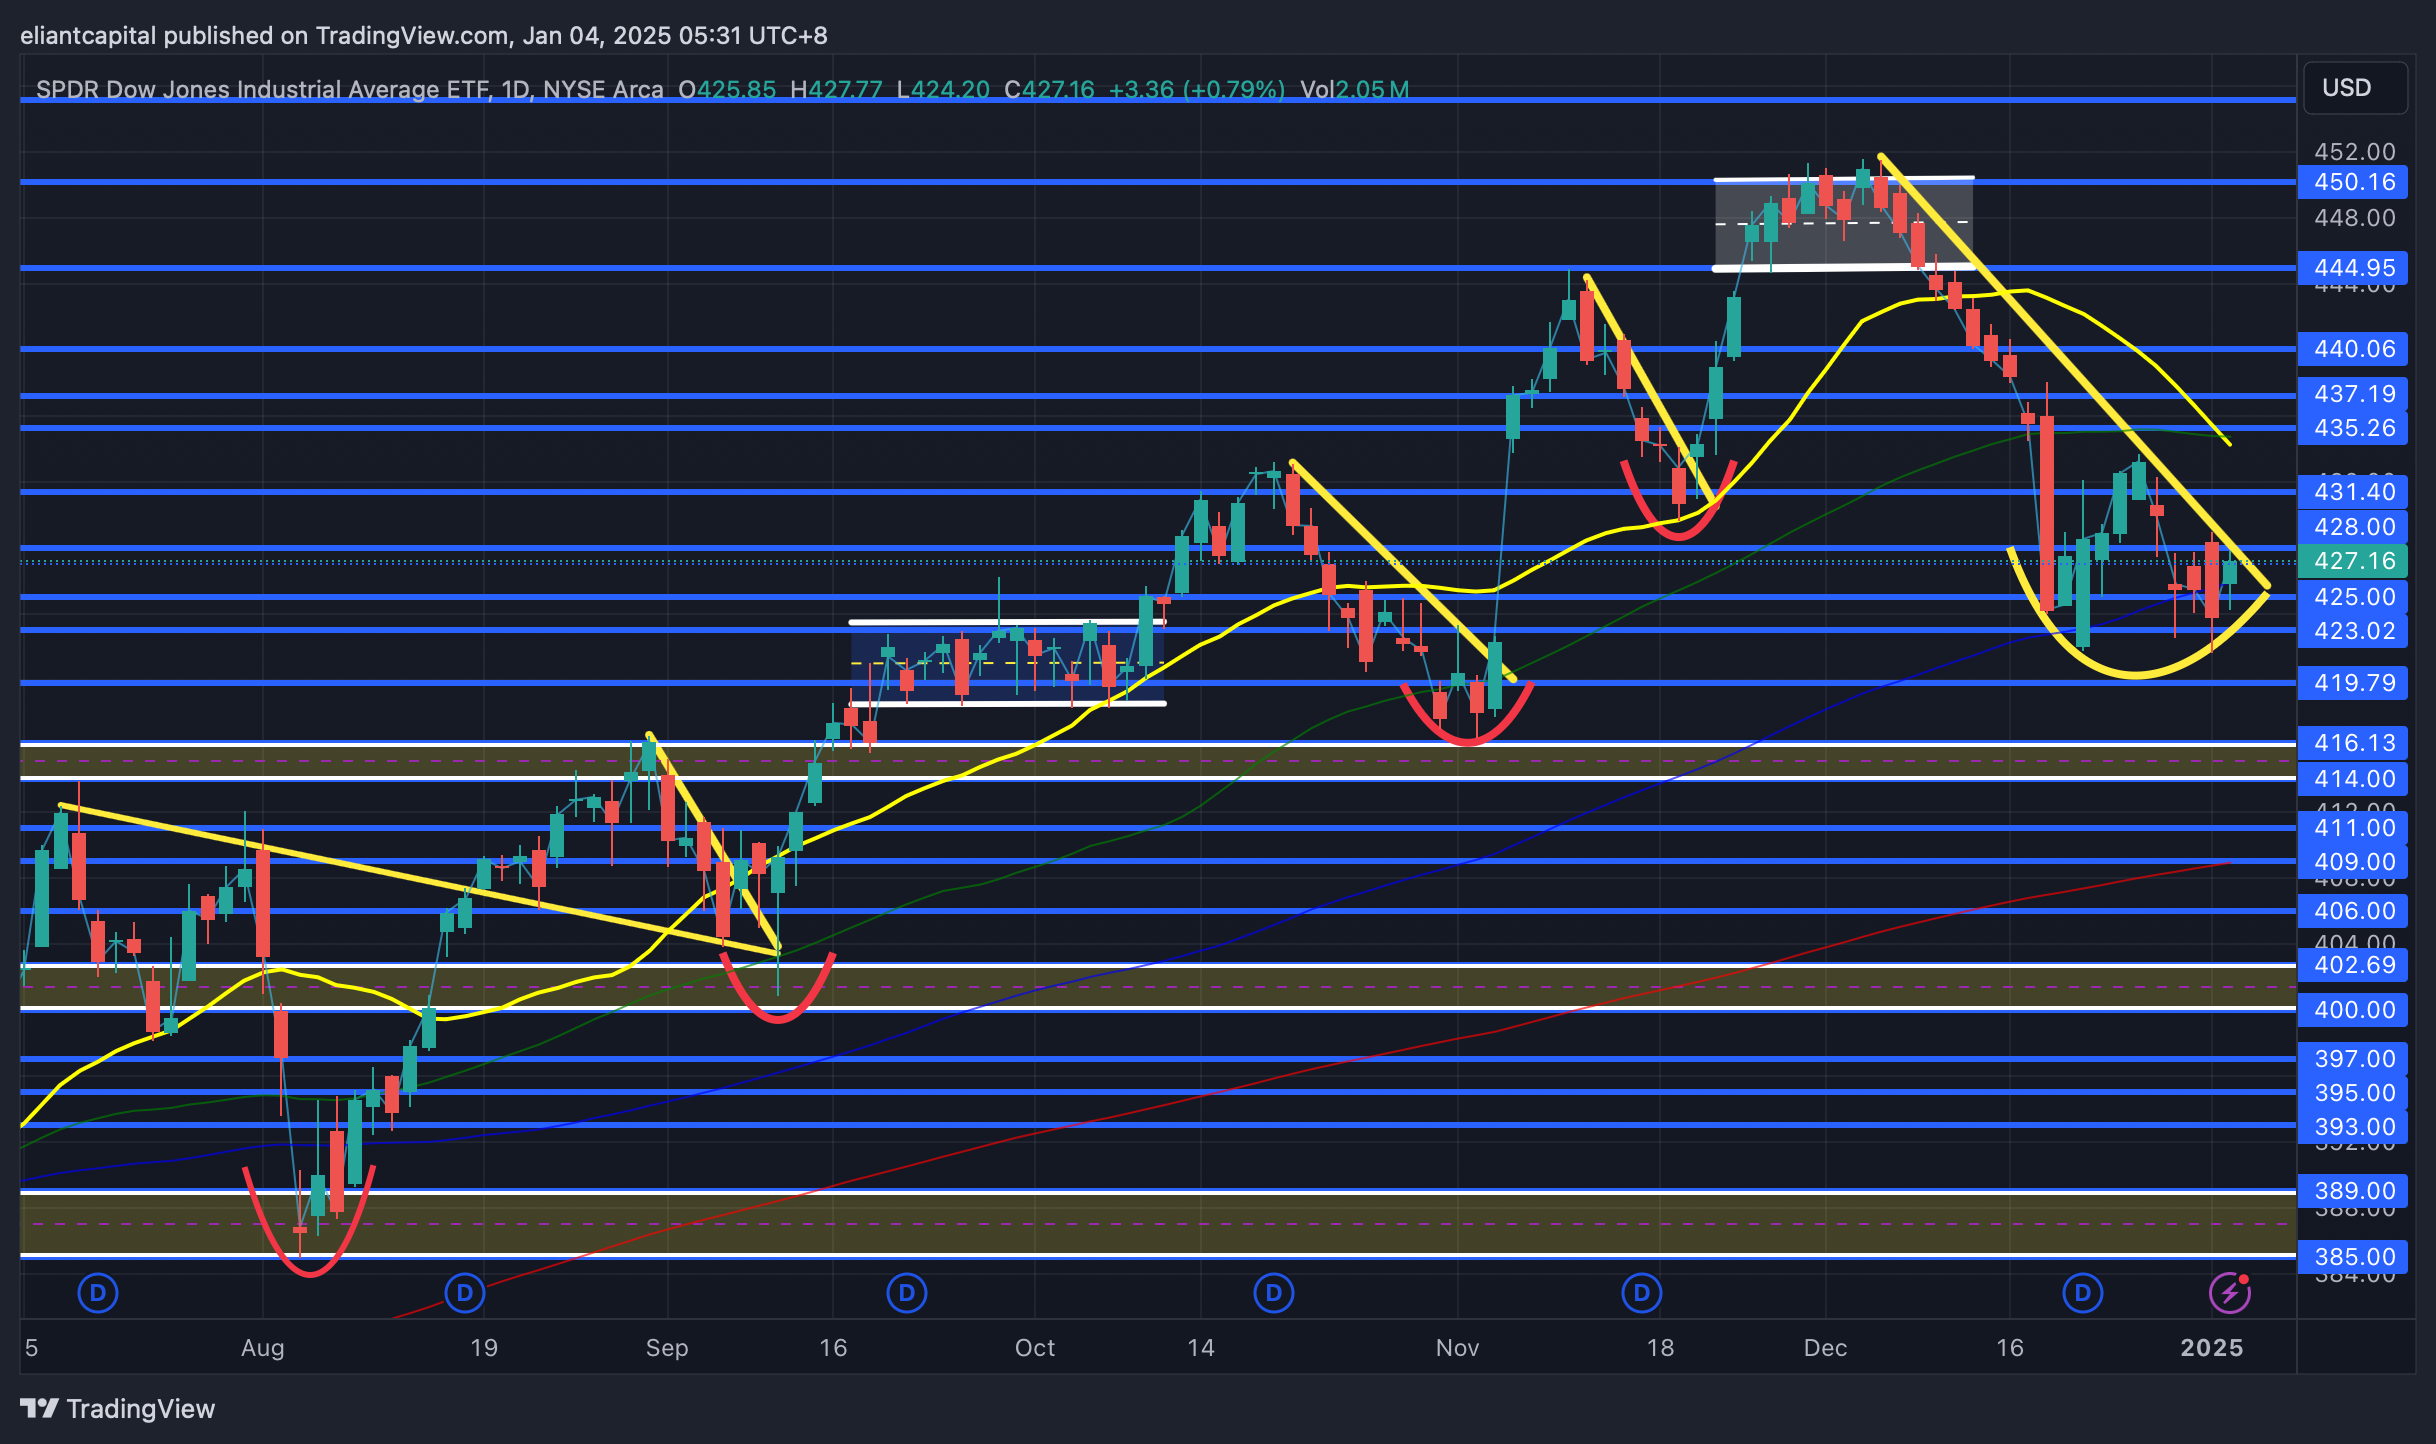
- DIA
The Dow ended up having a modest week this past week, closing up just over 50bps, & action I’d argue was more constructive as the lows near FOMC continue to hold along with the 100d remaining supportive as well.
In regard to technicals, not much has changed on DIA, & it continues to look like DIA has formed a rounded bottom / base & is now on the verge of breaking out of this downtrend that initially kicked off in December of ‘24. If we were to see these recent local lows falter along with the 100d, I think we could see DIA retrace lower towards 416 / 414ish (November local lows) before finding a more firm support.
For firm upside, I think we need to see DIA break out of this downtrend & go on to reclaim the 435-437ish region to solidify this potential rounded bottom / base, which then would likely precede DIA heading back up towards the previous range near 444 / 450ish before deciding where to go from there… new ATHs or more consolidation at those levels… It does seem like this market is reaching a rotationary point as ‘25 has kicked off, but we’ll have a better gauge following all of the economic data this upcoming week as well as volume picking back up as well since the holidays are over.
/DXY
Inauguration is coming up later on in January (20th), and as we’ve discussed these past few weeks & even when Trump was originally elected, the dollar initially rallied up into January before making a big peak & establishing a 1+ YR long downtrend in which the dollar declined 14%+ that following year in ‘17… eerily similar setup heading into this January given the rampant and continued rally in the dollar.
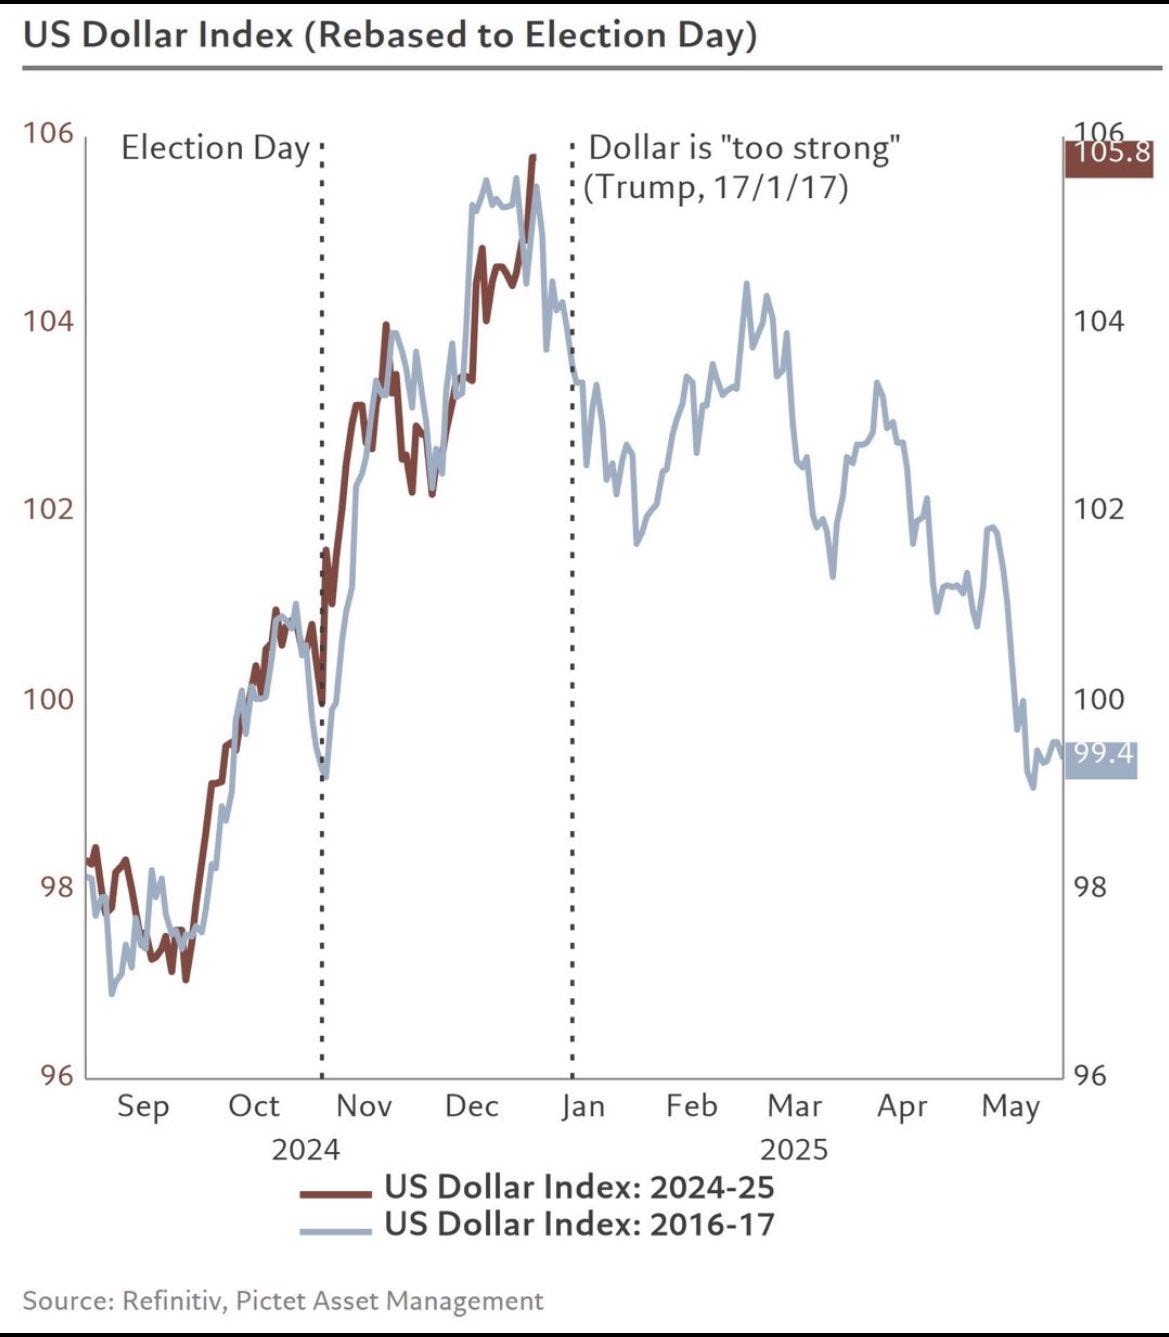
The dollar has been in a parabolic rise ever since bottoming in late September into October & its in part been driven by U.S. economic strength as the growth rebound has materialized whereas other parts of world are struggling & their currencies are suffering as a result thus putting further upside pressure on the dollar. Again, with the chart above, Trump hasn’t favored a strong dollar, so it’ll be interesting if the same setup plays out & the dollar ends up making a bigger-term peak here in January as that sets quite the stage in regard to macro… would generally be bullish risk assuming the dollar isn’t dropping due to fears of economic slowdown / deflation, but it should be bullish EMs / Commodities etc…
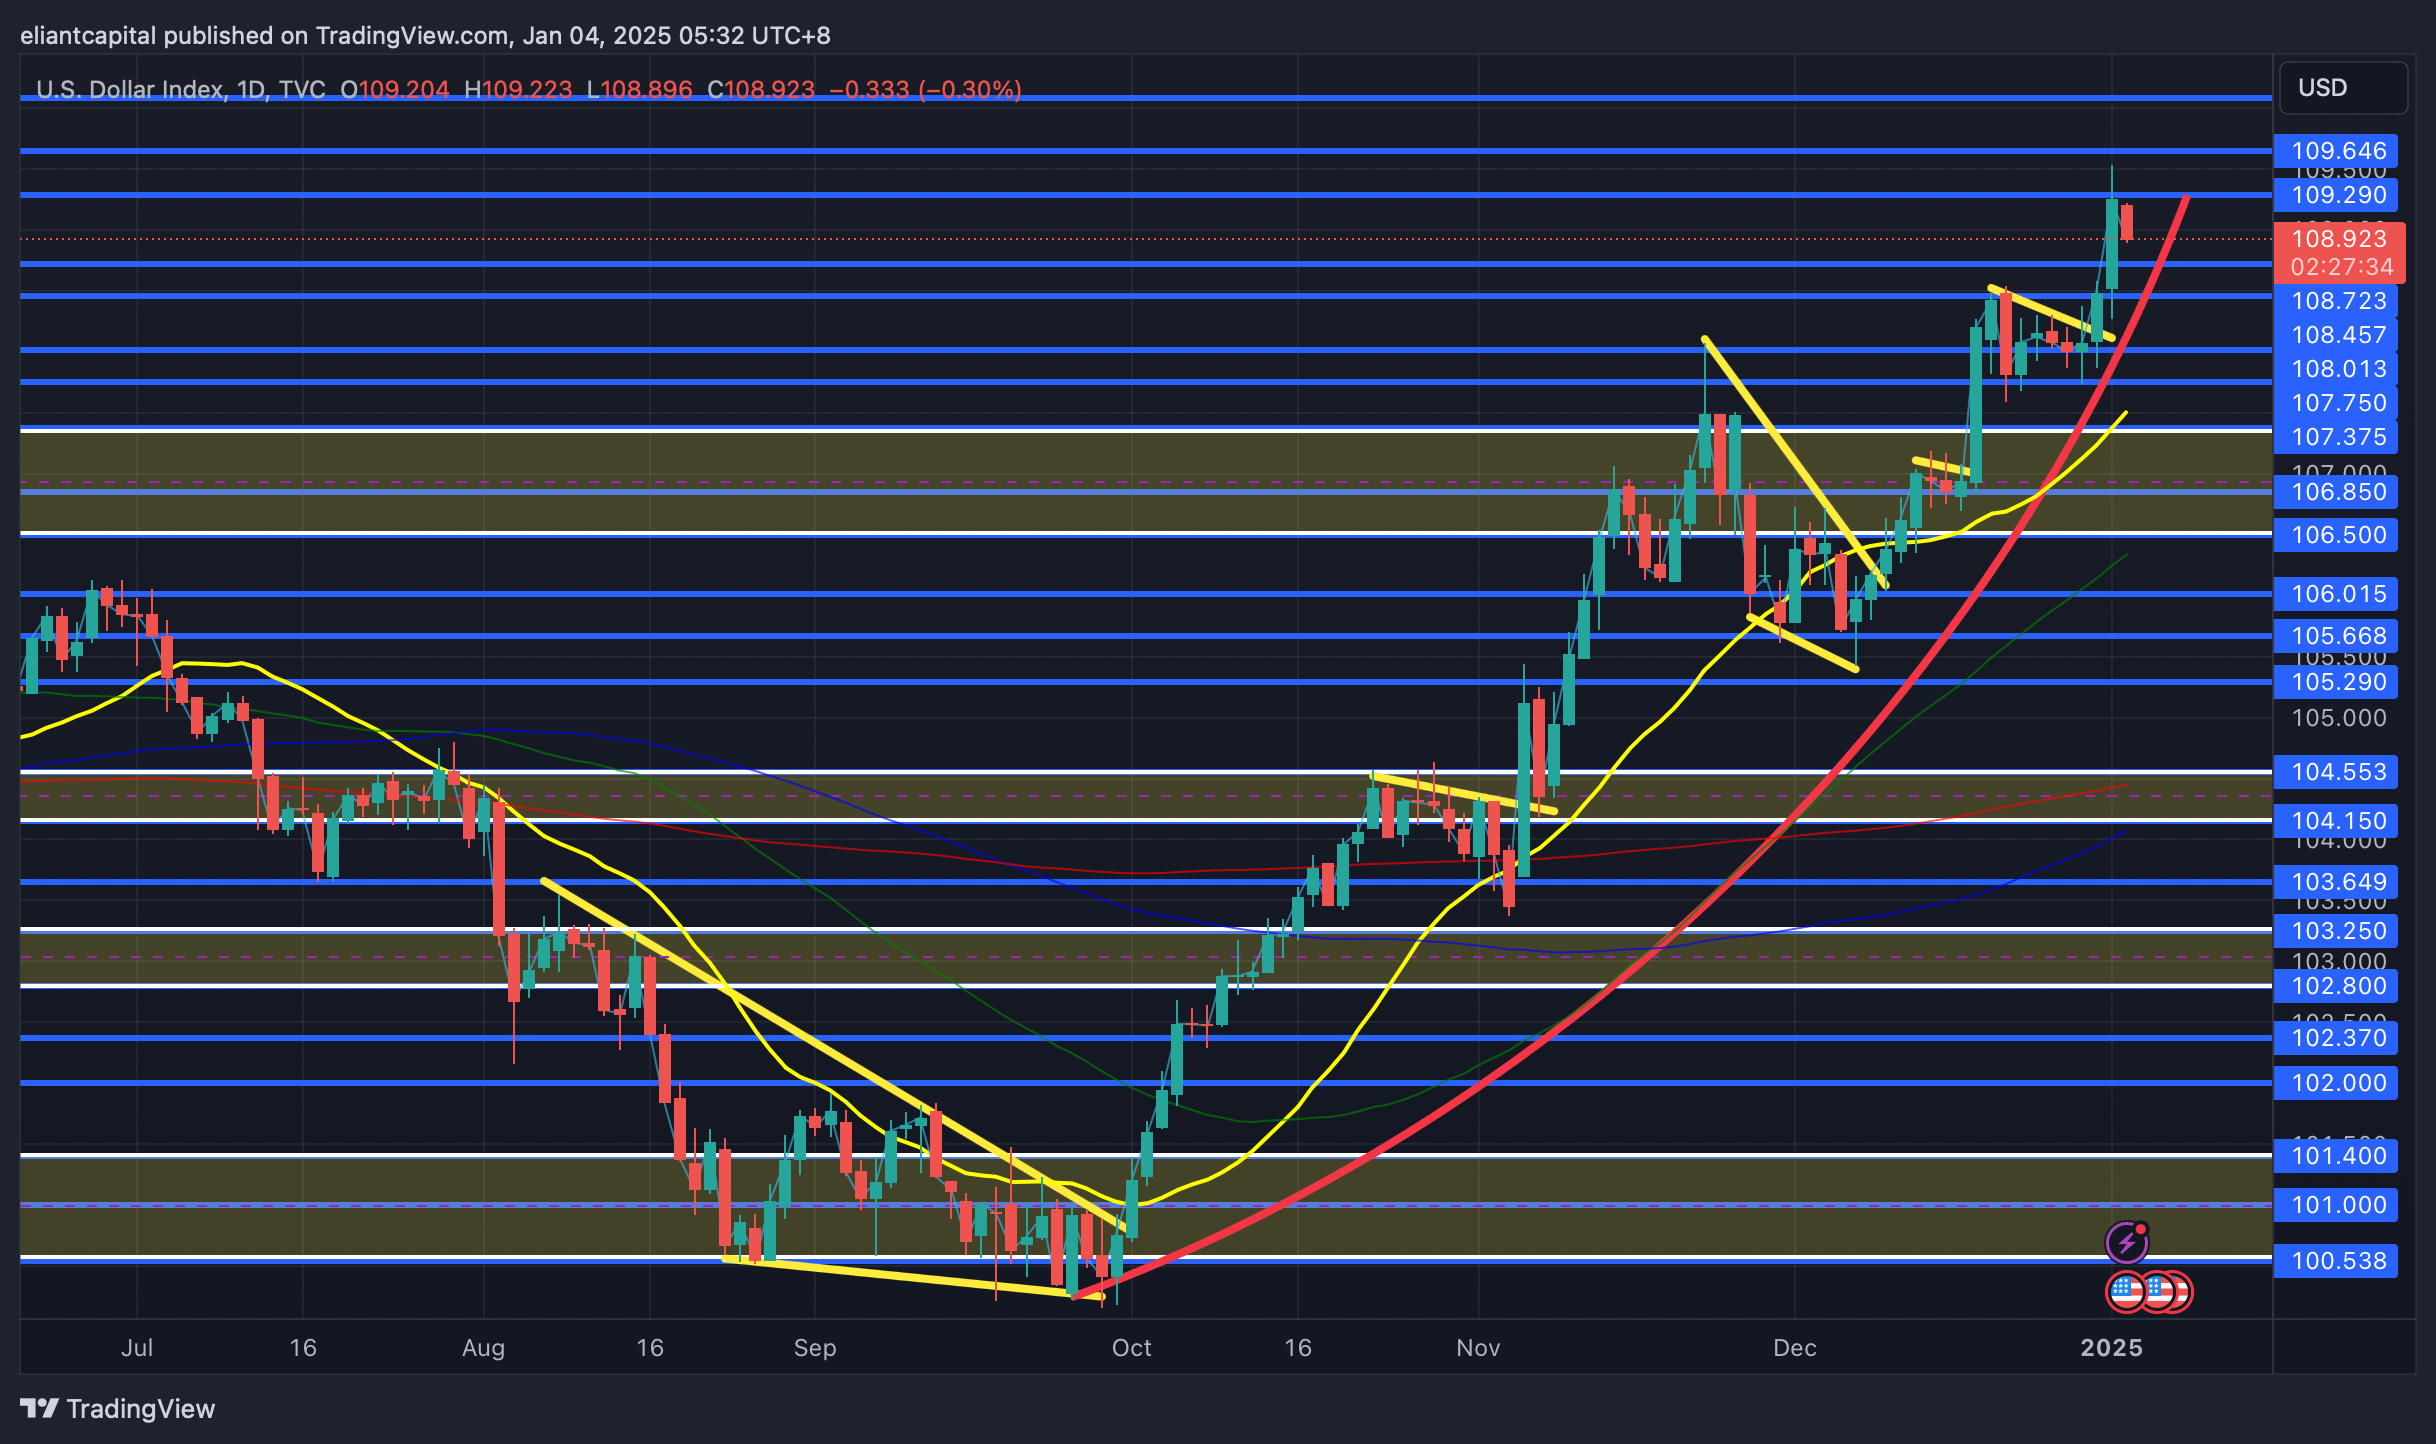
In regard to economic data this coming week, again, we have quite a bit of jobs data along with a few bond auctions, but I think the most important data upcoming the following week will be inflation data (not this upcoming week but the next)… this past PCE report came in better than expected, but if we start to see disinflation generally start to resume, that should ease pressure off the dollar along with bonds as well which have been two headwinds for the general markets as of late. However, if jobs data does continue to hum along this week, that should be generally supportive of the dollar, but one thing I will be eyeing for this week is if economic data comes in as expected, yet the dollar starts to resolve lower… would be a bit of a news failure & also line up with a blowoff in the dollar like we saw in ‘17 in January as well.
The dollar still remains in a strong parabolic rise & for any sort of firm downside, we need to see the 107.37 / 106.5ish range taken out, otherwise, we likely will continue to see the dollar remain supported… would also help to see data across the pond start to inflect higher (EUR / GBP more specifically) as that also could aid in a weaker dollar as well.
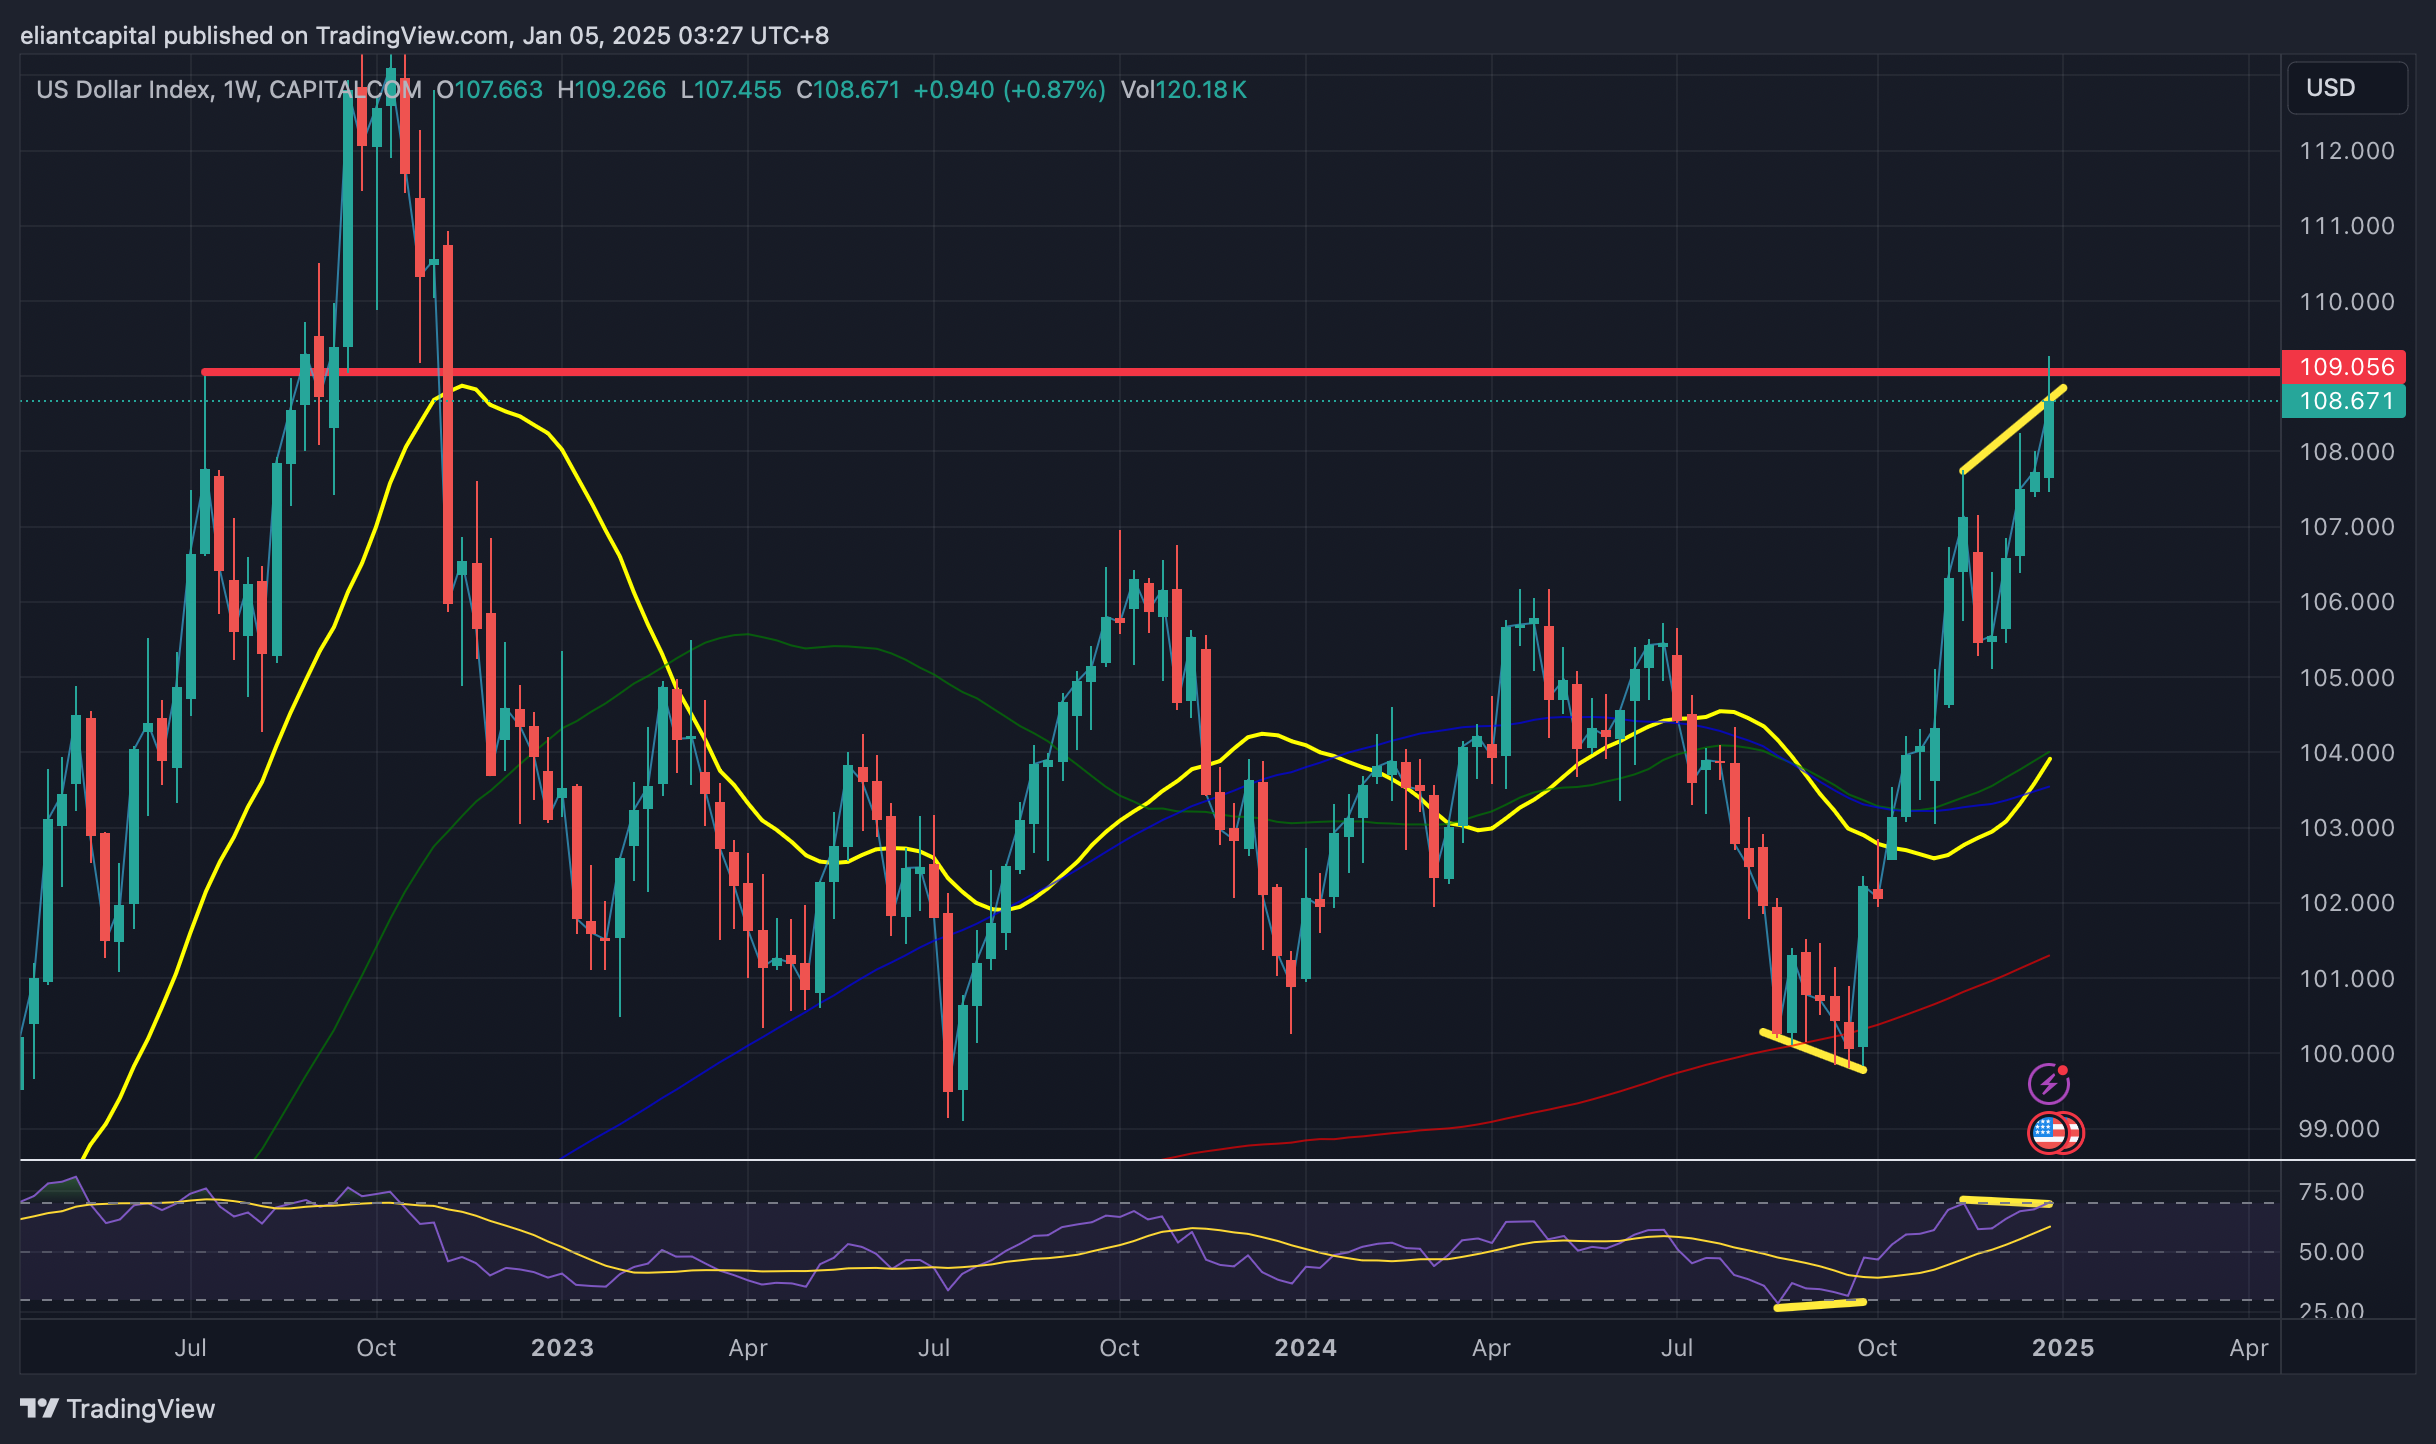
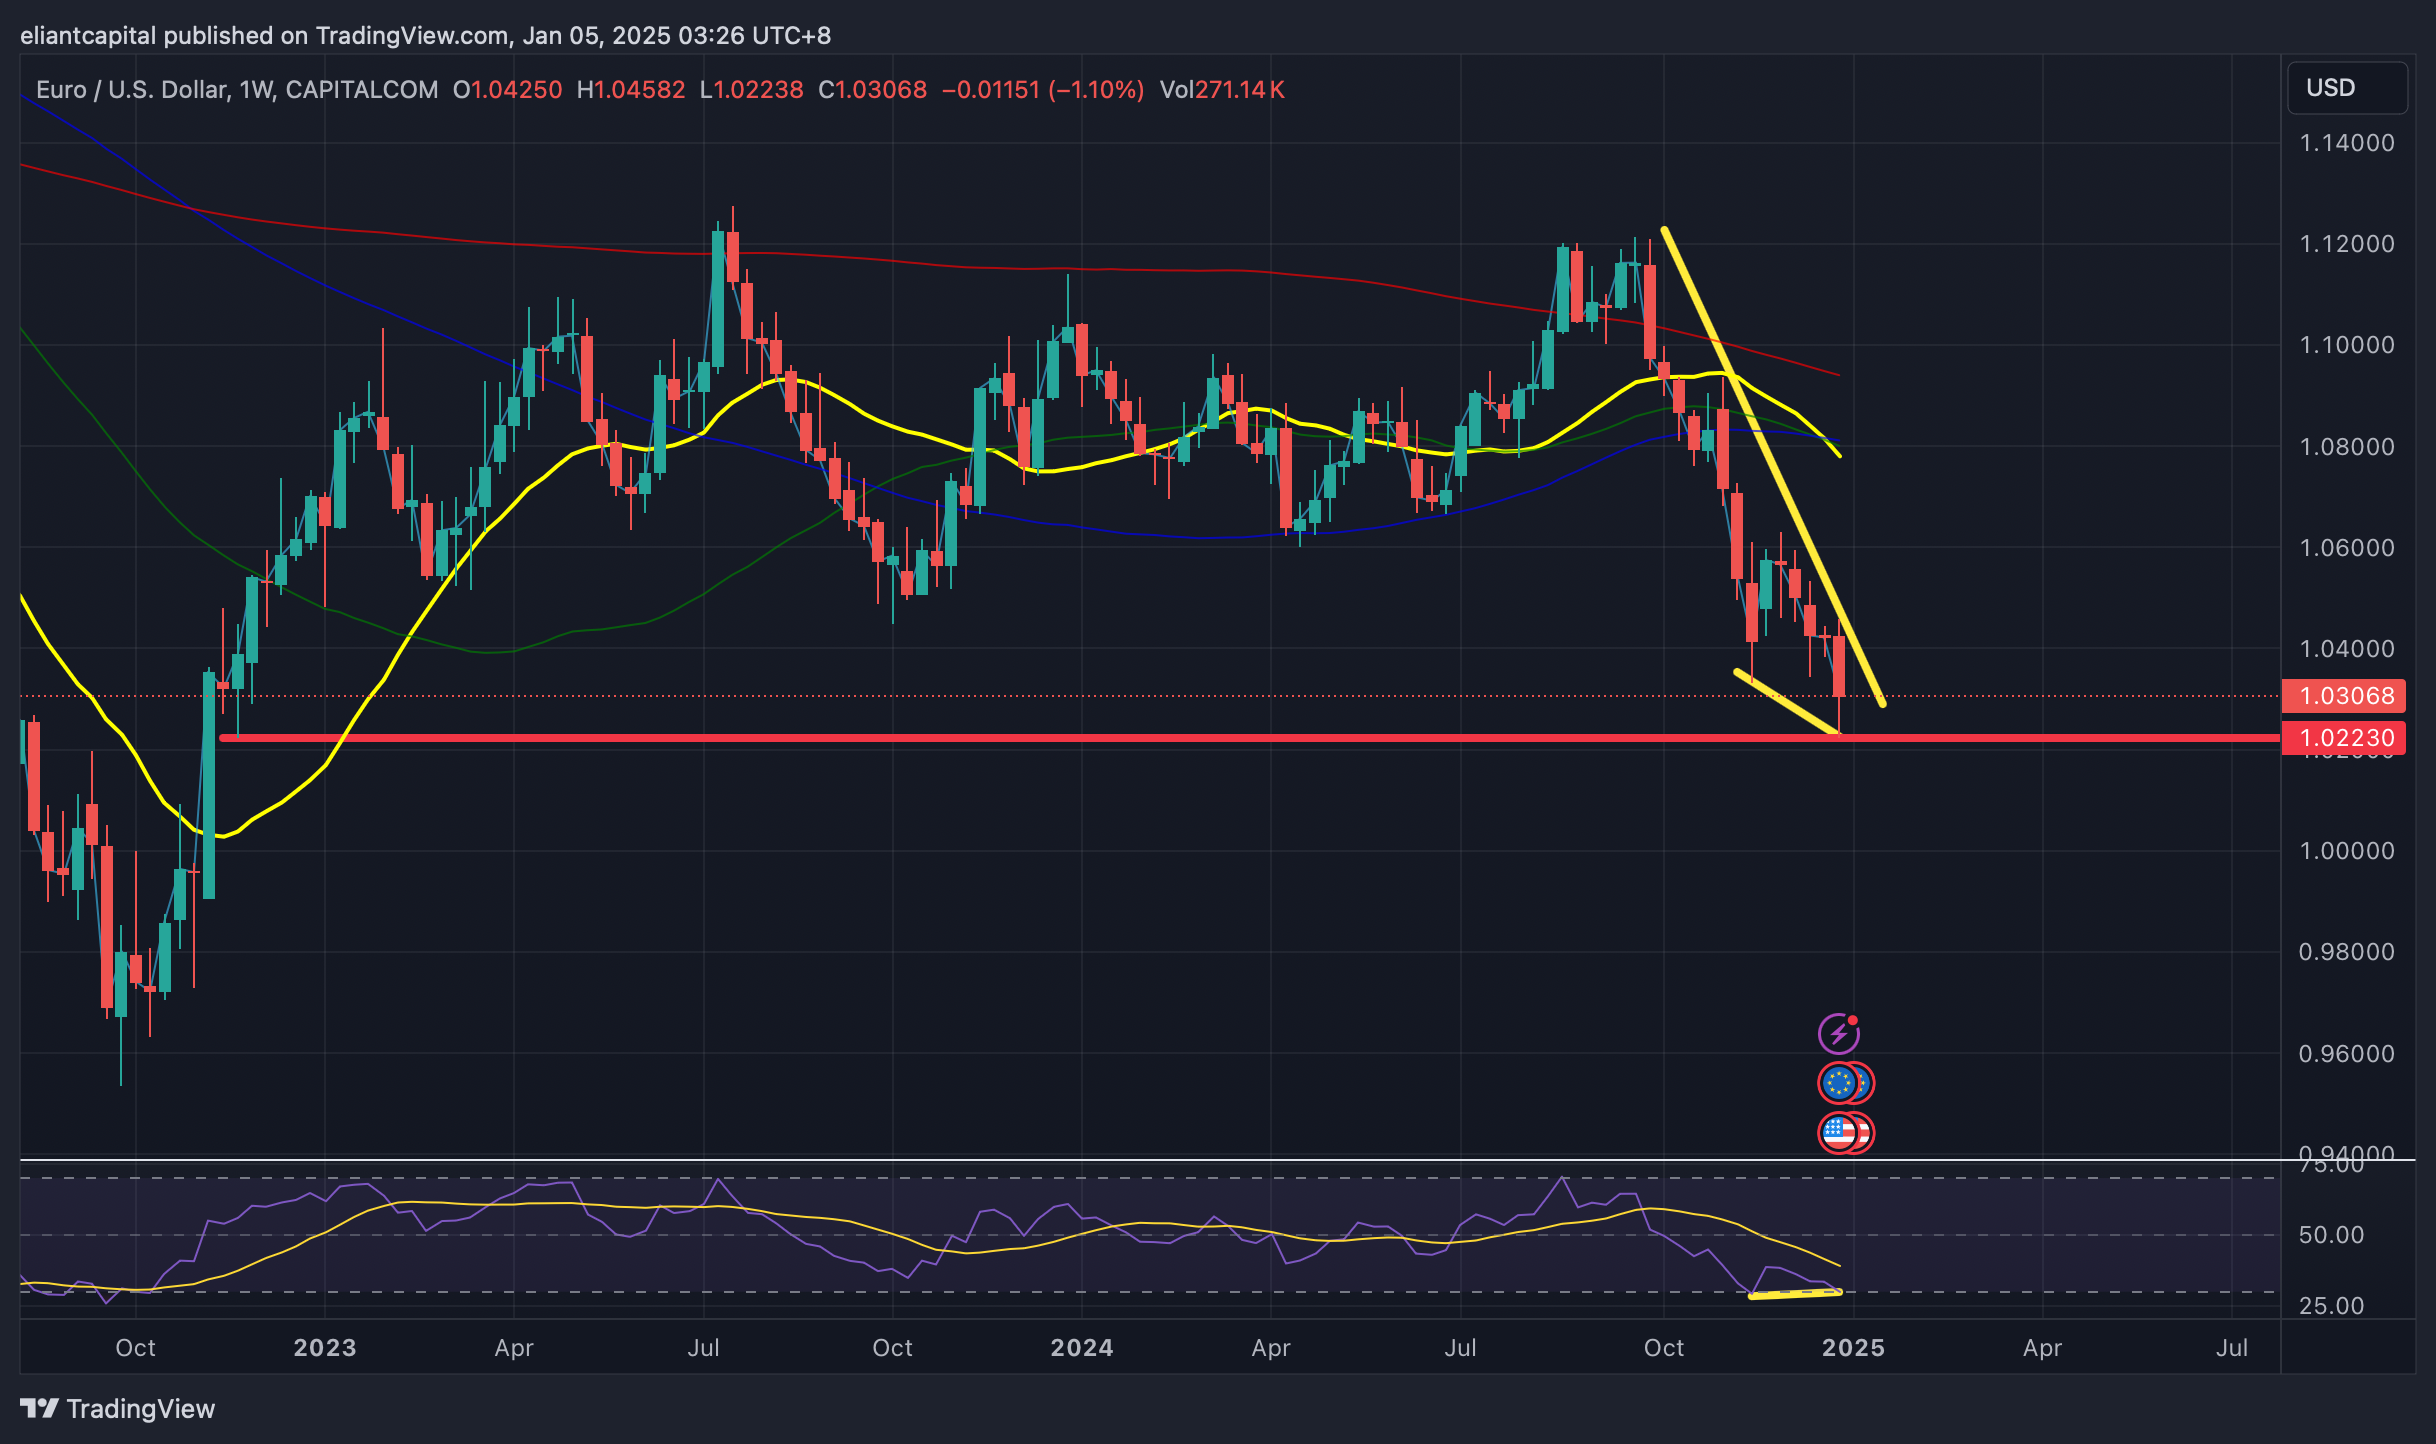
Did want to note the divergence on both DXY & EUR:
DXY: Bear divergence on the weekly… same setup but in inverse to the bull divergence that initially kicked off this rally in late September into October.
EUR: Bull divergence on the weekly with sentiment very stretched (can’t even count on two hands with how many calls for parity I have seen)… think R/R on the long-side against last weeks lows is pretty great & may look to put that trade on this week. For those not using futures, long FXE or short EUO would work as well.
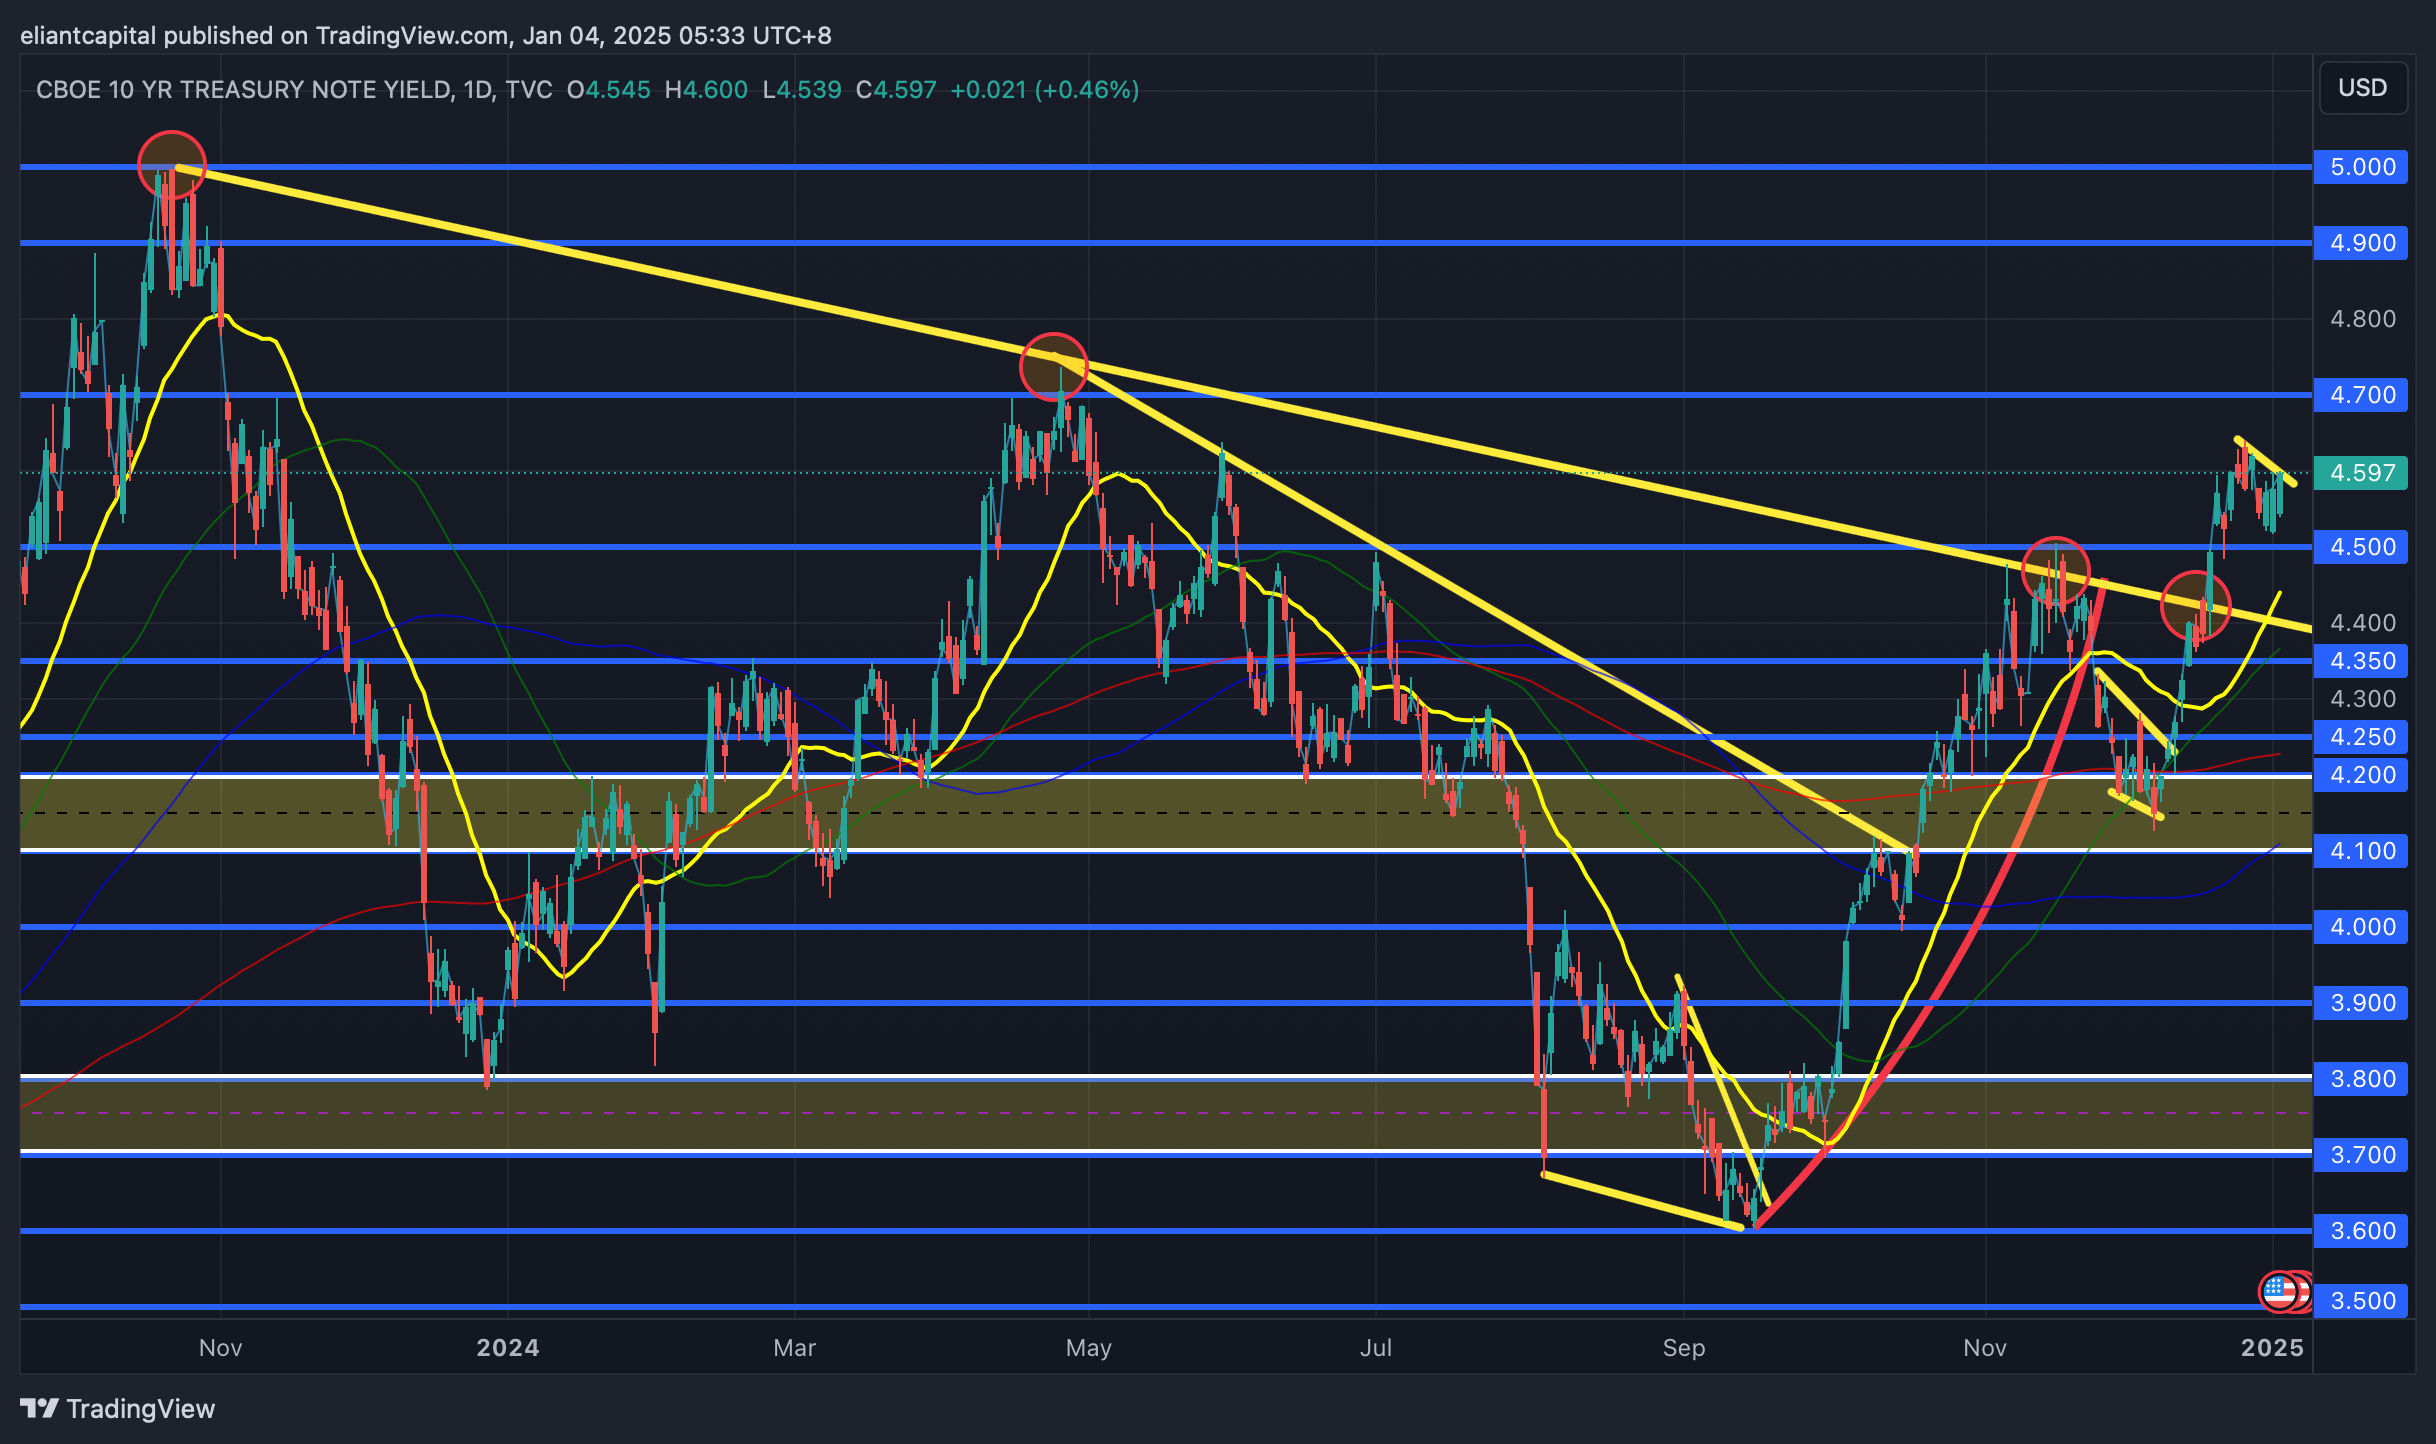
/TNX
Bonds ended up closing slightly lower this past week, around 50bps & just as the Dollar & Euro are flashing respective divergences on the weekly, the 10Y is as well… a negative divergence as shown below. The divergence gets invalidated on a firm new high / breakout of RSI, but otherwise, it remains intact & negative divergences tend to resolve lower whereas positive divergences tend to resolve higher just as the 10Y did when it bottomed in September.
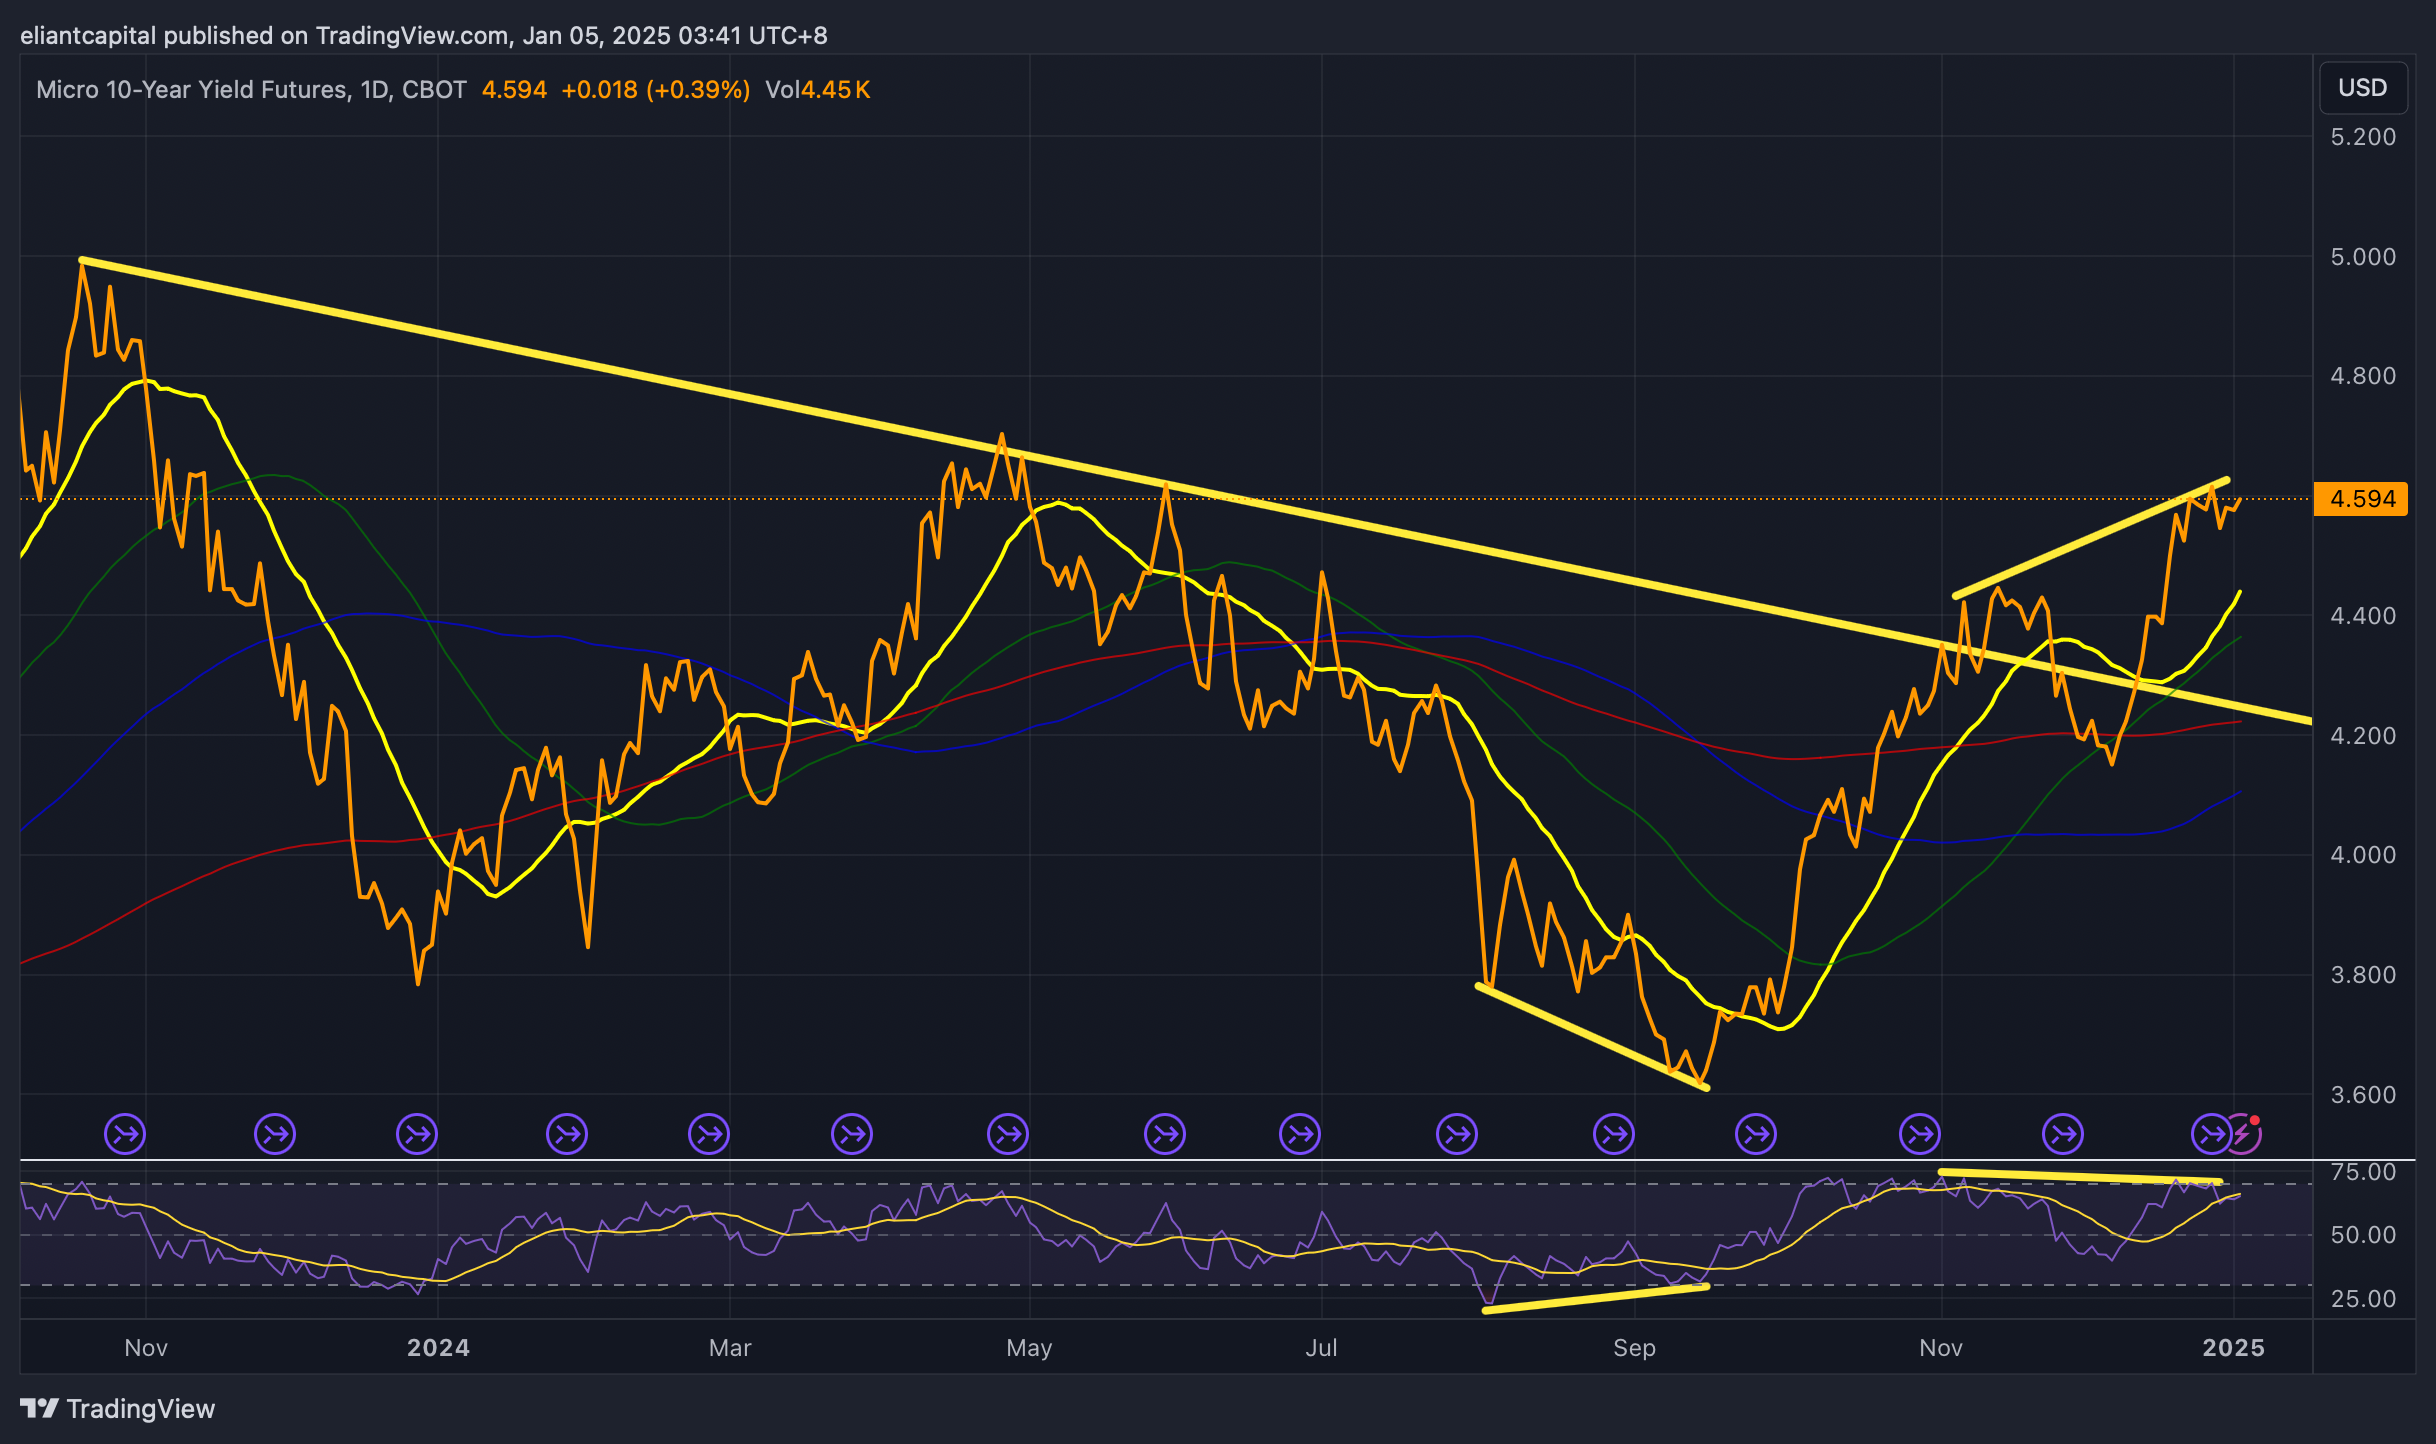
The boat remains quite lopsided on bonds as we get ready to head into this upcoming week with the plethora of jobs data & similar to the dollar, I will be watching for news failures this week if economic data comes in better than expected yet bonds still finish higher… a classic news failure signal. Otherwise, in regard to bonds heading into this upcoming week, I think we need to see some scorching jobs data for the 10Y to continue to trek higher… current estimates for NFP #’s this coming Friday are around 150k jobs added with the UER expected to come in around 4.2 (unchanged)… if that’s the print on Friday, I’d expect bonds to bid… if we were to see 200k+ jobs along with the UER ticking lower, I think we could continue to see some pressure on bonds, but otherwise, I think you need a pretty strong report for the continued bond decline to have more legs given how stretched on the downside it already is.
The 10Y is essentially sitting just under the early ‘24 spring highs… don’t expect this to be an easy level for the 10Y to overcome (4.7ish) & if it does keep a lid on the 10Y around these levels, I think we could be due for some quick reversion this January towards 4.5 / 4.4ish range, but again, to get a more sustainable bid in bonds, we likely need to see the Fed’s worries of inflation subside which would be due to softer inflation data & or we need to see weakening in the labor market / uptick in the UER to get the narrative shift going back towards the other way. With how negative sentiment is into ‘25 & bonds being negative now for the past few years, it does seem like ‘25 could finally be a positive year for bonds.
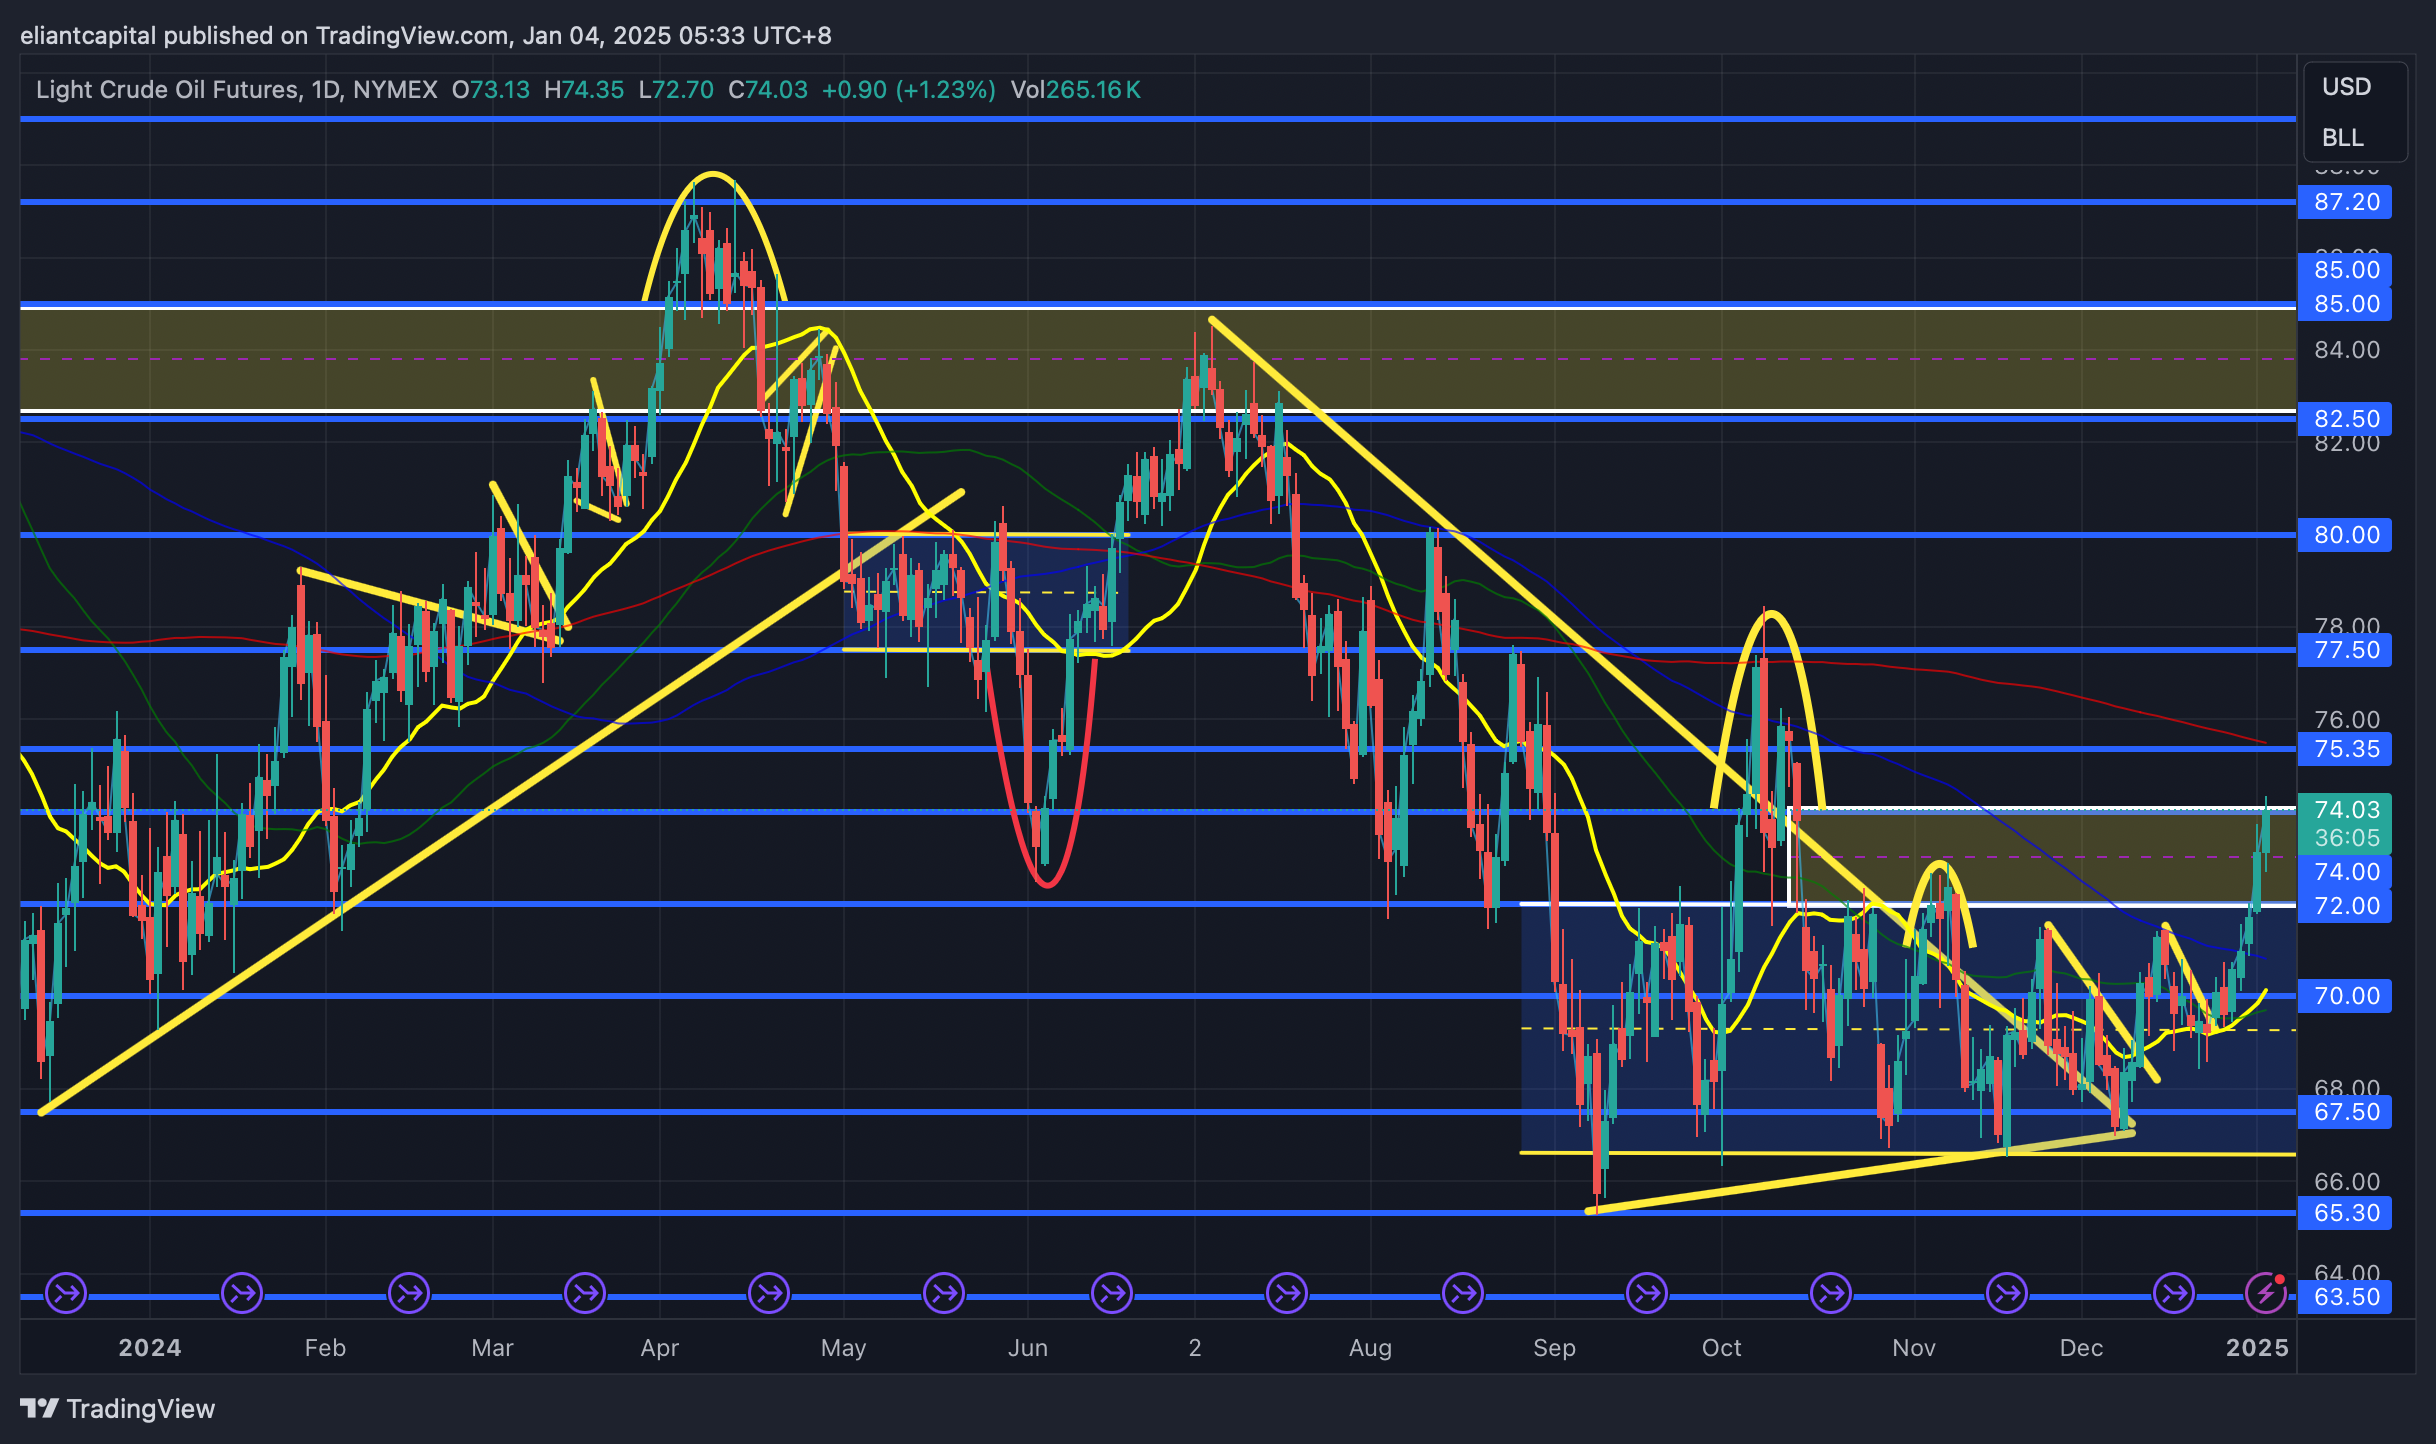
/CL
Crude has undergone consolidation for 4+ months now & our expectations / lean more so gave edge in looking for the consolidation to break higher / base breakout & we finally saw the breakout this past week as crude finally closed the open gap above near 74ish after leaving it unfilled for 4+ months.
Not expecting HUGE upside in crude, barring a catalyst, & generally think 77.50 / 75ish (200d) should cap upside… again, barring a geopolitical event, but I am a bit on guard with crude breaking out as that does start to ring the bell of inflation if this breakout / further upside continues, but don’t think its too much of worry as of now.
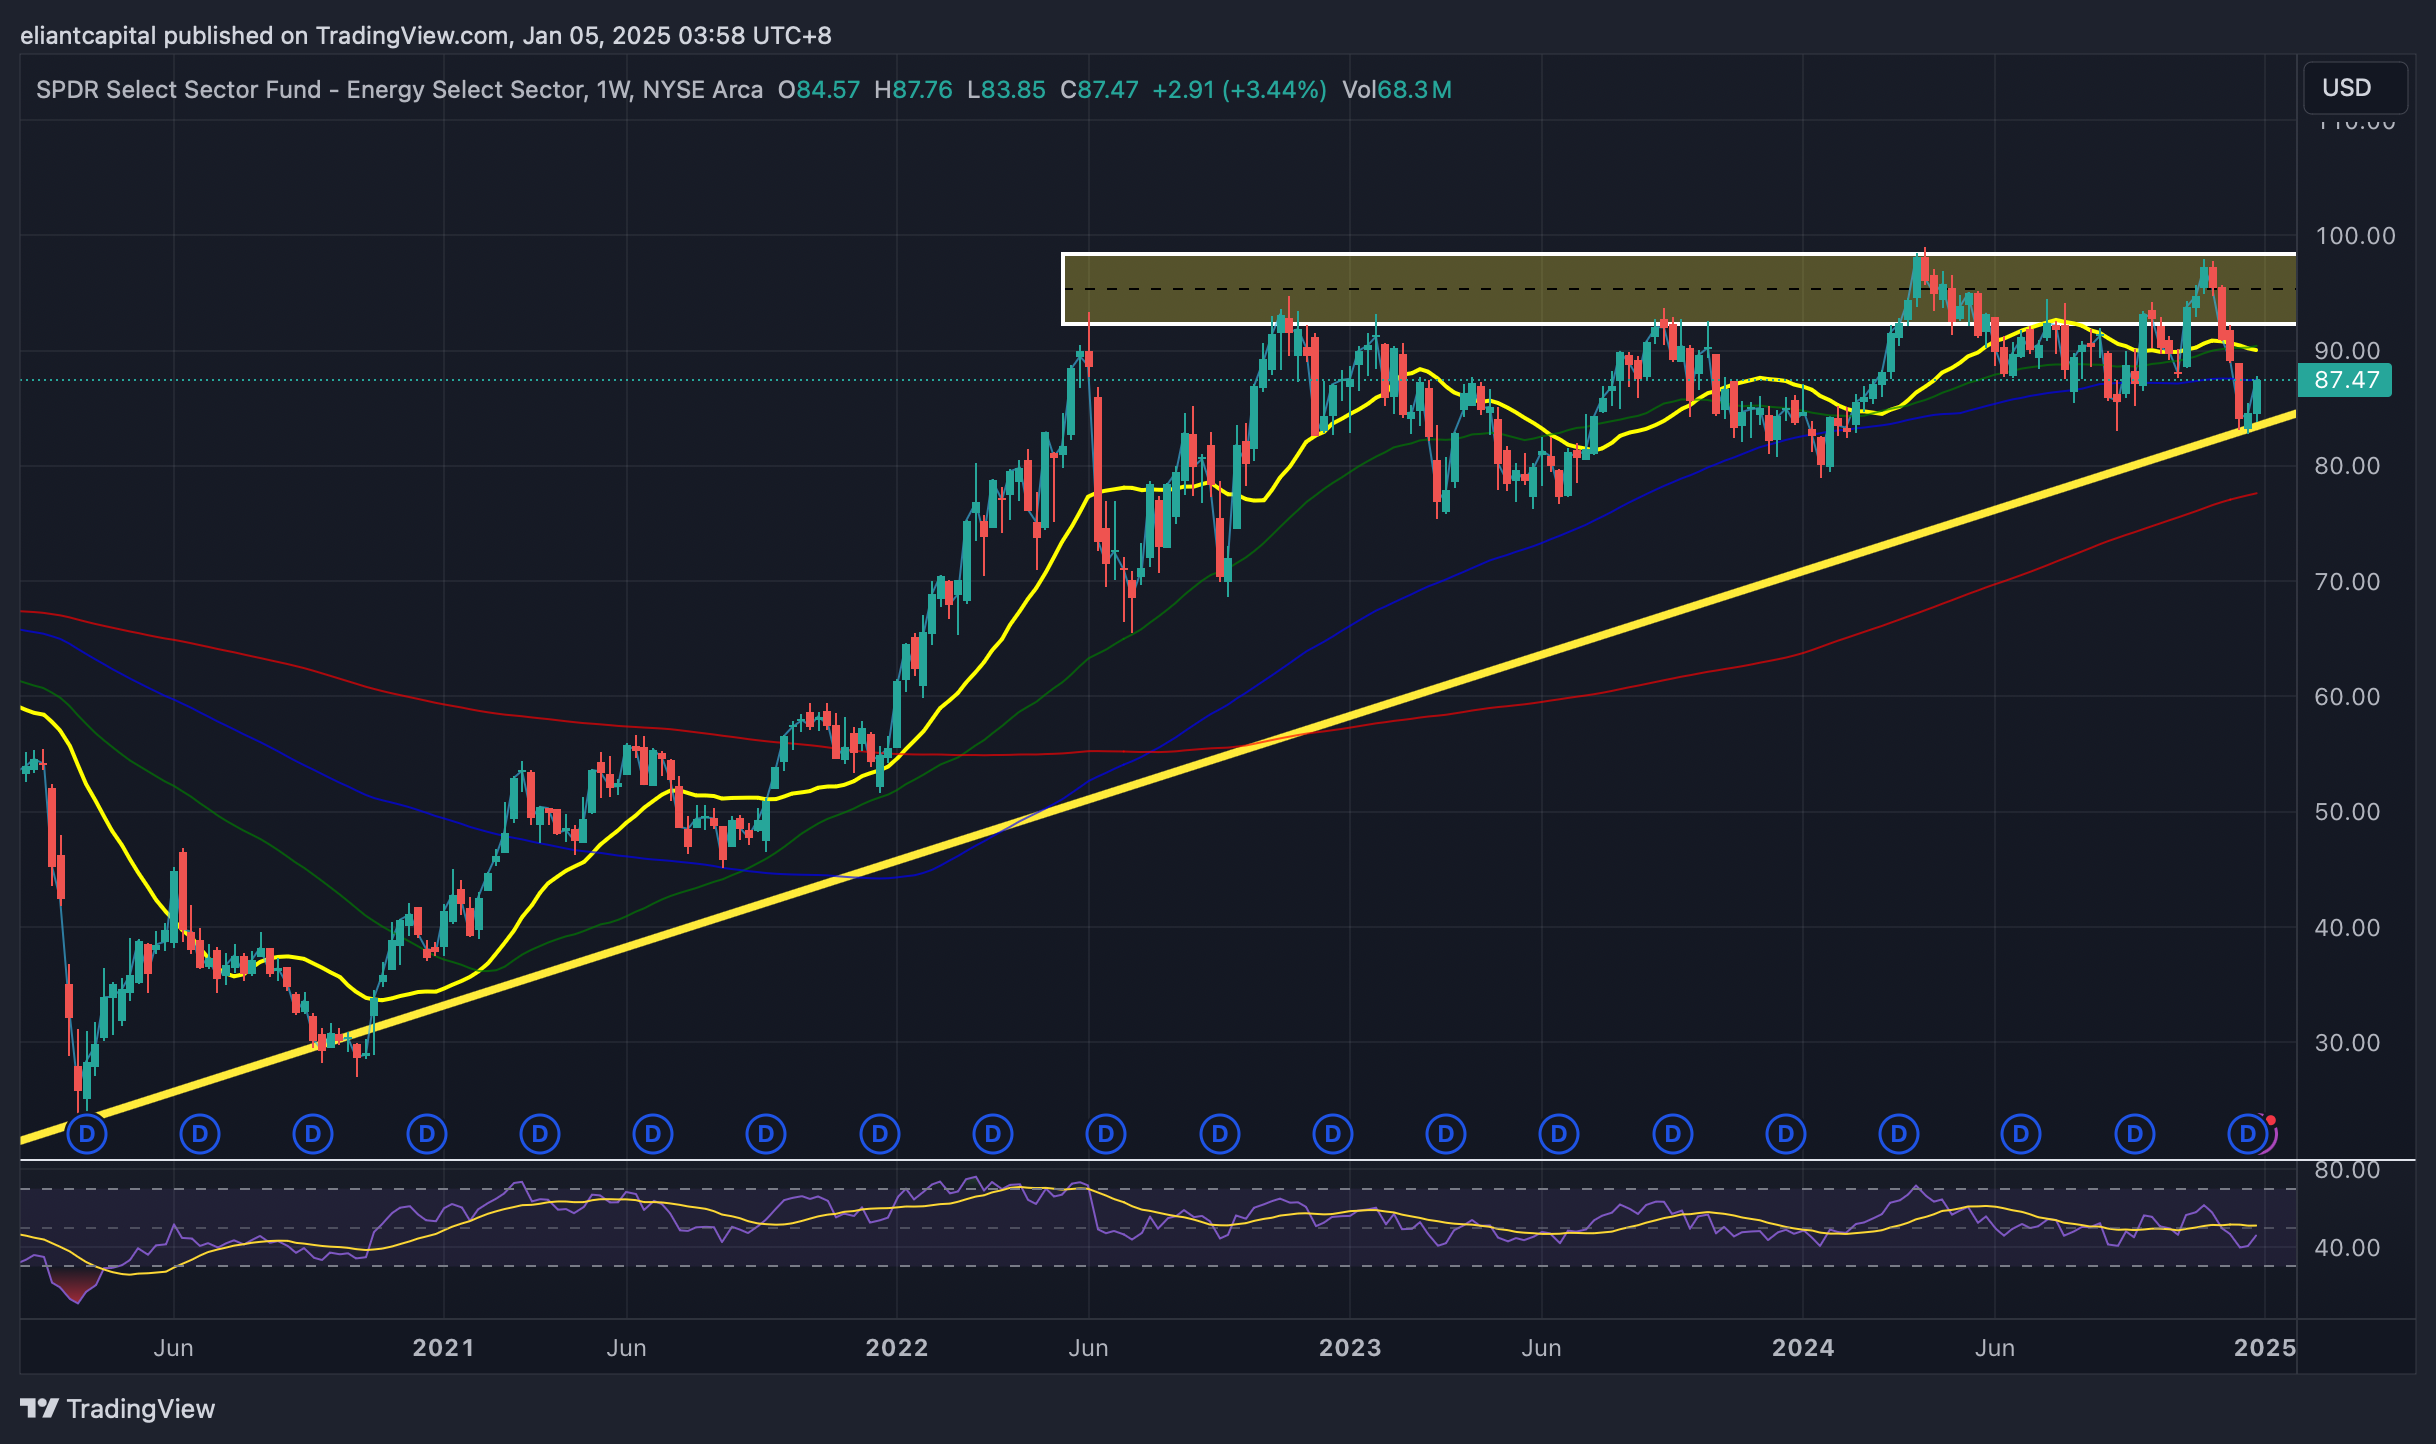
We also noted the other week, that sentiment was quite poor in energy stocks, yet XLE was sitting on a longer-term support TL dating back to the ‘20 lows & sure enough, it once again came in and acted as support… kudos to those that pressed & or sold puts at those lows given how stretched sentiment was (still remains quite stretched… especially considering economic data continues to hum along, although we’ll have an updated gauge this week).
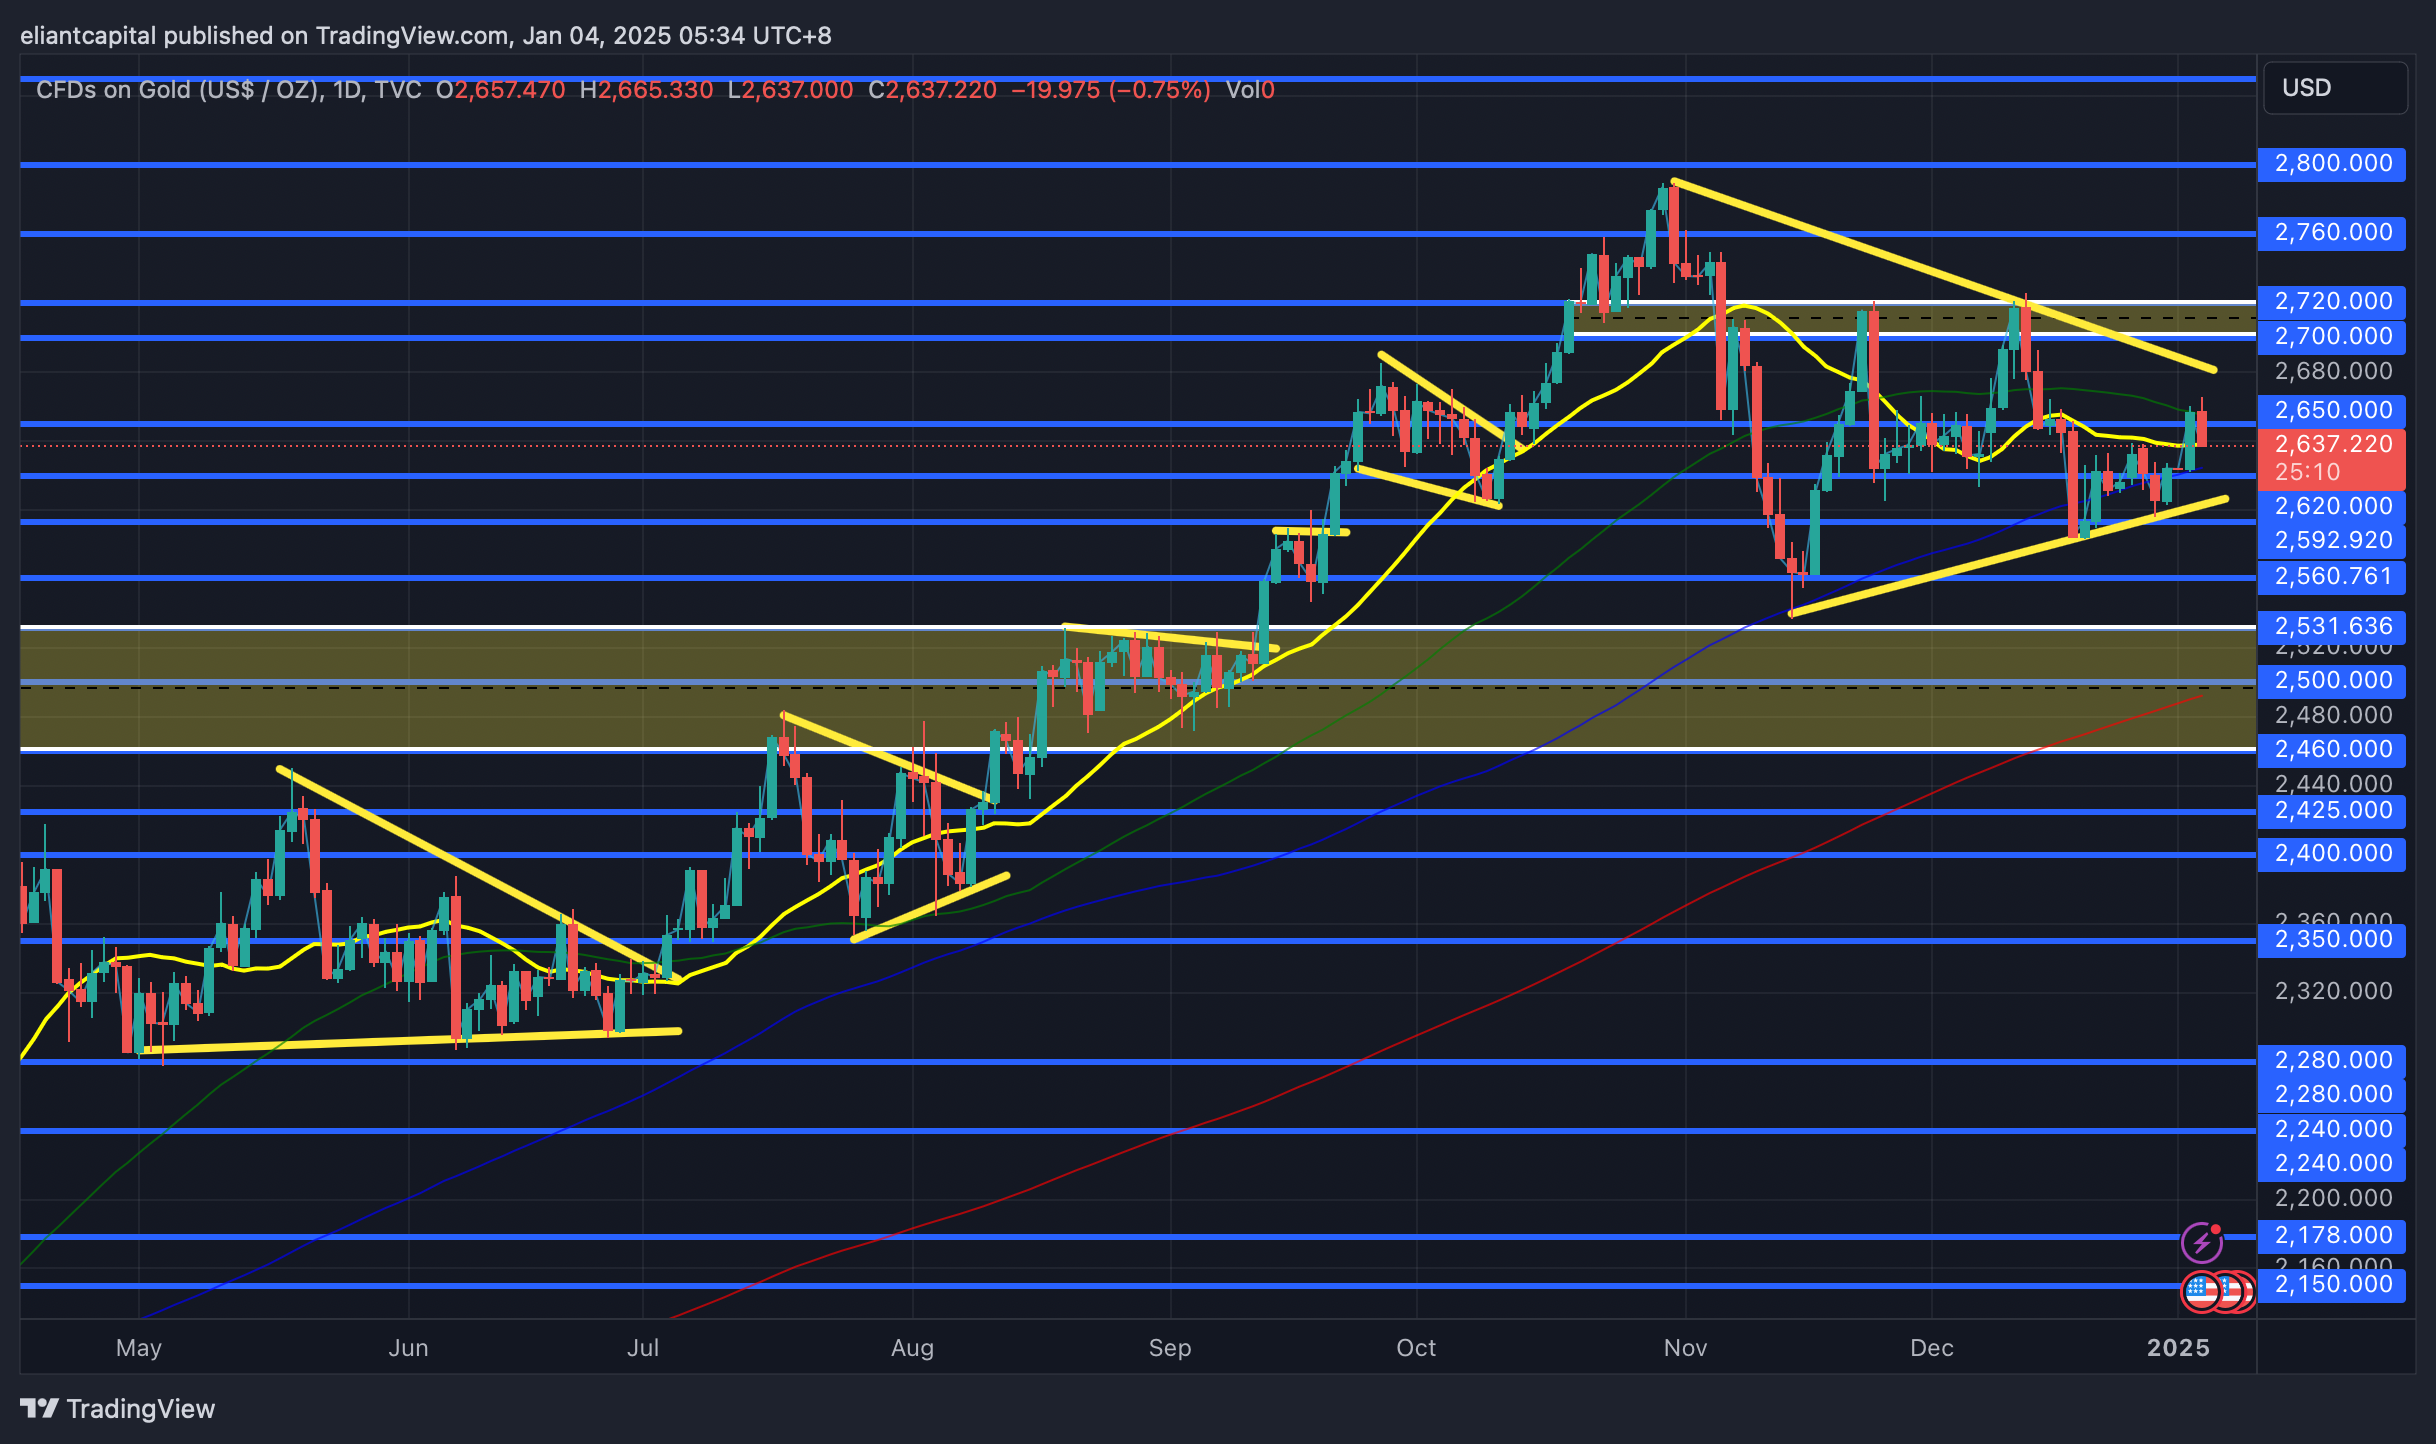
/GC
A pretty contained week for the metals this past week, but they still continue to hold up well in the face of a strong dollar, so if the dollar does start to rollover (assuming its not of cause due to deleveraging as that would be a negative for the metals as well) we should see that come in as a nice added tailwind for the metals.
Gold still continues to build out this wedge pattern (reclaimed the 20d this past week)… but similar to what we saw in the summer before we saw continuation higher (July / August TF), Gold looks to be consolidating before a move higher, but we do still need to see gold firm up above 2720 / 2700ish to start working back up towards the highs / new highs into 2800+ as otherwise, we may be susceptible to more rangebound action, potentially even see gold break lower towards 2530 / 2500ish (200d) before finding a more firm bottom (breakdown would likely come on a more hawkish than expected Fed at this upcoming FOMC in January).
If recent hawkish pricing is indeed not warranted, we likely will see quite the surge higher in gold whereas if jobs / inflation data does continue to come in hotter than expected & the Fed continues to keep up with the hawkish tone, I do think thats the ultimate downside trigger for gold / metals & we could see a bit of an unwind of the ‘24 move, but again, if the hawkish pricing isn’t warranted / dollar & bonds start to revert, we likely will see a snapback in gold right towards the highs & likely onwards to 3k+ as the debt situation in the U.S. is not improving & DOGE has already proven that they likely won’t make much of a dent in reducing spending (I’ll believe it when I see it kind of thing).
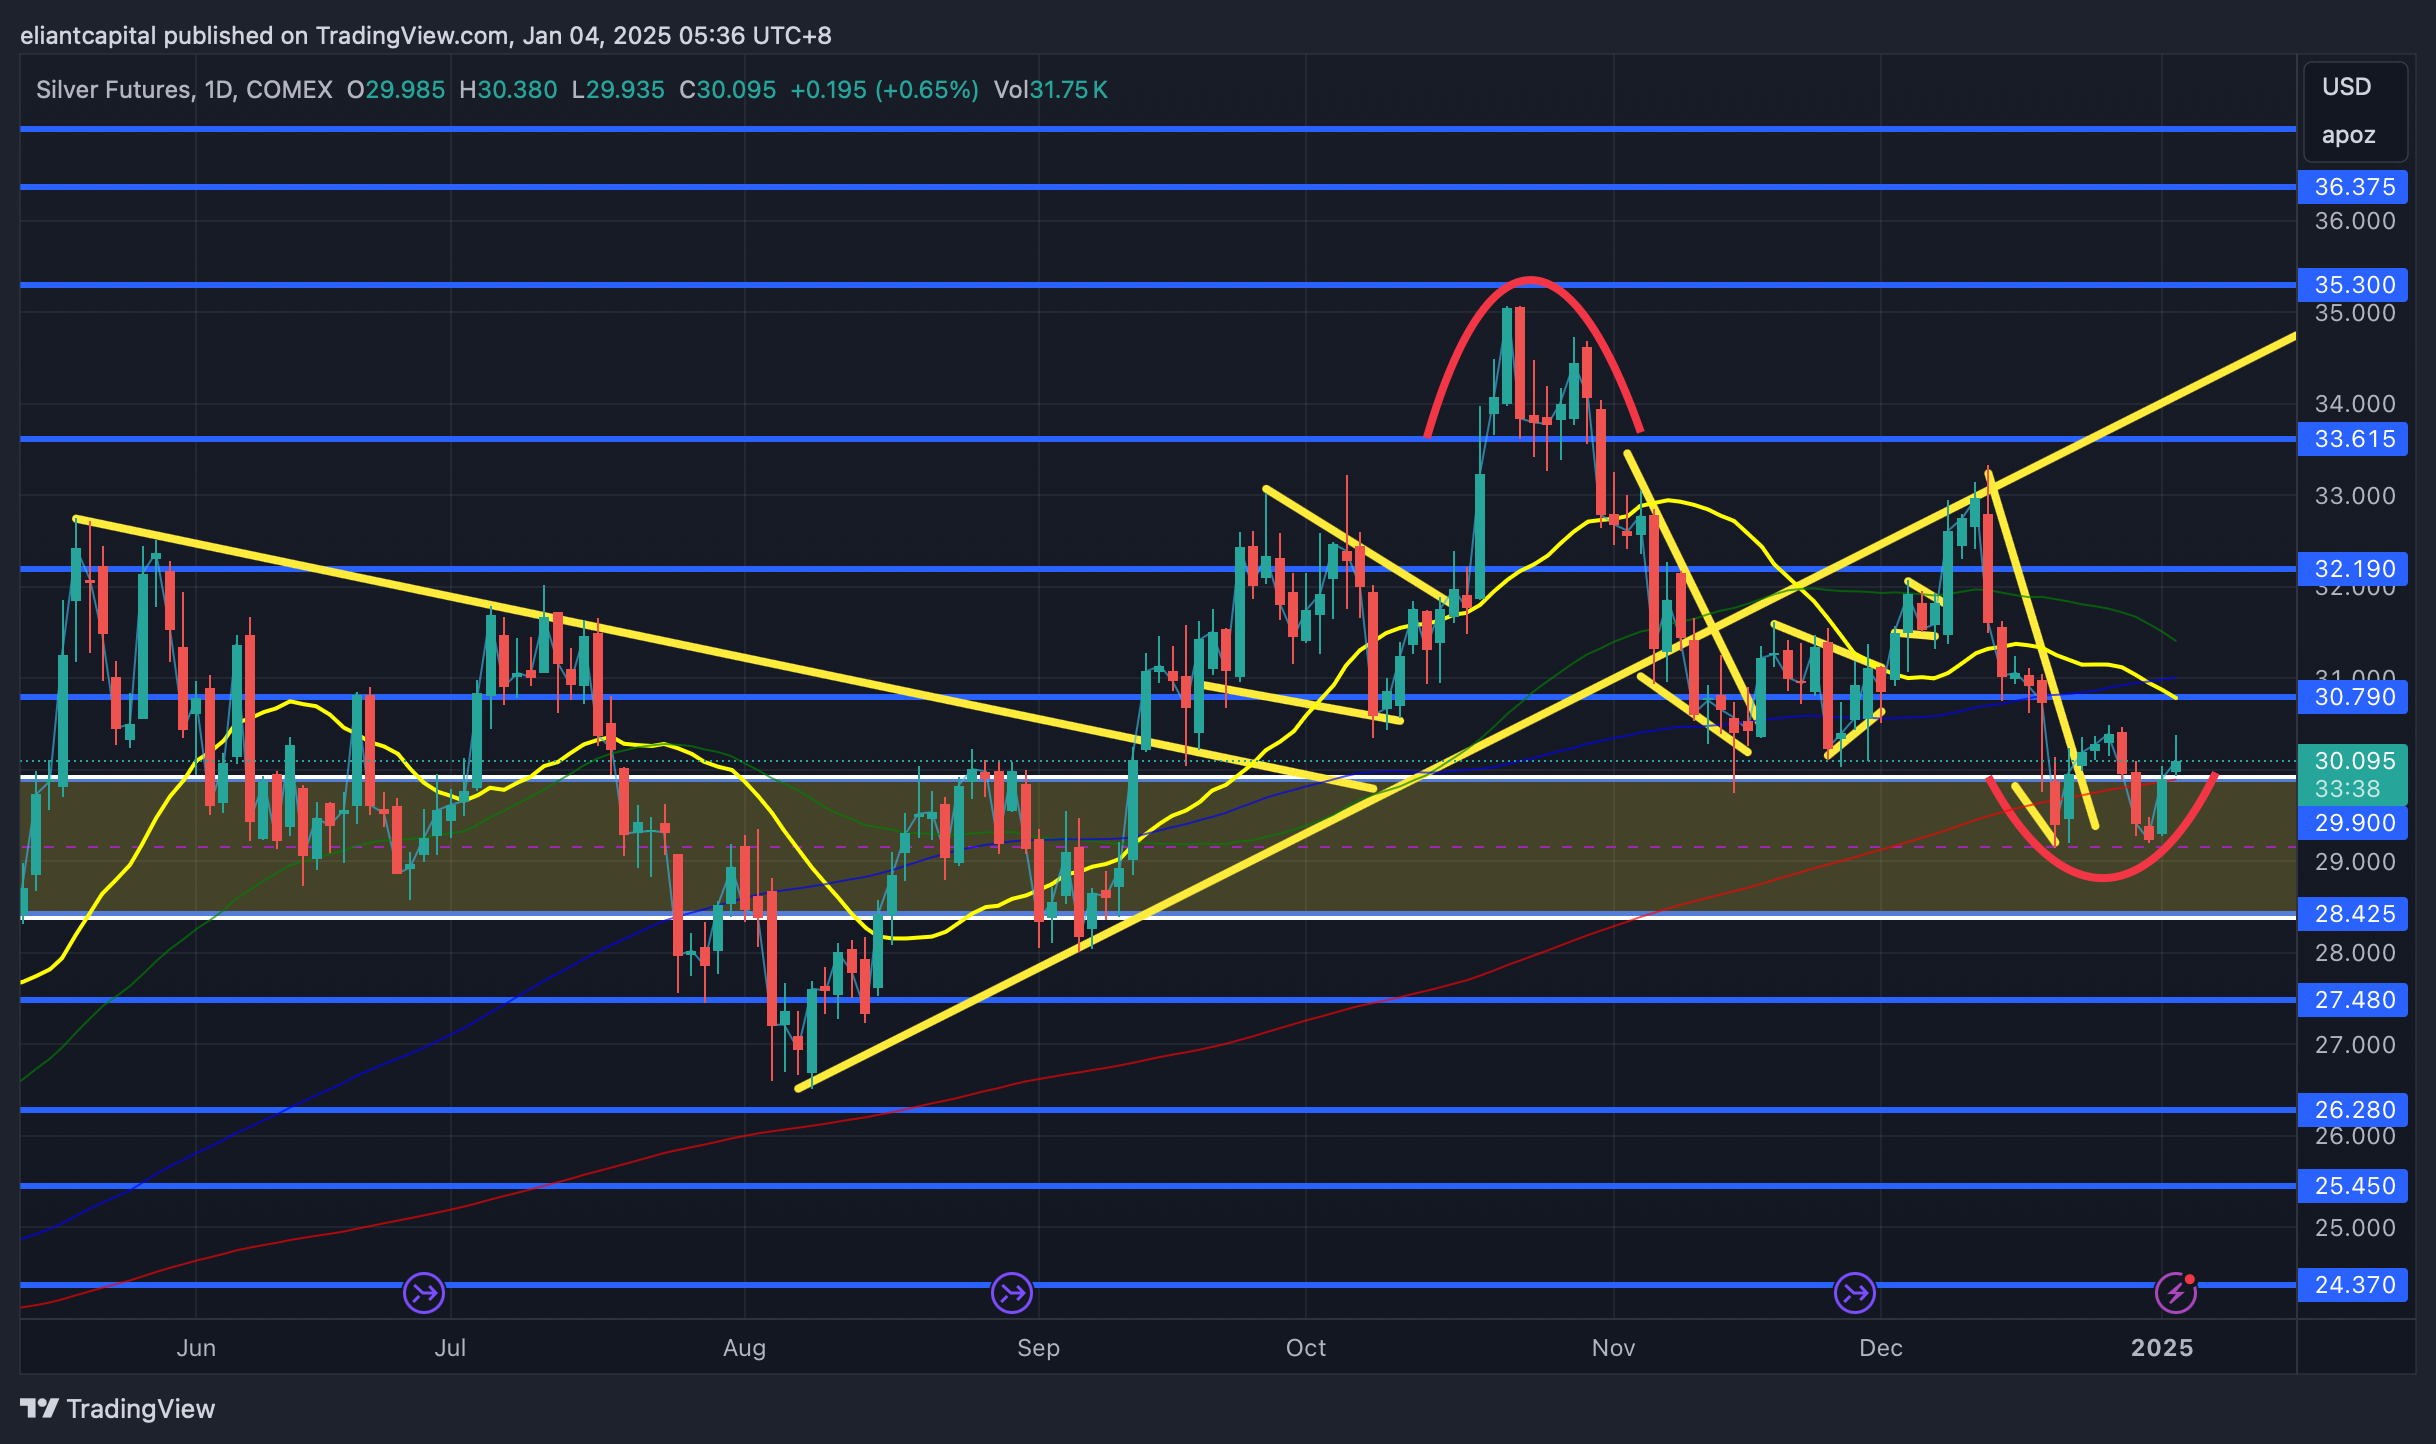
/SI
Silver ended up having a quieter week as well this past week & silver ended up closing the week out just slightly above the 200d / right on 30 / oz. essentially. Continue to think this 28.4 - 30 / oz. zone on silver should remain supportive & will remain key into ‘25, but if we were to see that zone falter (likely would happen on further reiteration from a hawkish fed due to hotter data driving the dollar higher & or even a deleveraging event), that would undo quite a bit of progress on the bigger picture for silver & we could even see a backtest of the August low near 26.28ish / oz.
In general, given how stretched hawkish sentiment is at this very moment along with the dollar & bonds (recall that dollar peaked in Jan ‘17 into Trump inauguration), we could start to see flows shift back towards Commodities & EMs if both bonds see downside relief & the dollar sees upside relief which could revert silver right back higher out of this bottoming / potential rounded base… likely towards 32 / oz. in a hurry.