The Week Ahead 2/16/26

Hello All,
I hope you’re all enjoying the long weekend and getting some time away from the screens & wishing you all a successful ‘26 ahead.
Looking back at this past week, index-level action was relatively contained early on, but volatility began to pick up into the latter half. Beneath the surface, dispersion remained the dominant theme, with significant volatility across single names continuing.
On the economic data front, the broader message of a ‘Goldilocks’ regime remains intact. Growth / Labor market data continues to point toward a re-acceleration, whilst inflation readings have come in more tame than expected.
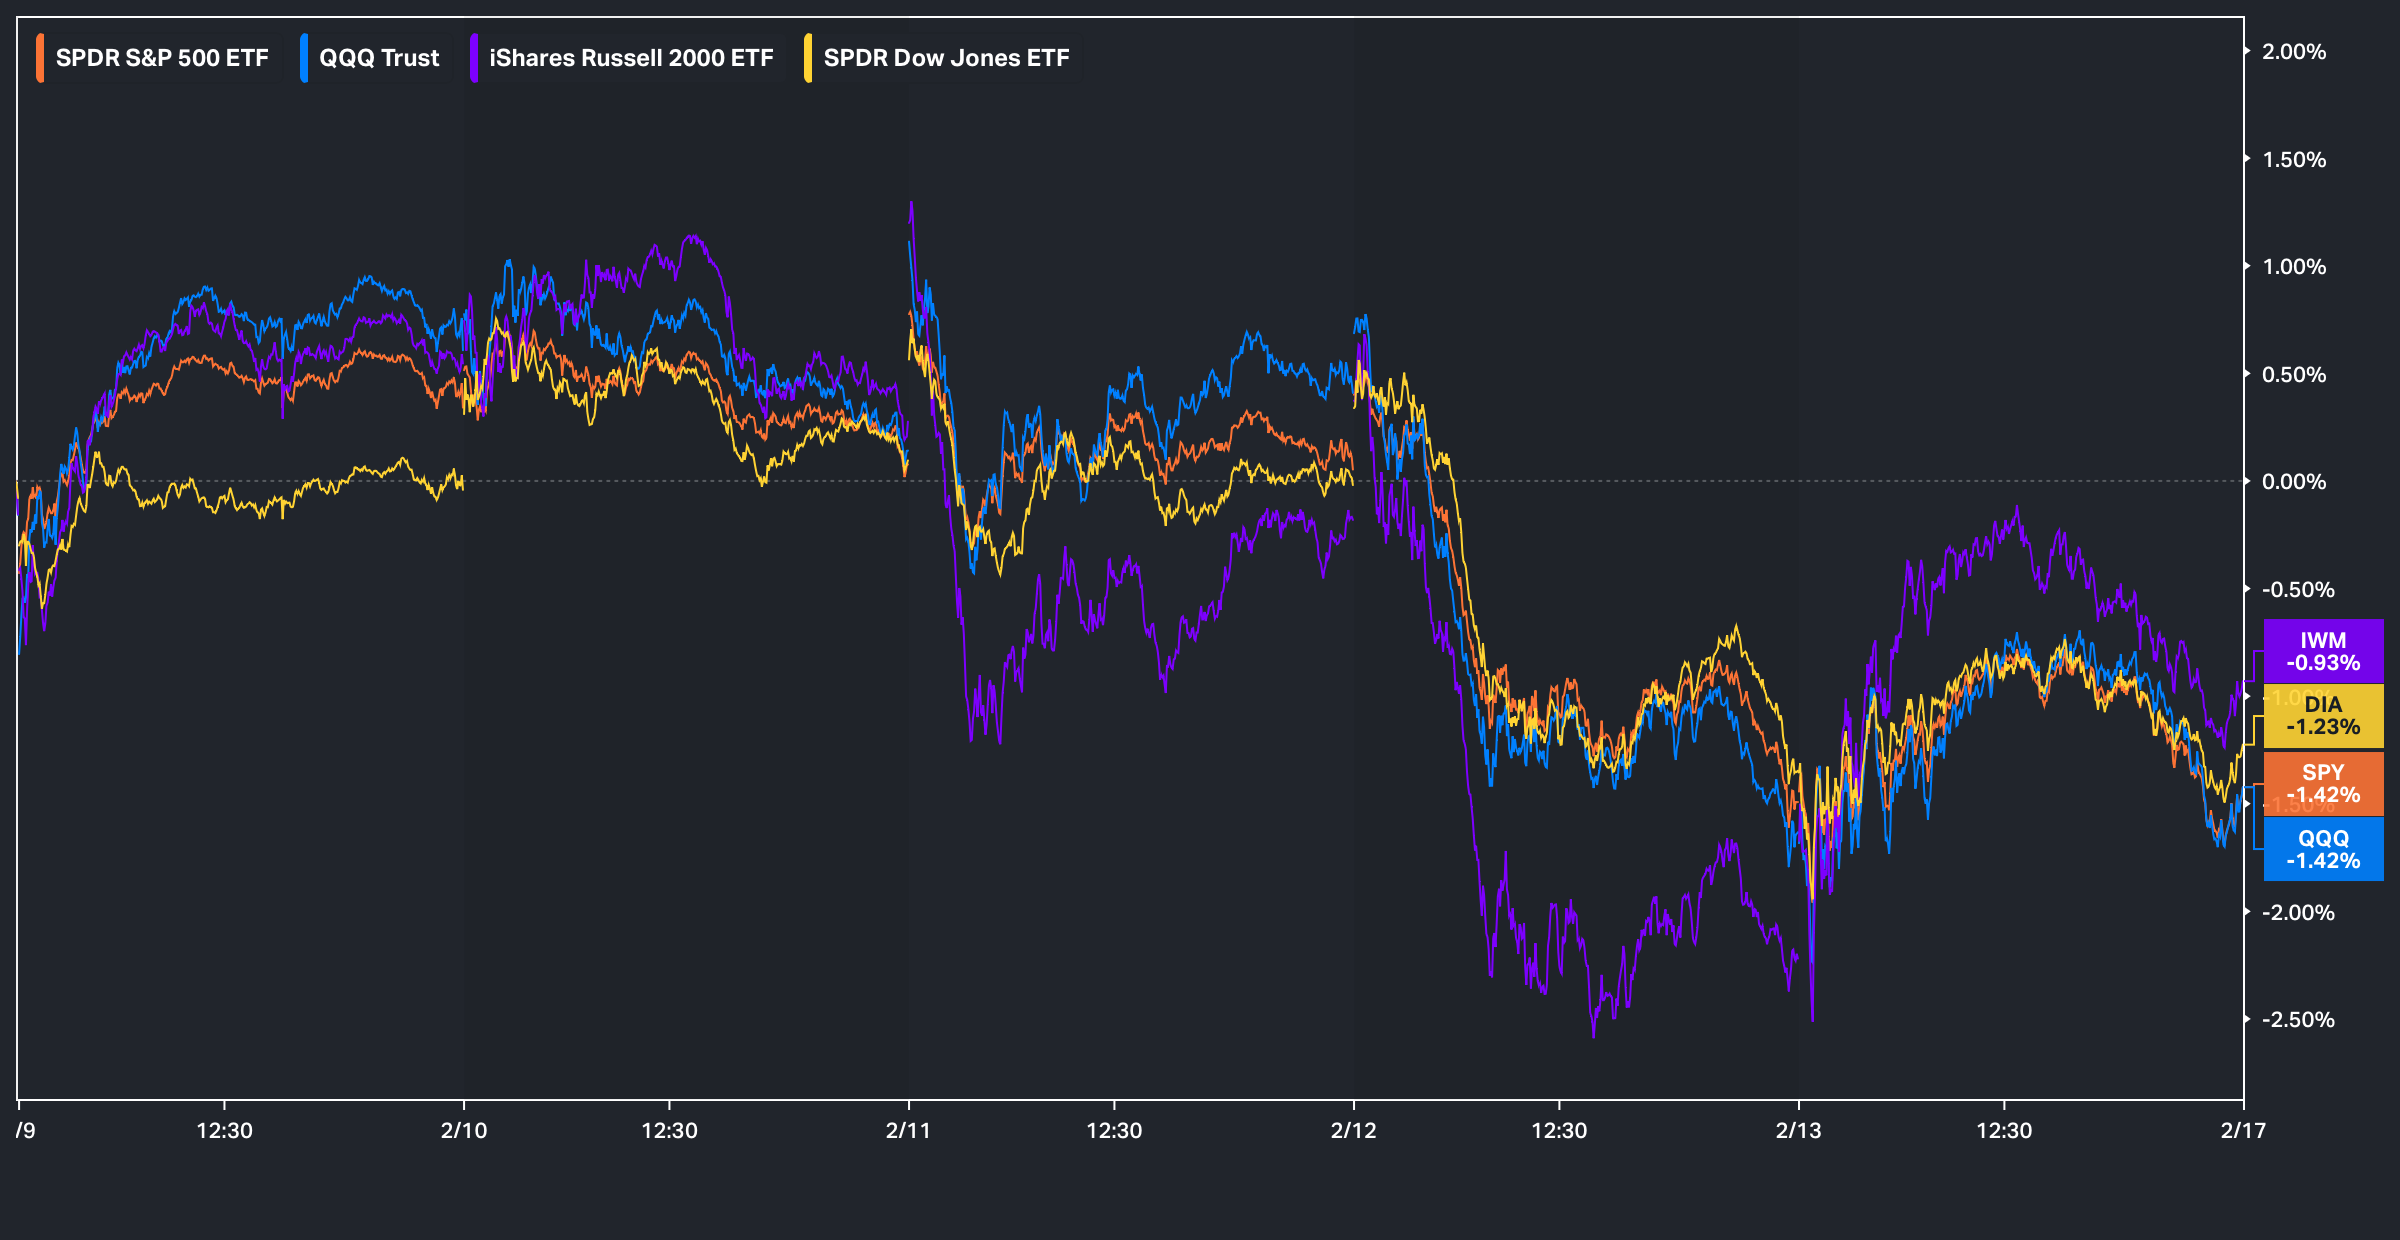
And as for the indices, the group ultimately closed lower across the board. Small-caps were the ‘best’ performing of the indices although still closed lower by just over 90bps whereas the Qs were the worst performer, closing lower by roughly 140bps, as the rotation from growth to value persisted.
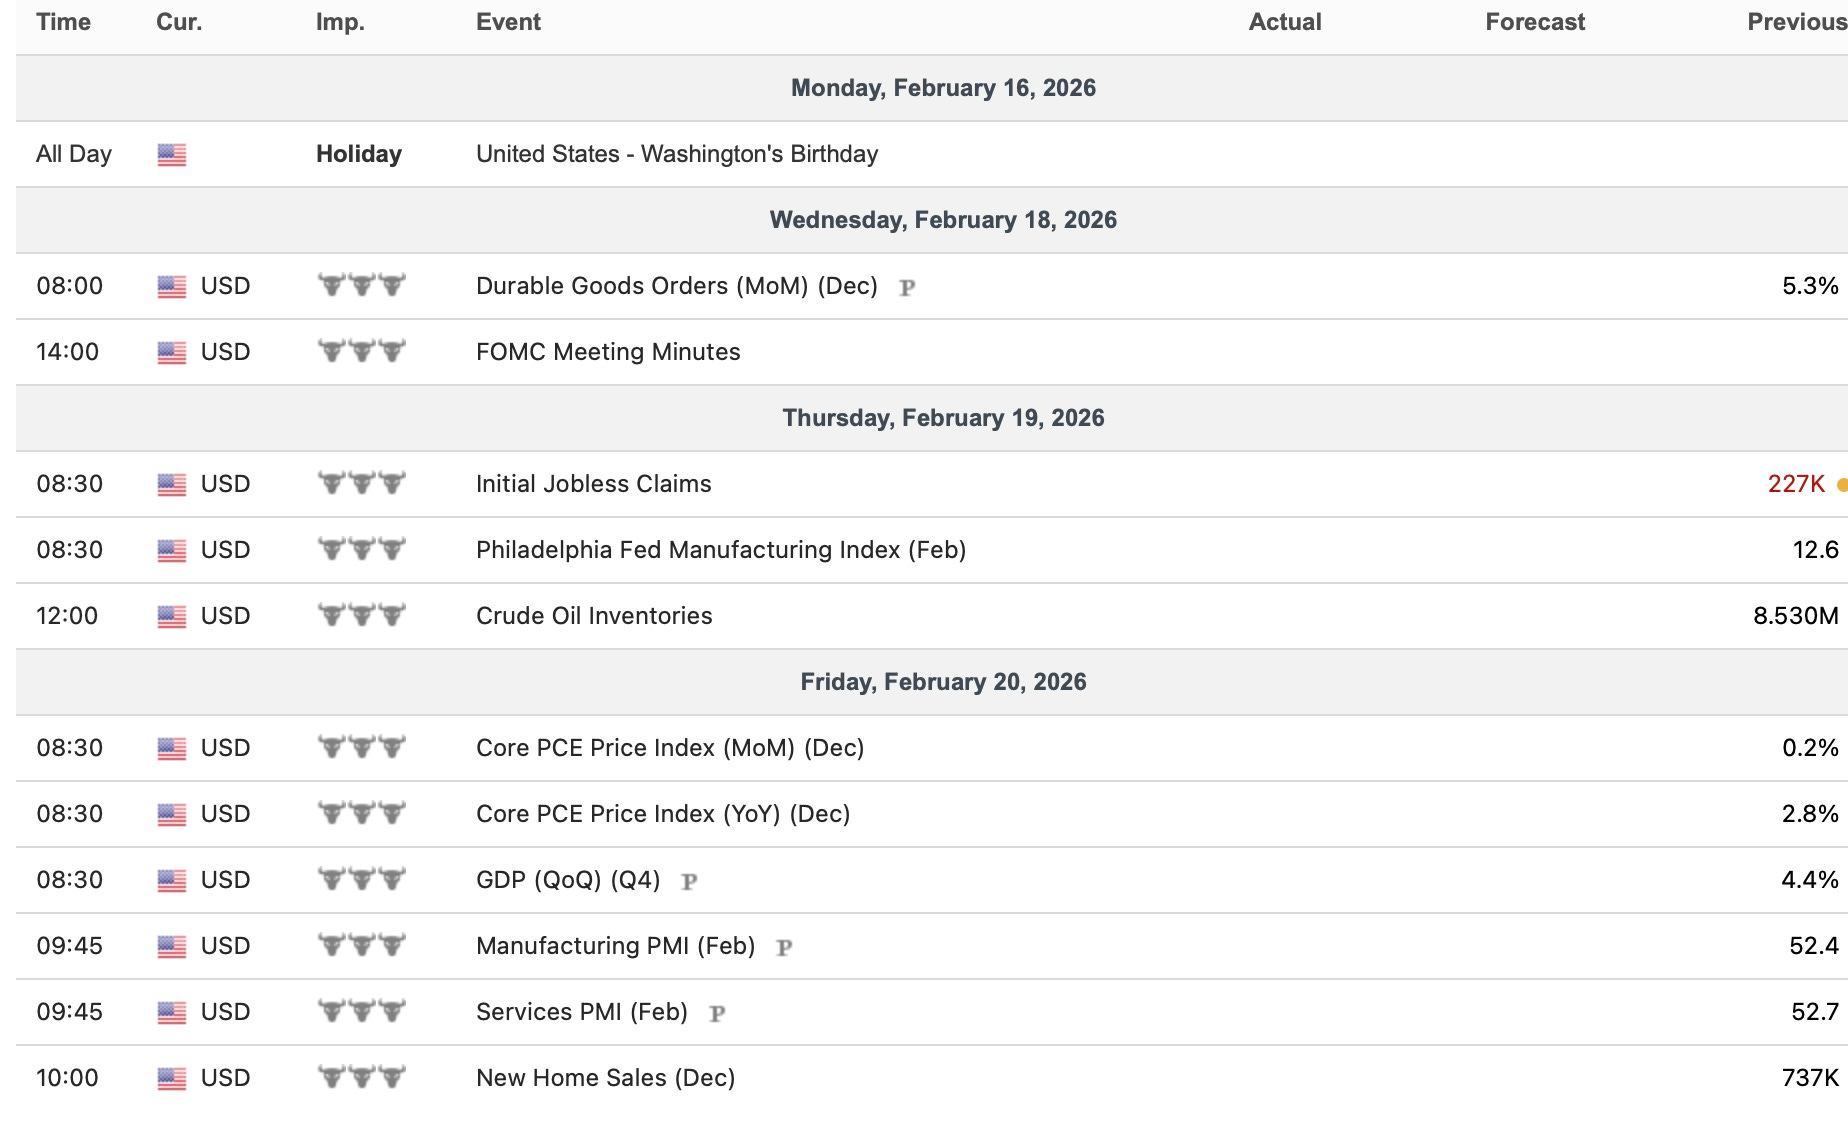
- Economic Data for the Coming Week:
In regard to economic data into the upcoming week, it’s a shortened week given the holiday on Monday but generally speaking, it’s a relatively quieter week as well as the ‘biggest’ & or really only important economic data point is PCE #’s on Friday (Fed’s preferred gauge for inflation) along with a few smaller & sporadic datapoints scattered throughout the week.
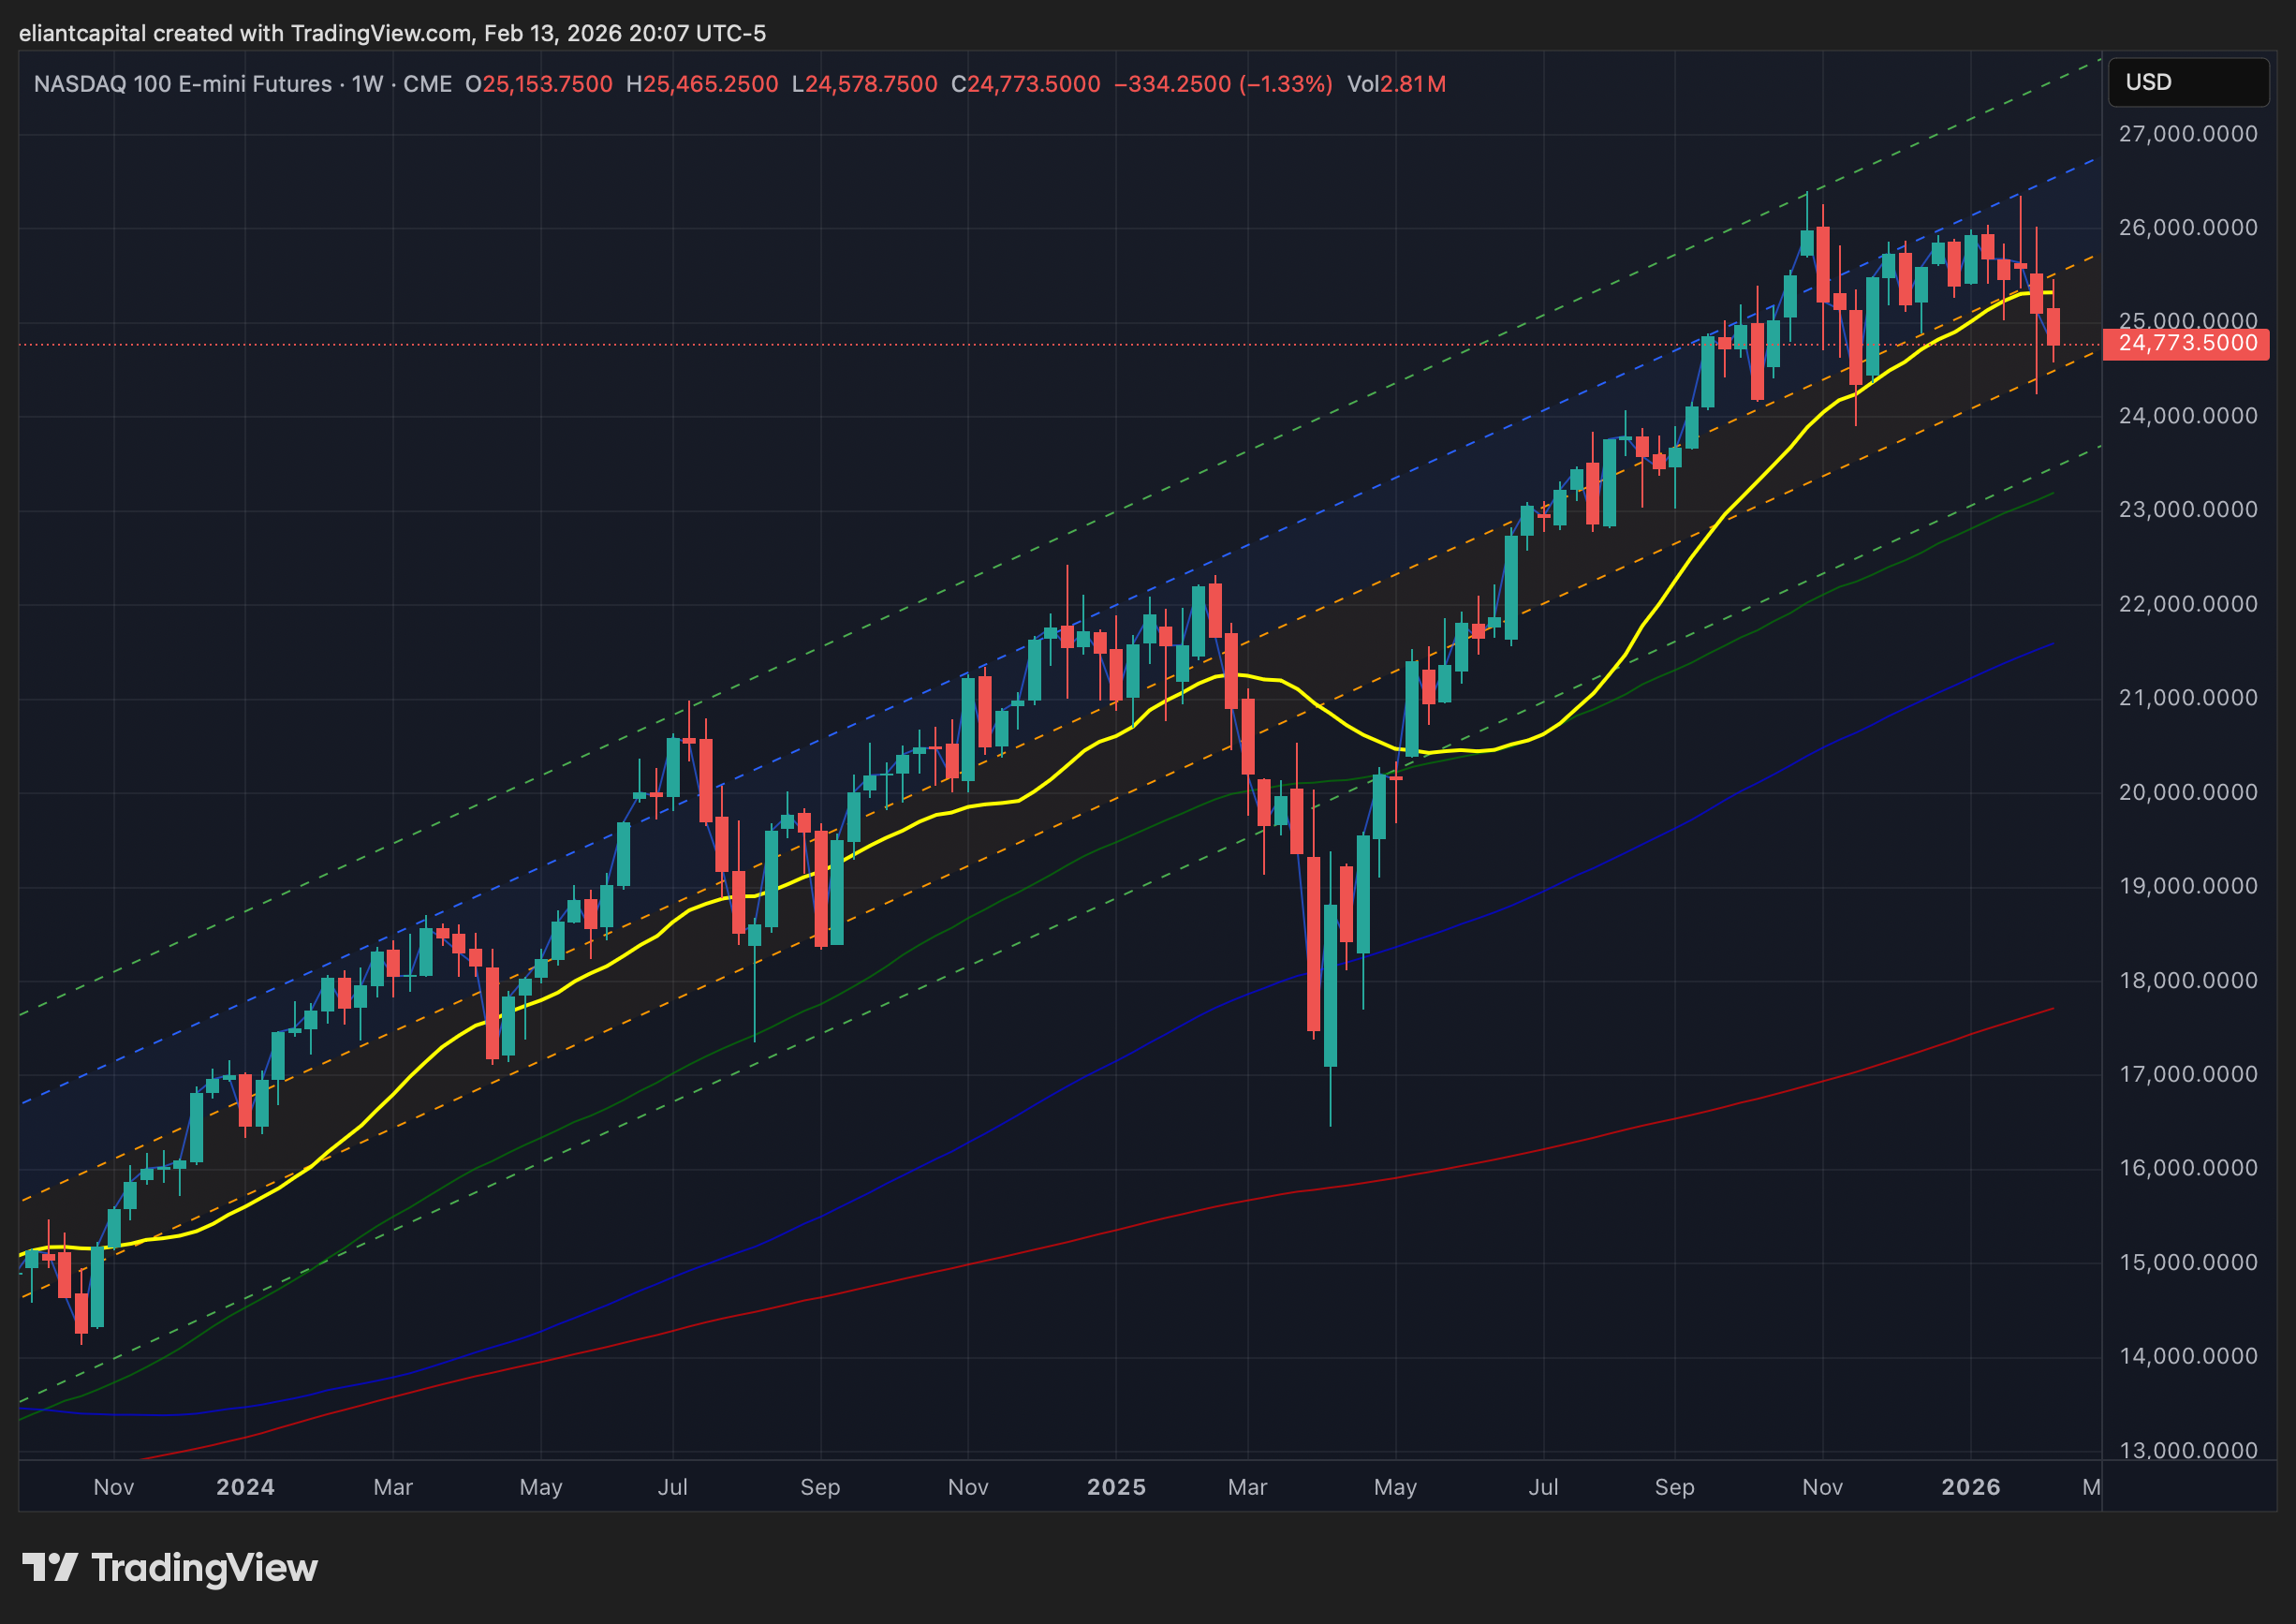
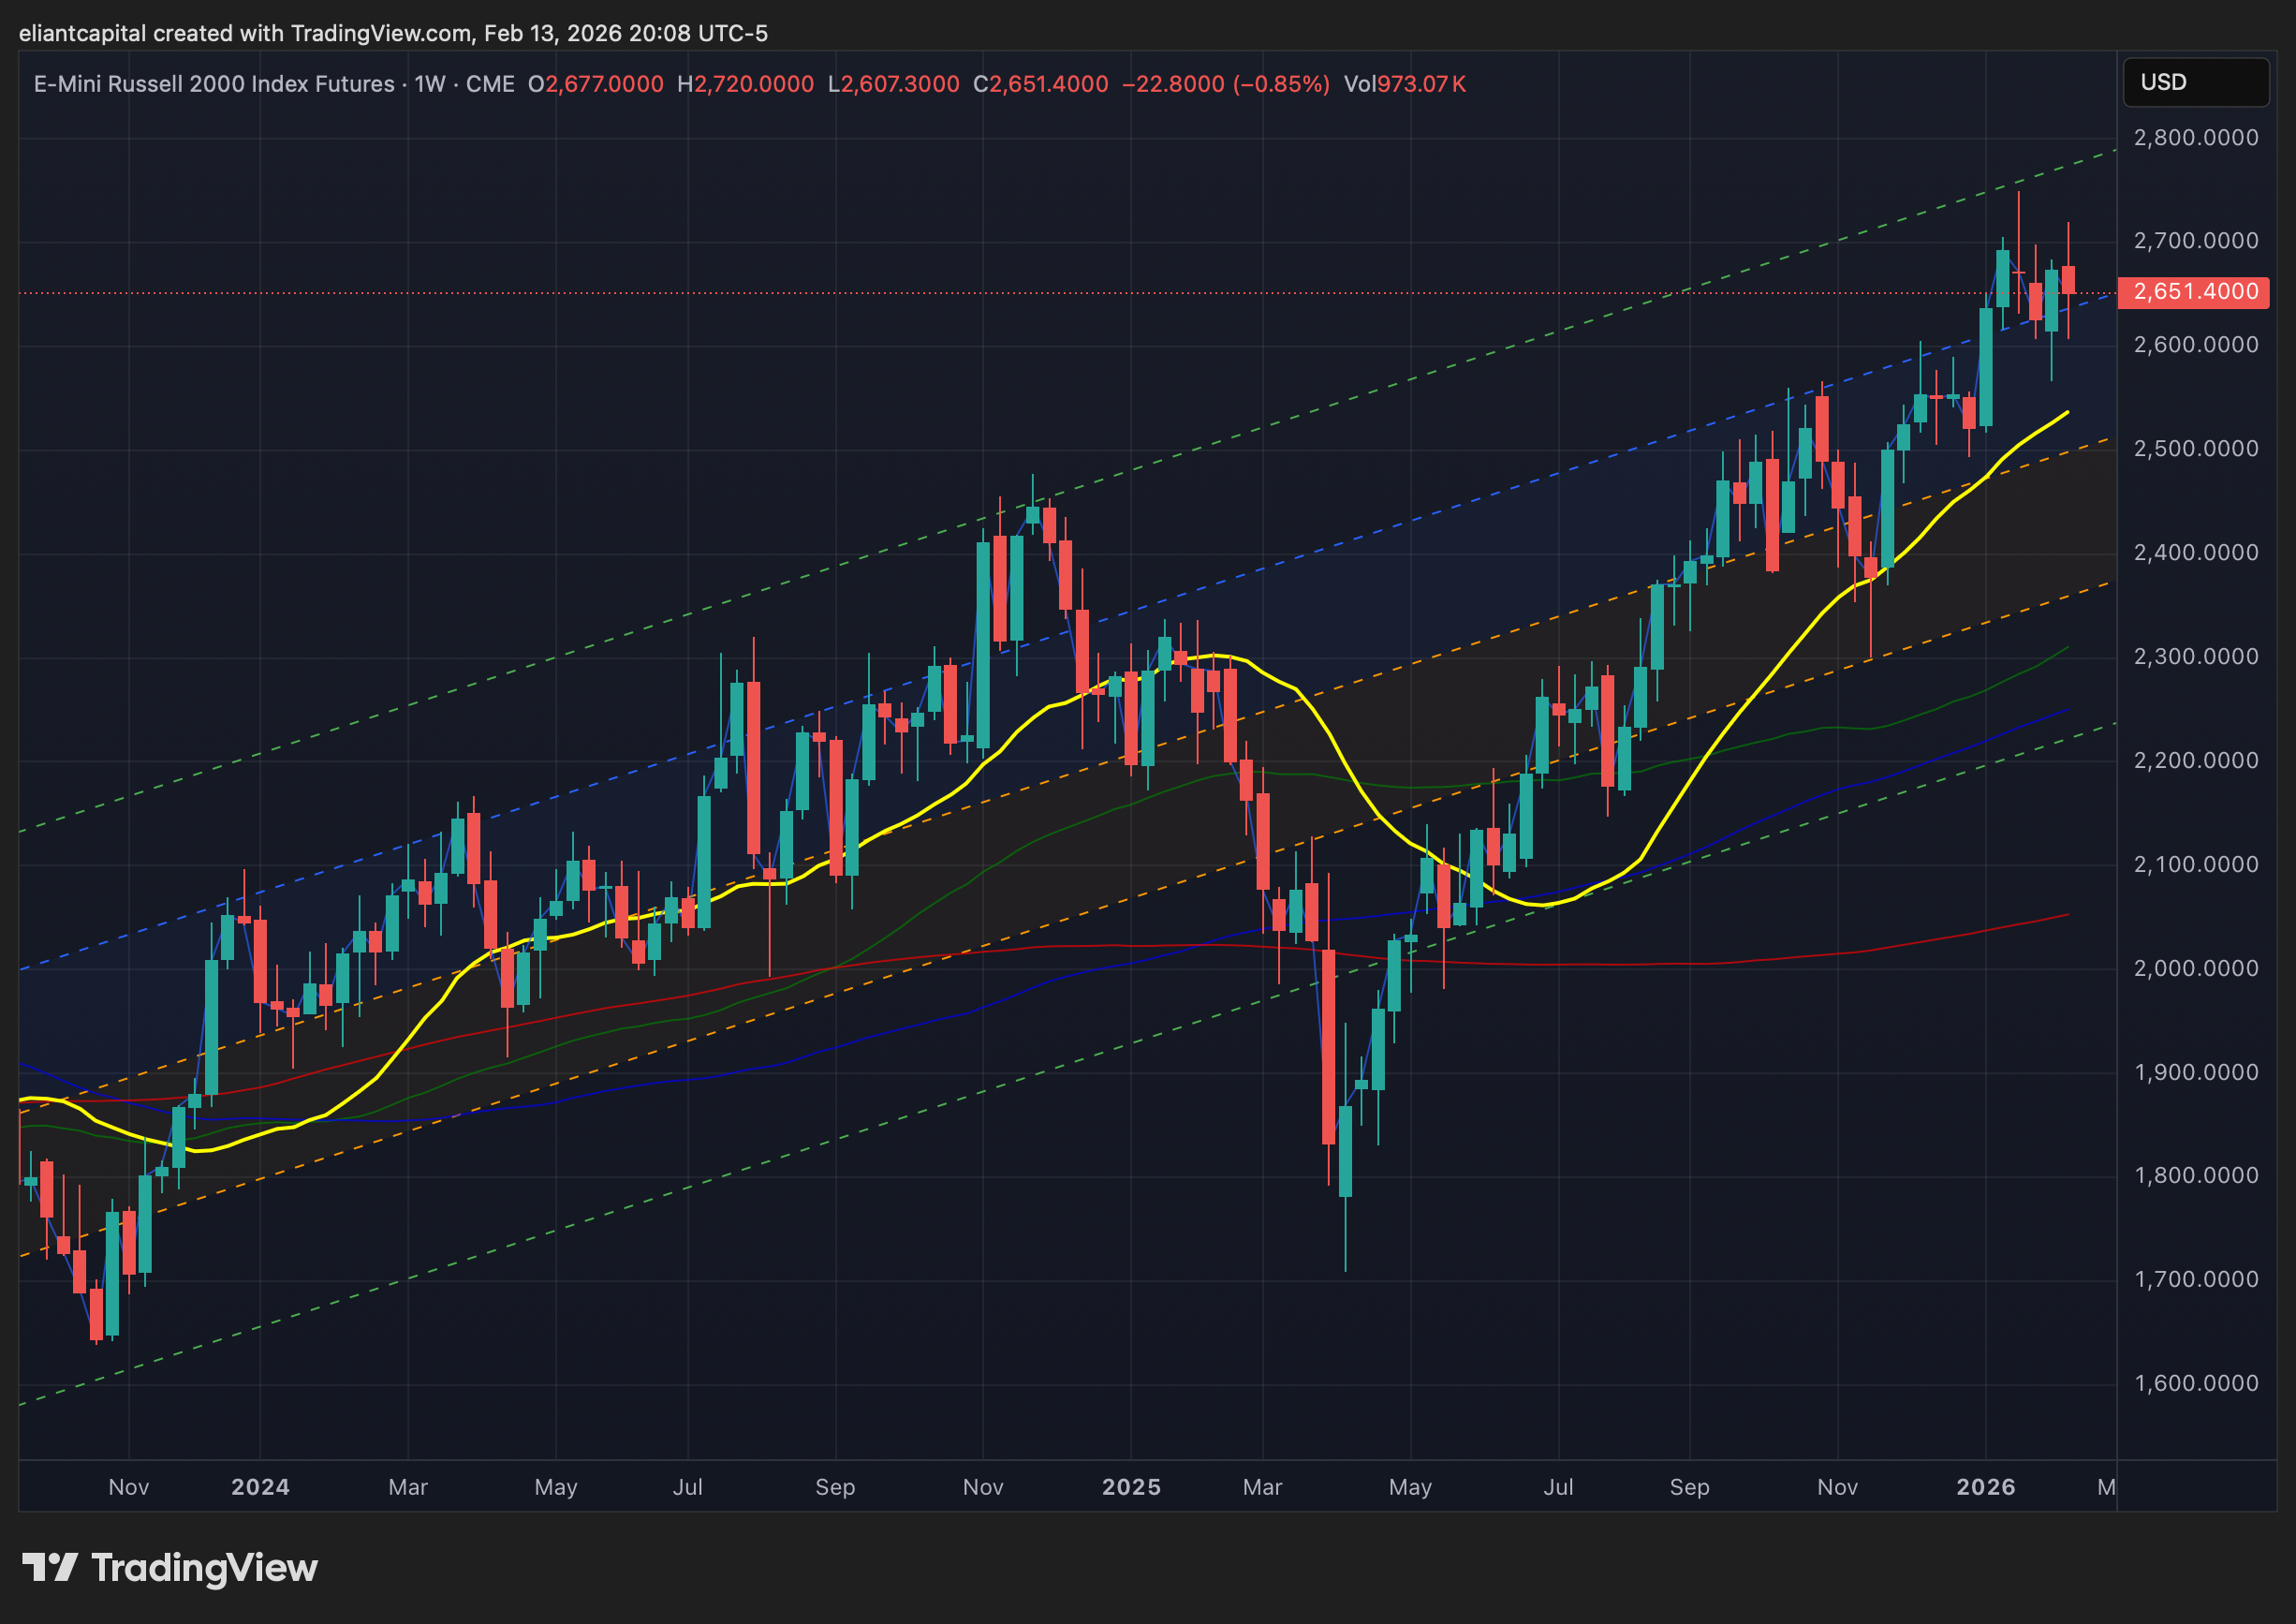
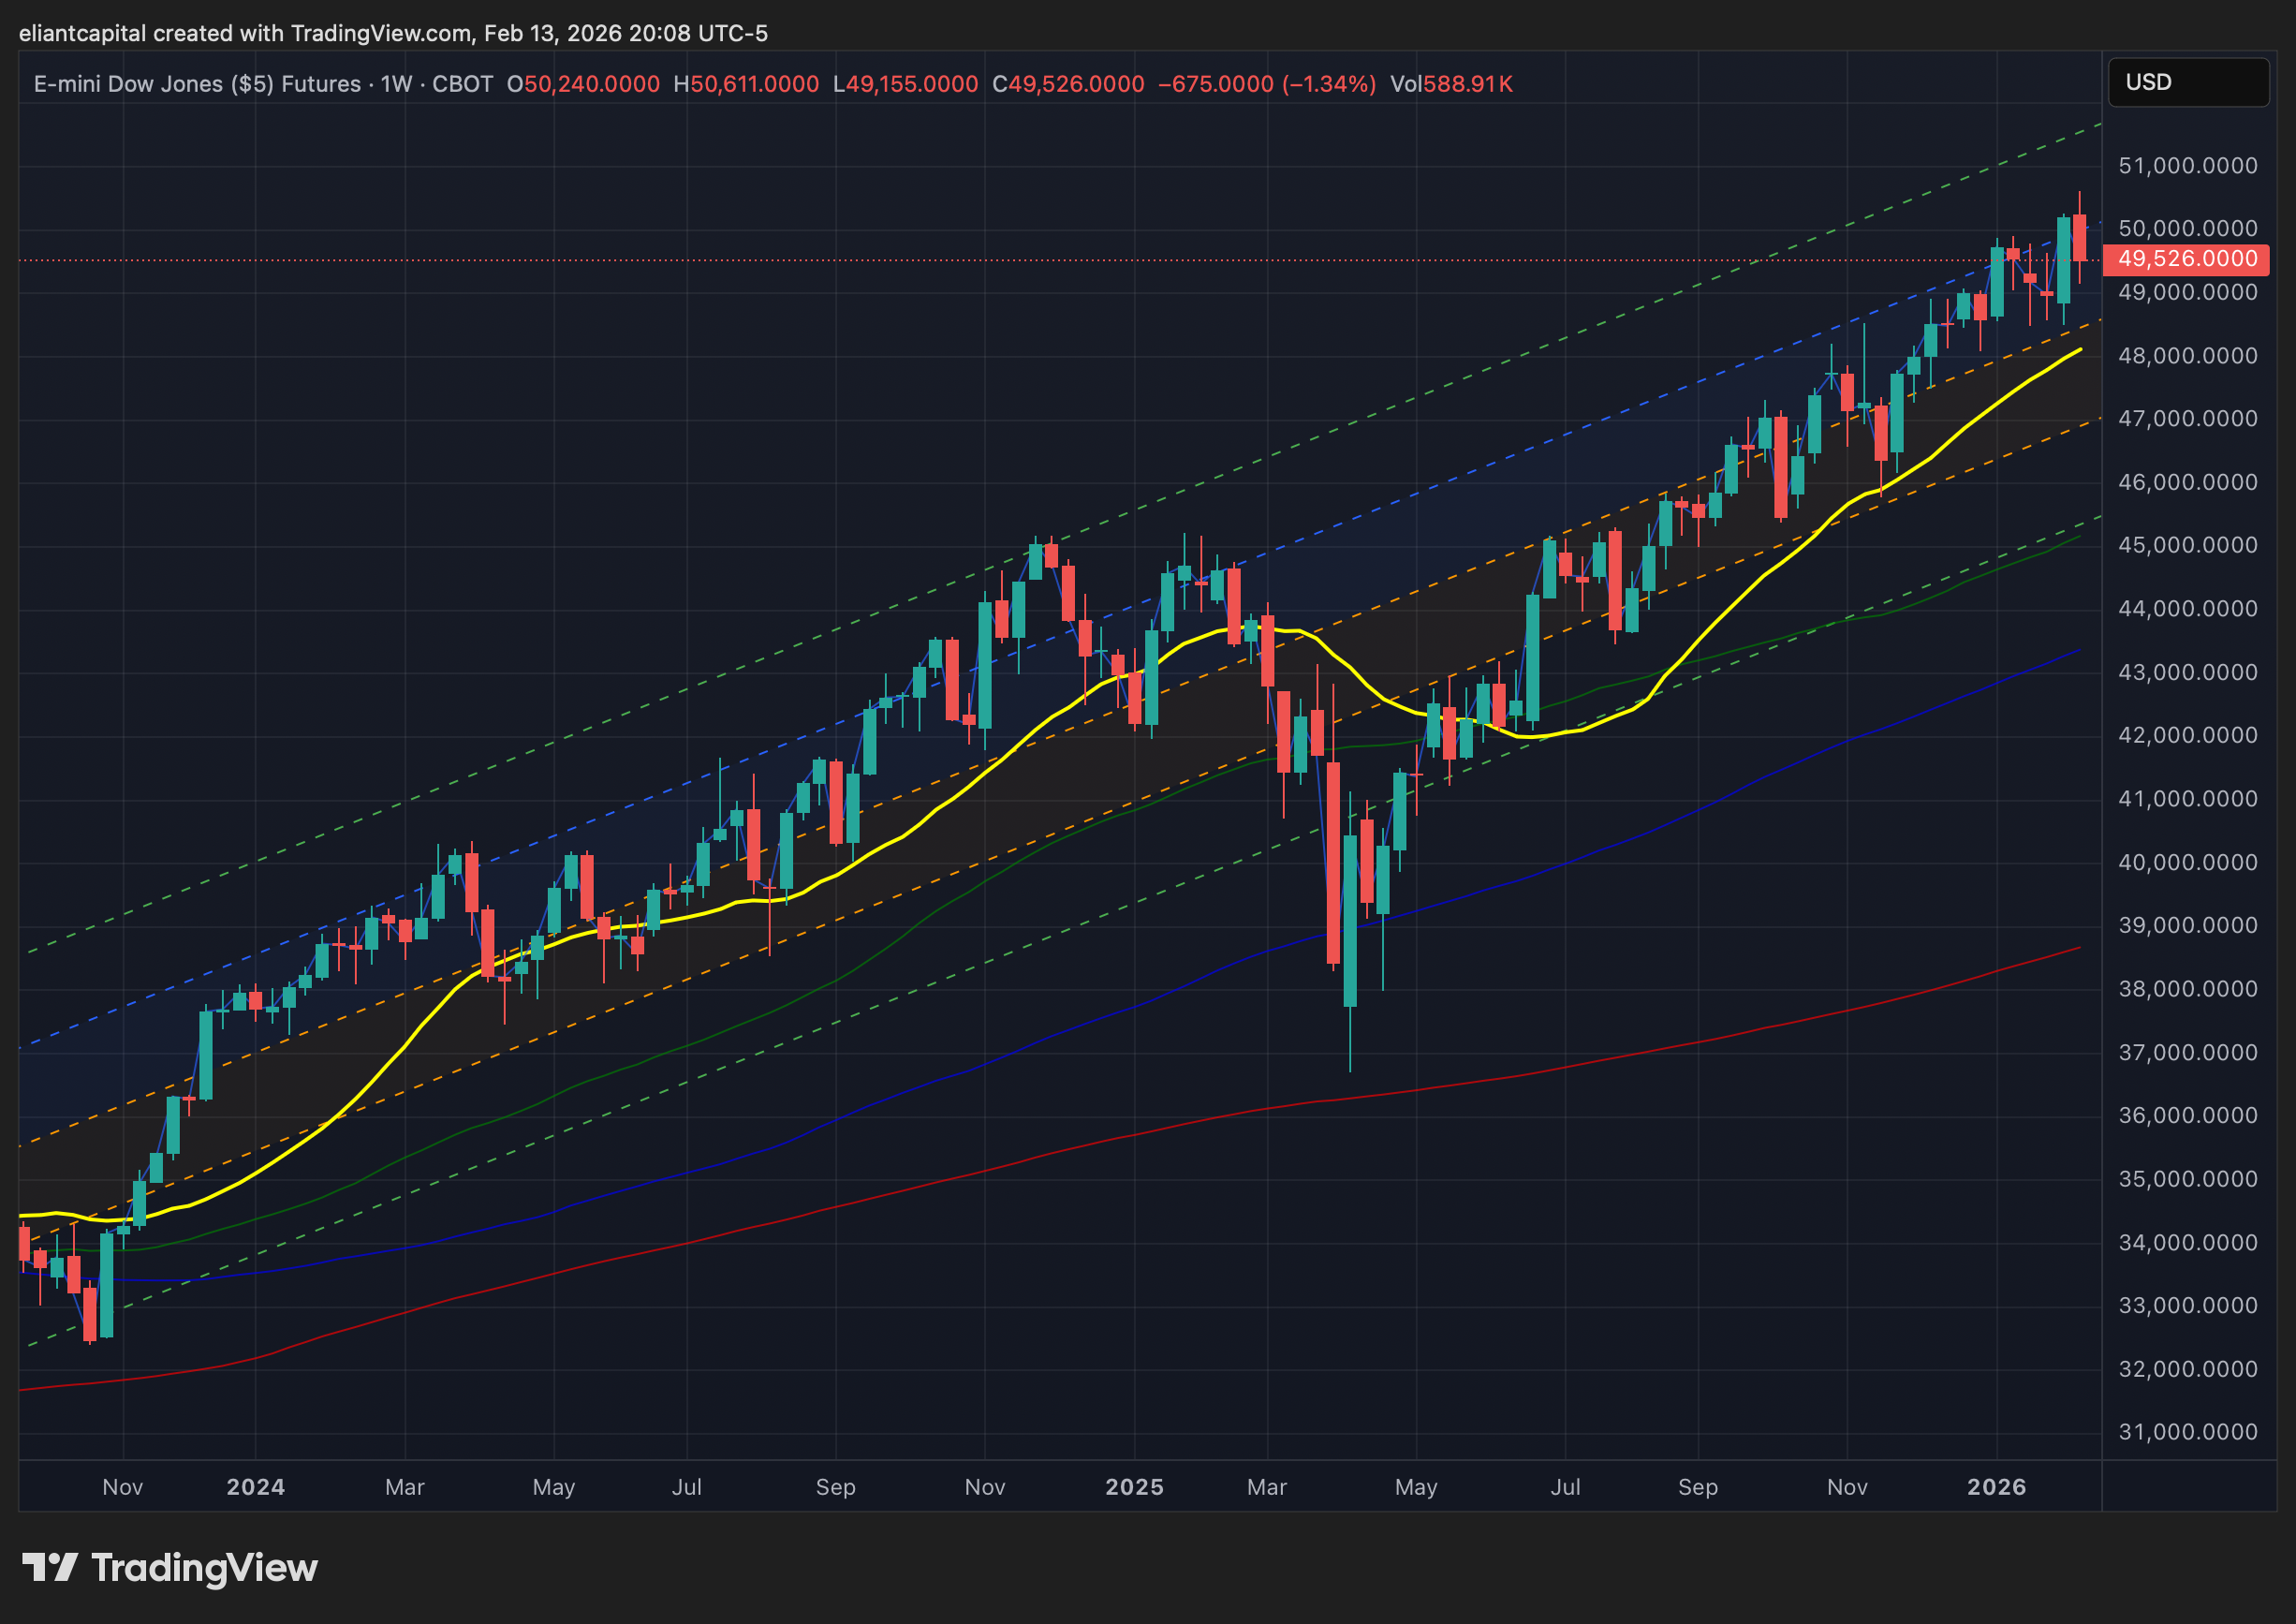
- STD Channels on Indices for Perspective: Weekly TF
- SPY
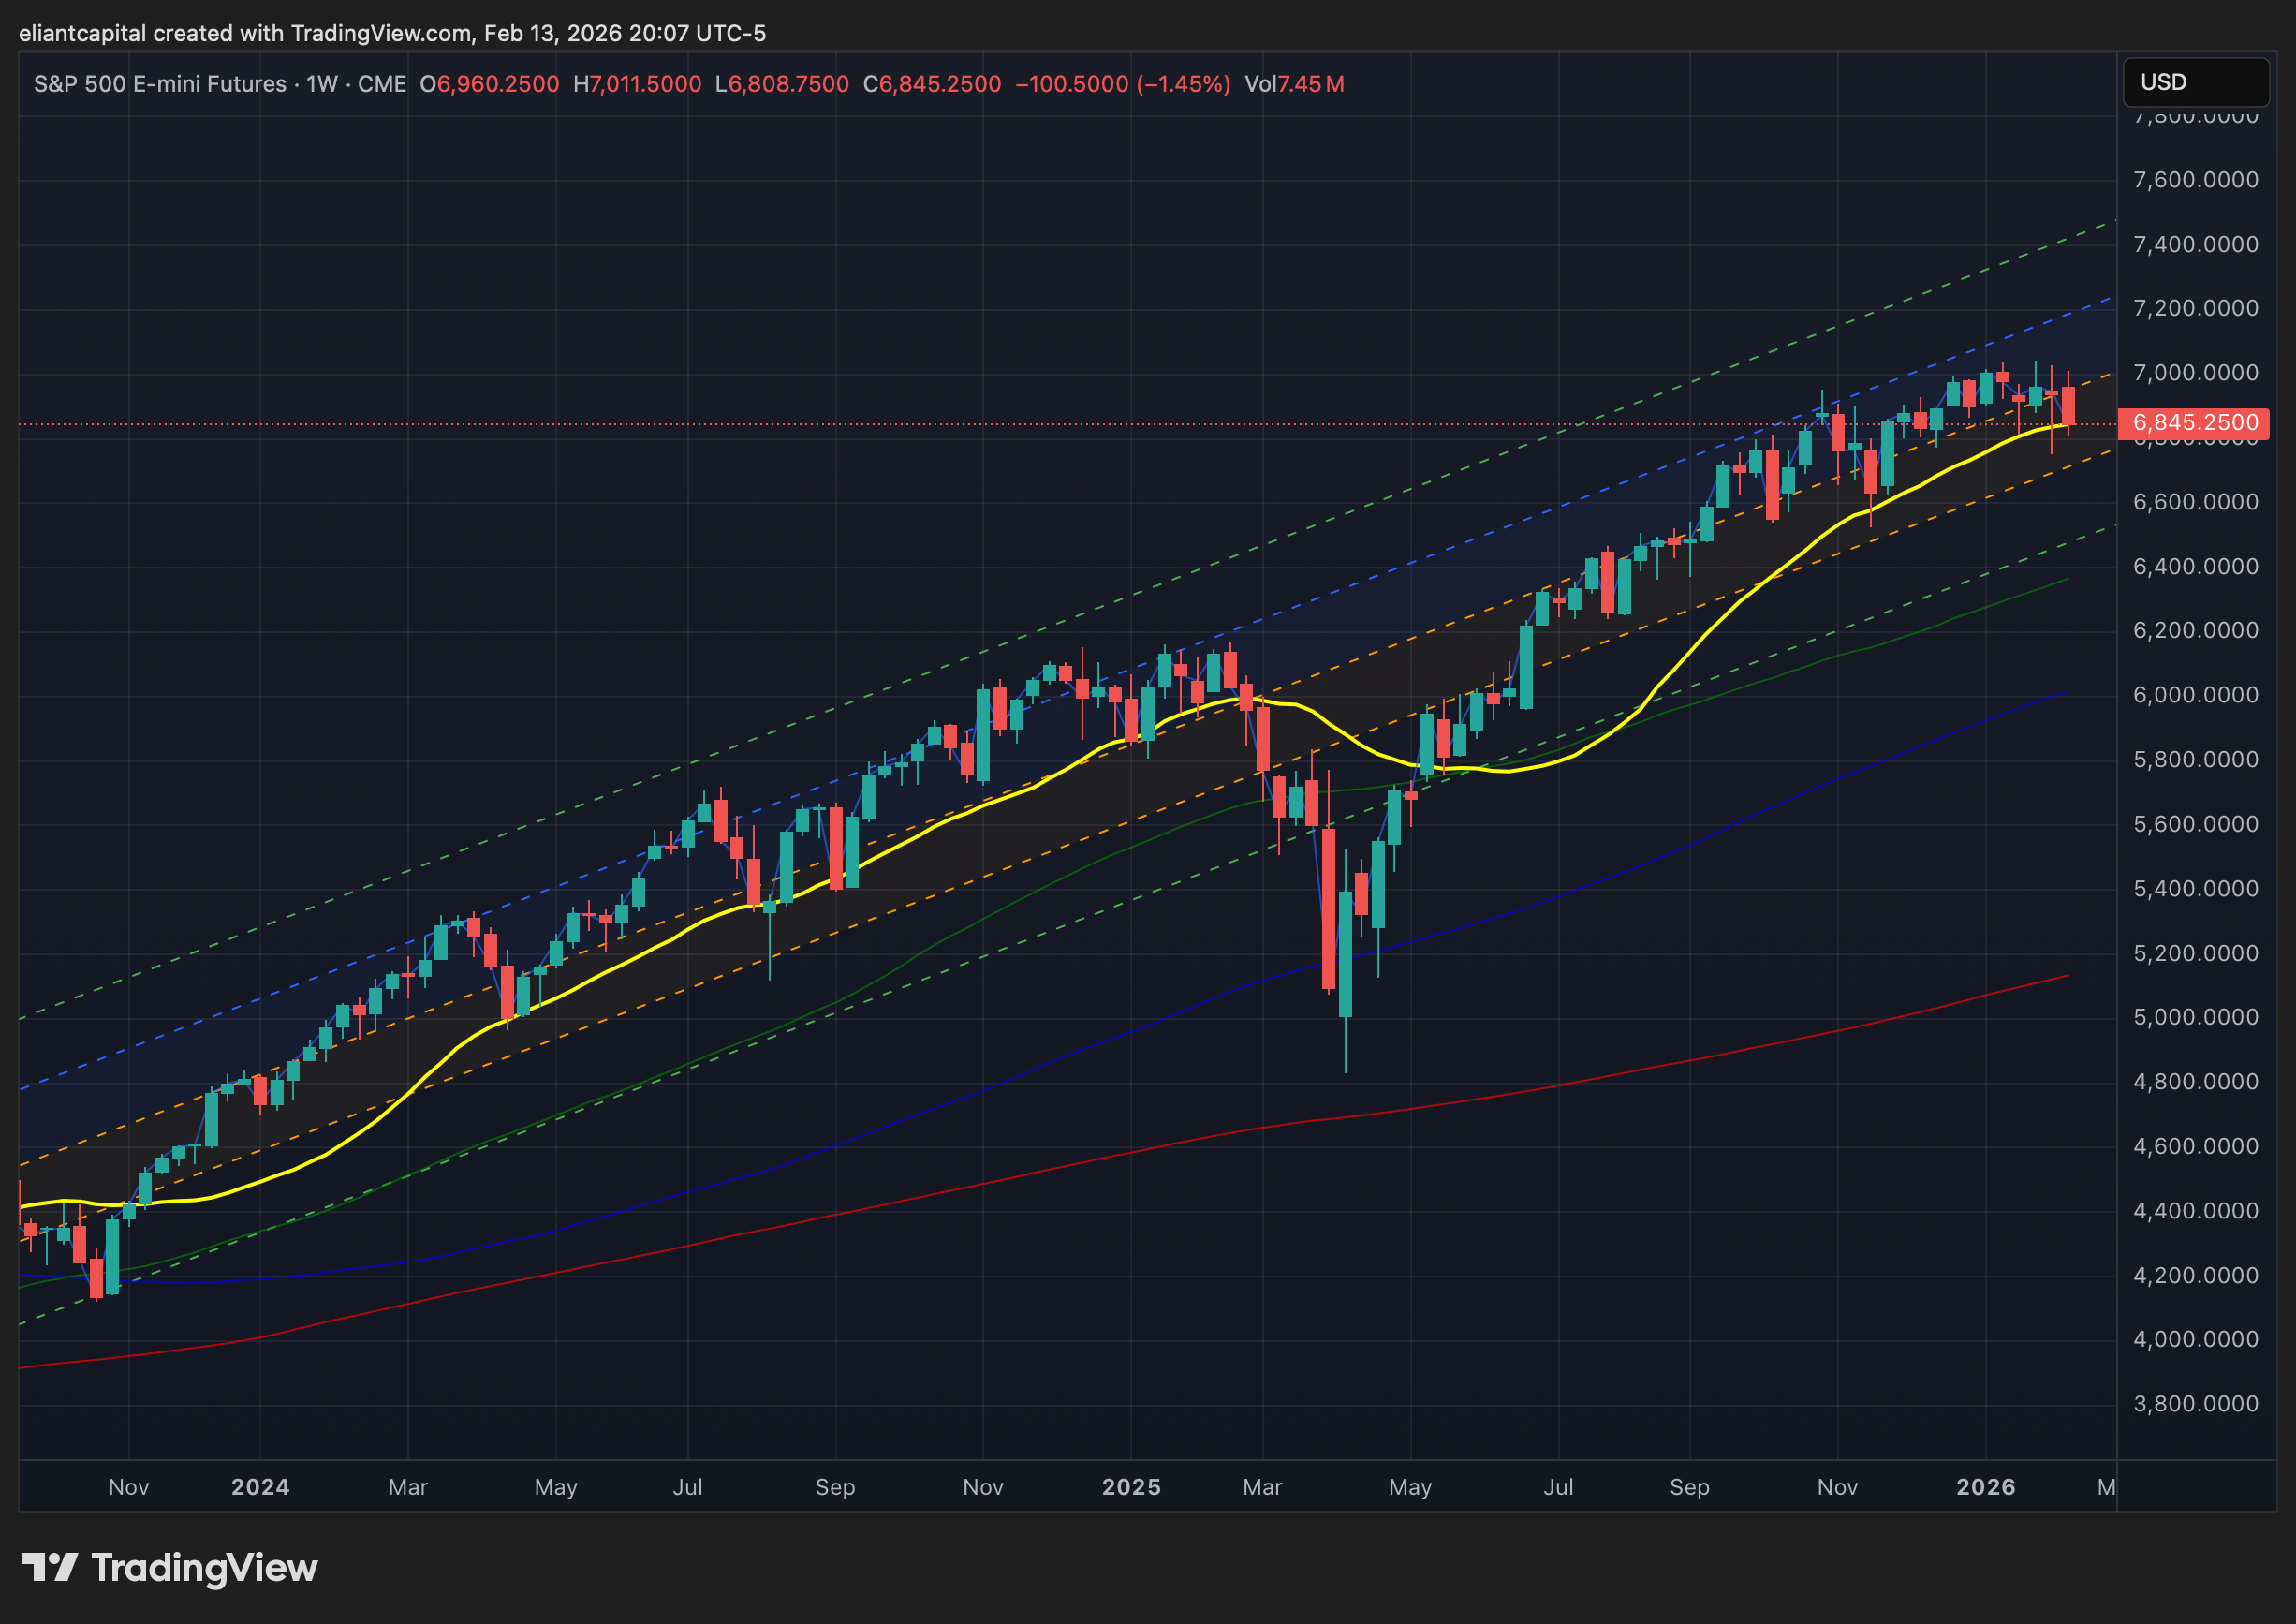
- QQQ
- IWM
- DJIA
Since starting this Substack back in June of ‘23, between individual names / tactical trades / baskets, we have netted a 181.97% return whilst in the same period, the Q’s have returned 70.82% / Spooz has returned 63.15% / Dow has returned 53.27% & Small-caps have returned 50.10%, so nice outperformance against all the indices whilst having a 81.8% win rate, averaging a 27.99% return on realized gains / winners & a 15.34% loss on realized losses / losers.
Looking forward to the future & continued success through ‘26.
And for anyone who wants to follow an actively managed portfolio in real time:
I’ve joined Plutus as the cleanest, day-to-day way to track an actively managed portfolio in real time. It’s a live dashboard that’s broader, more diversified, actively managed by me, & updated continuously.
The Eliant Flagship is published on RunPlutus.
Once your Plutus account is approved, you’ll have the option to allocate right away. If you do, it’s straightforward: create an account, link your brokerage (Available only for IBKR at this time), & select the Eliant Flagship (or any of the baskets I’ve built). Your money stays in your account, and trades, position changes, and rebalances are replicated automatically so there’s nothing manual to manage. The idea is to make it easier to access an actively managed portfolio run by me without the overhead of traditional fund structures or high minimums, whilst you keep full custody of your assets & I stay focused on research, positioning, and portfolio construction.
And just to be clear, NOTHING is changing with Substack. It’ll stay exactly what it’s always been since we originally launched in the Summer of ‘23: where I share the thinking, research, & select trades behind my personal PA, along with ongoing commentary across all markets.

For those who may have missed, we published our ‘2026 Outlook’ which has a plethora of coverage on a wide range of topics / themes as ‘26 kicks off after coming off a strong ‘25 & for those whom would like to go back & read the report, I included it just below:

Earlier in 2024, we launched a series titled Educational Pieces, covering a wide range of topics, many of which were suggested directly by you all (4-Part Series).
For those who may have missed the first installment, it covered topics including:
General background / knowledge on all option strategies
In-depth talk on risk / reversals & how to go about expressing / utilizing them
Options Structuring
When to used naked calls / puts vs. spreads
Choosing expiration dates
Identifying key pivots / supports / resistance zones
General briefing on stock gaps
What to look for in regards to fundamentals
Implementing fundamental / macro / technicals into a trade
Hedging
Creating risk/reward setups
Taking profits / managing losses
Overall Process
Book recommendations
A link to the original Educational Piece can be found here .
Given the positive feedback and how useful many of you found the first installment, we followed up with Educational Piece: Part Deux earlier in 2025 & for those who may have missed, a link to the piece can be found here & we then went on to release Educational Piece: Part Trois which can be found here.
And finally, the most recent installment, Educational Piece: Part Quatre, can be found here.
‘Risk management is the silent prerequisite for compounding & true wealth is built not by chasing the highest returns but by ensuring the survival necessary to realize them.’
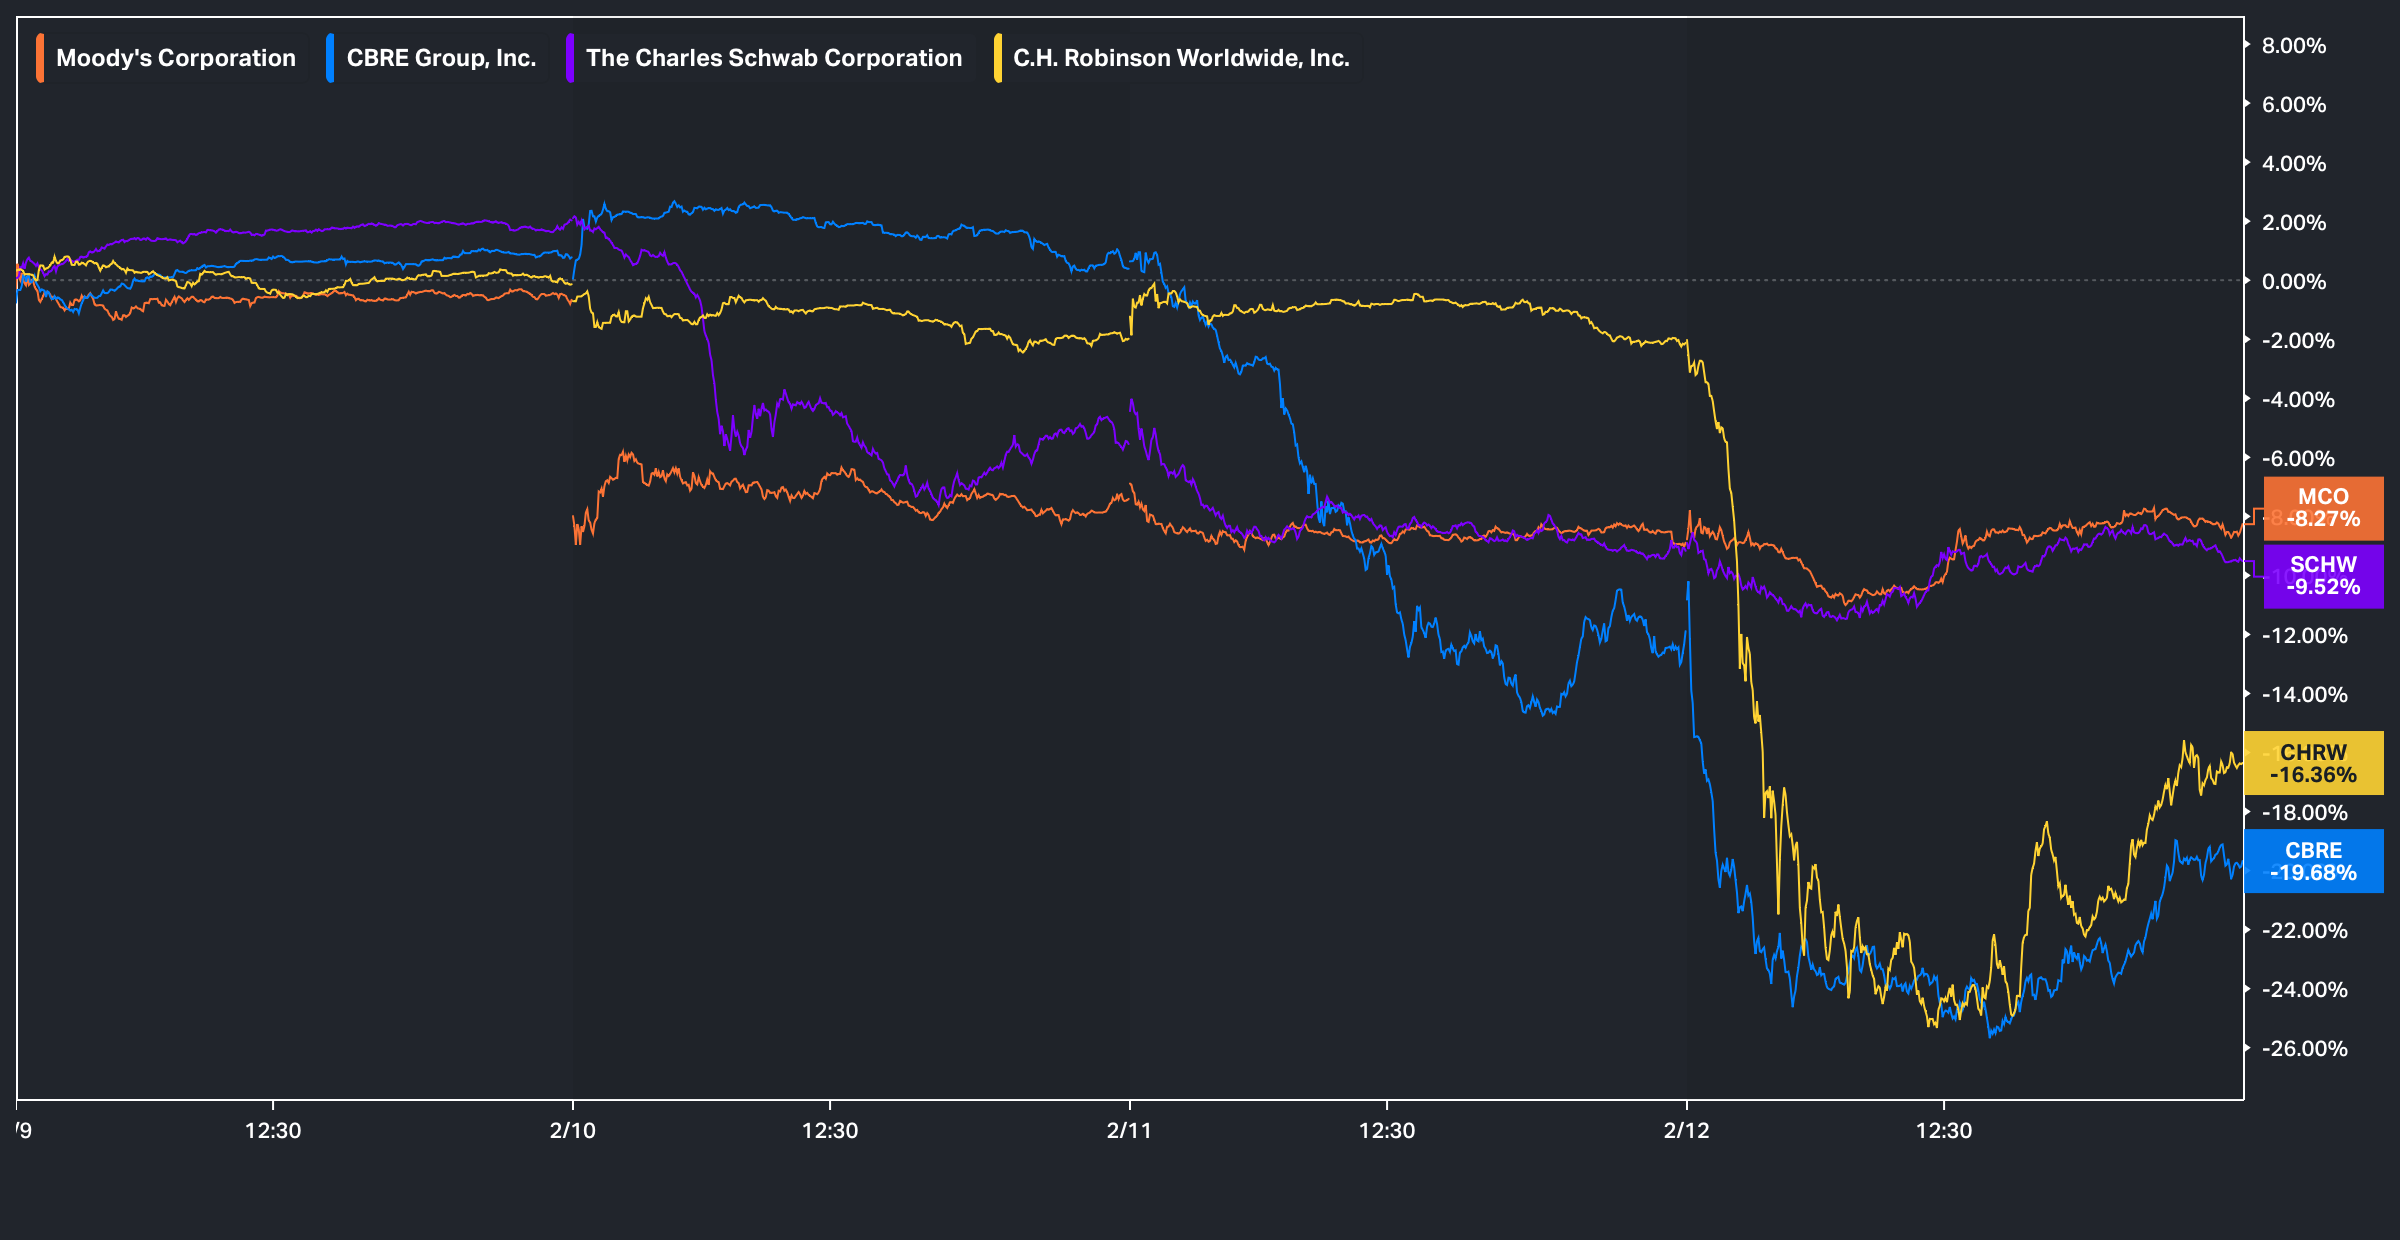
Before we jump into the week ahead, looking back at this past week, the continuation of the ‘AI will make everything extinct’ trade continued as all areas unrelated to materials & or the ‘real’ economy were picked off one by one.
Between brokers (SCHW) / Credit rating agencies (MCO) / Commercial real estate services (CBRE) / & lastly, Trucking & Freight (CHRW), quite literally no sector was safe:
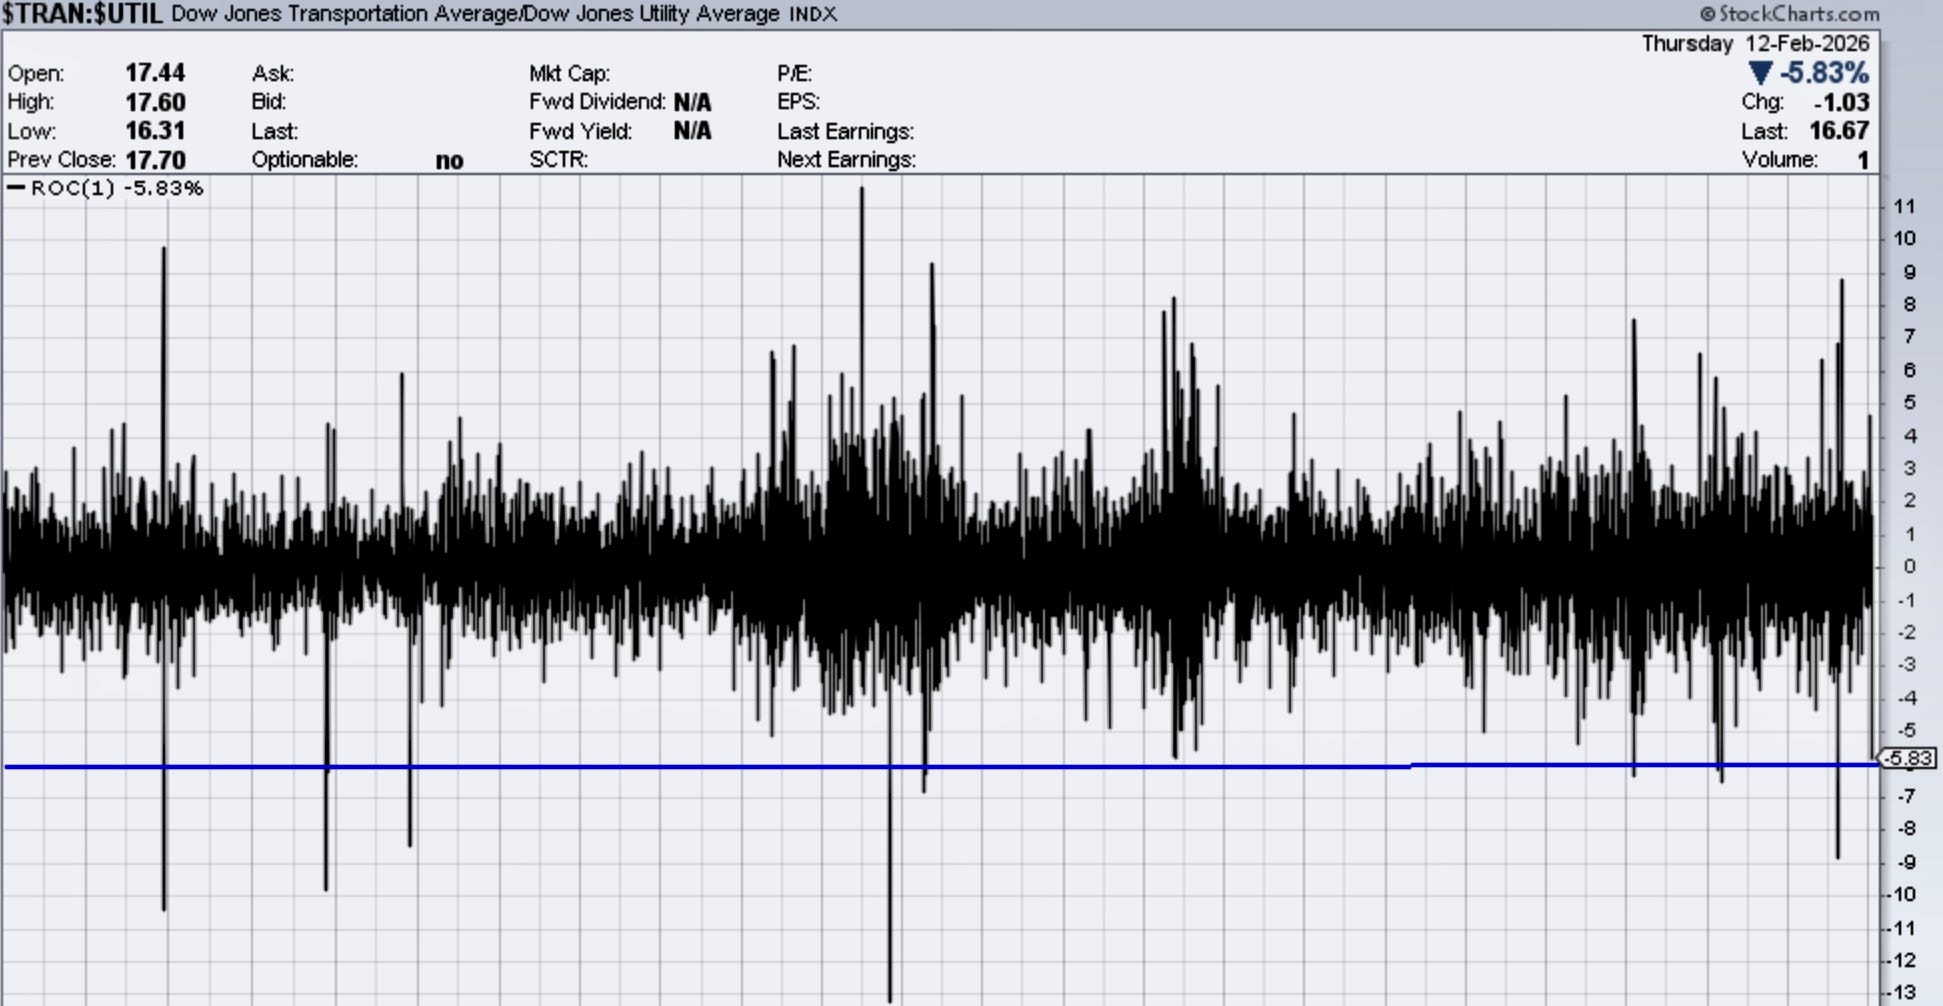
Have we reached the 8-9th inning of the AI-disruption trade? Well, in the latter half of this past week, a former karaoke company (10 million market-cap) recreated itself as an AI-fueled logistics company & unveiled a new platform which caused for billions of dollars loss in market-cap across the sector (Transports) whilst also having caused one of the worst historic spreads between Transports & Utilities in history:
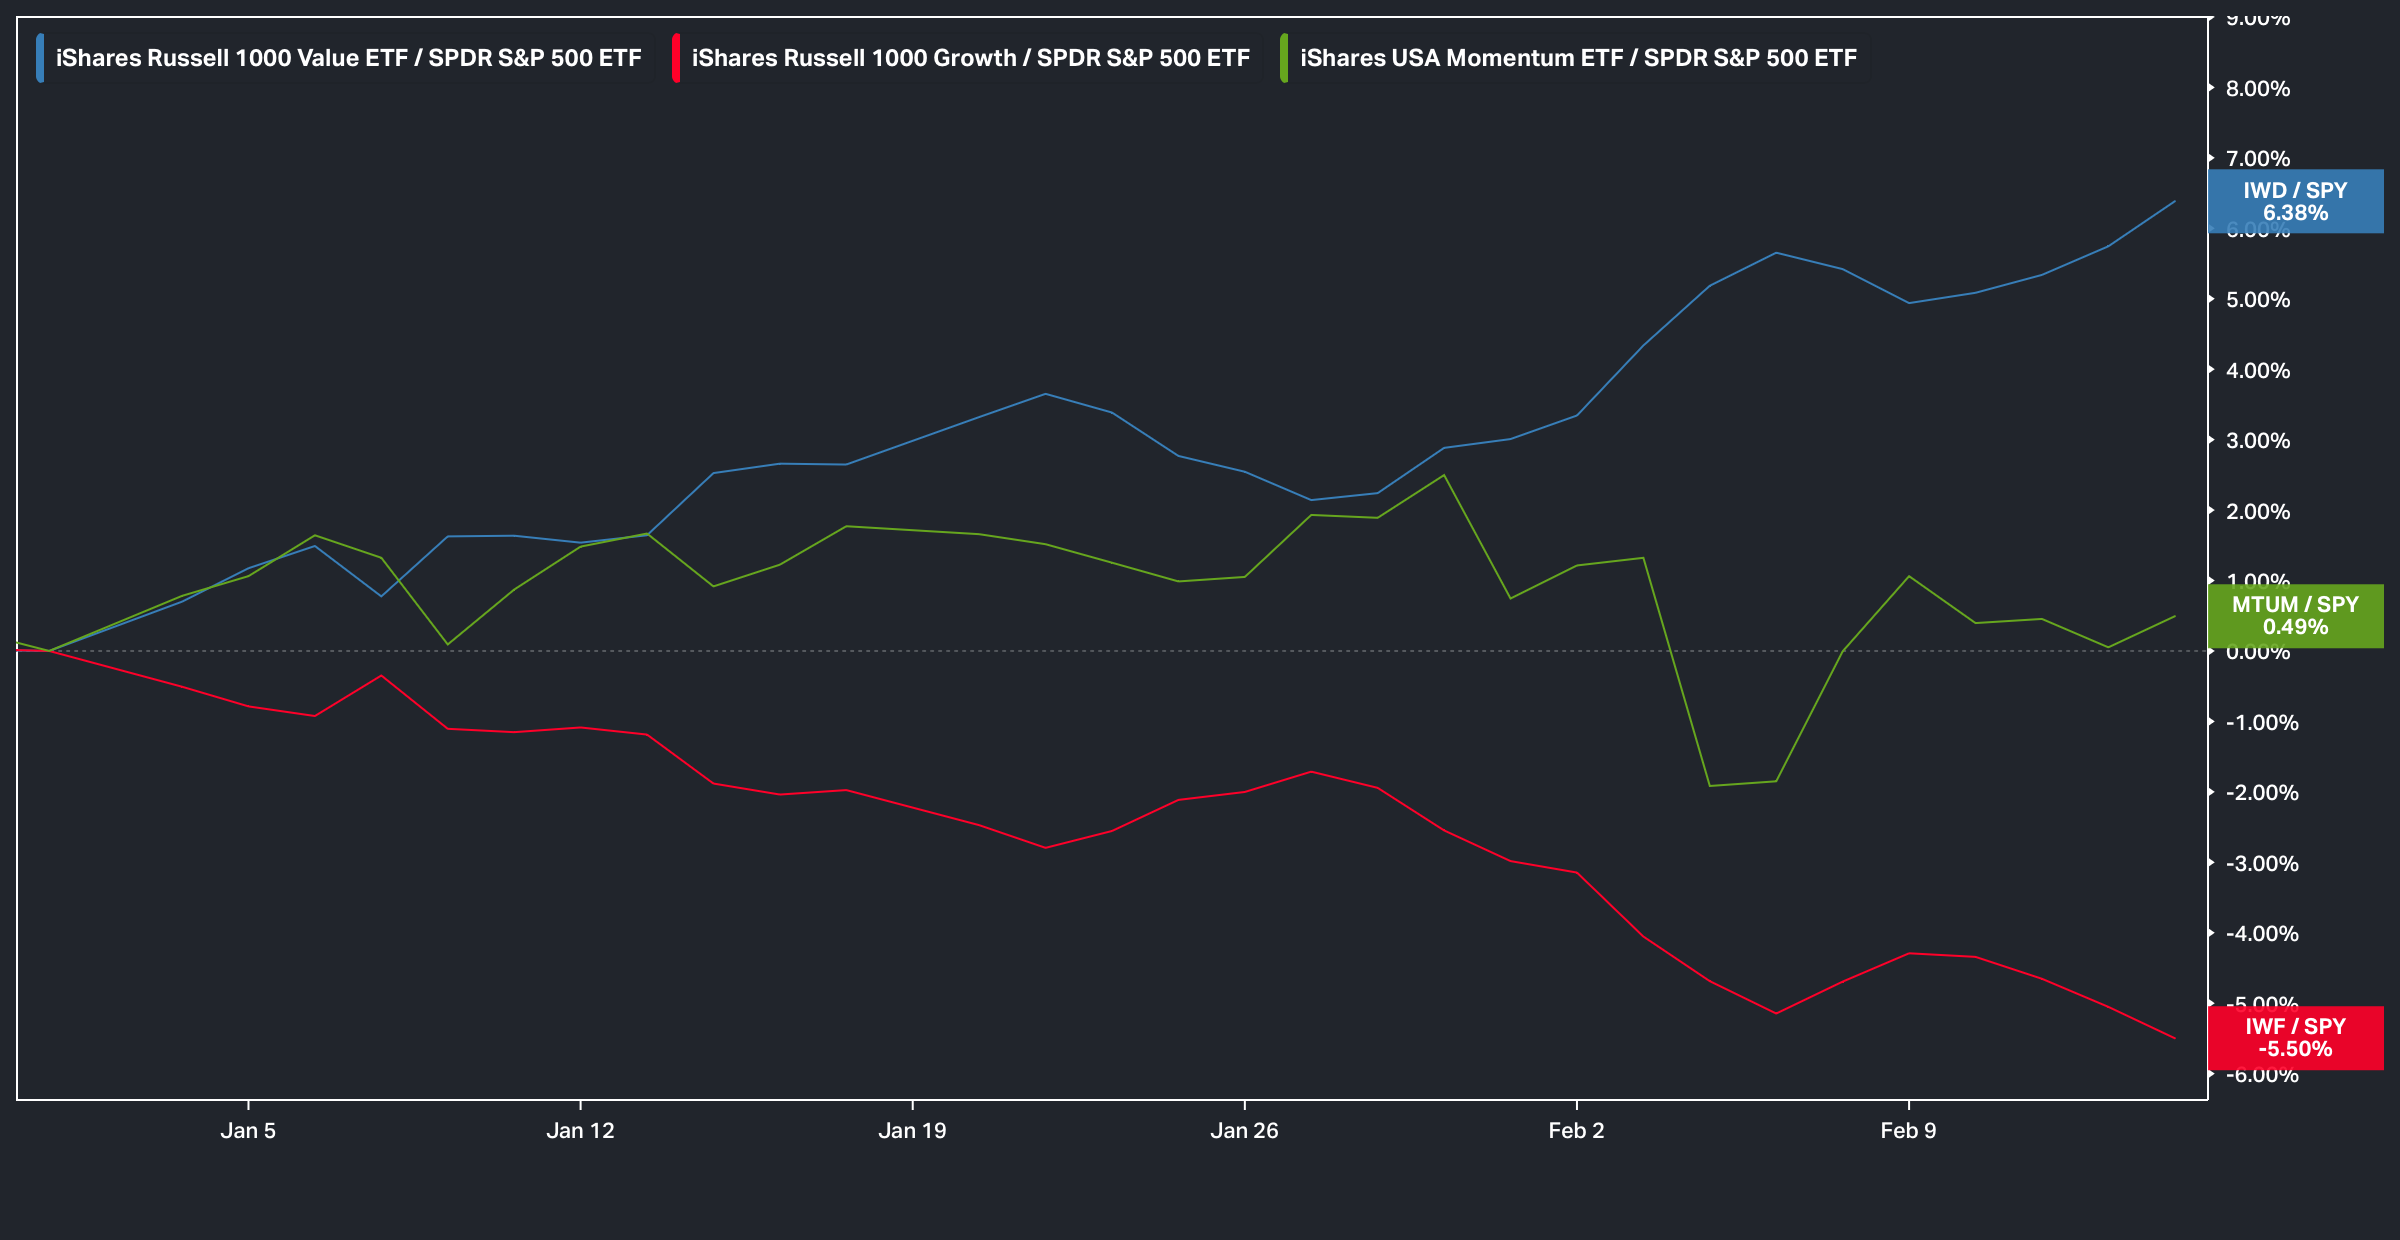
And with the AI-disruption trade being in the forefront of the market’s focus, the rotation toward Value over Growth remained & the gap between the group has now widened to nearly 12% on the year:
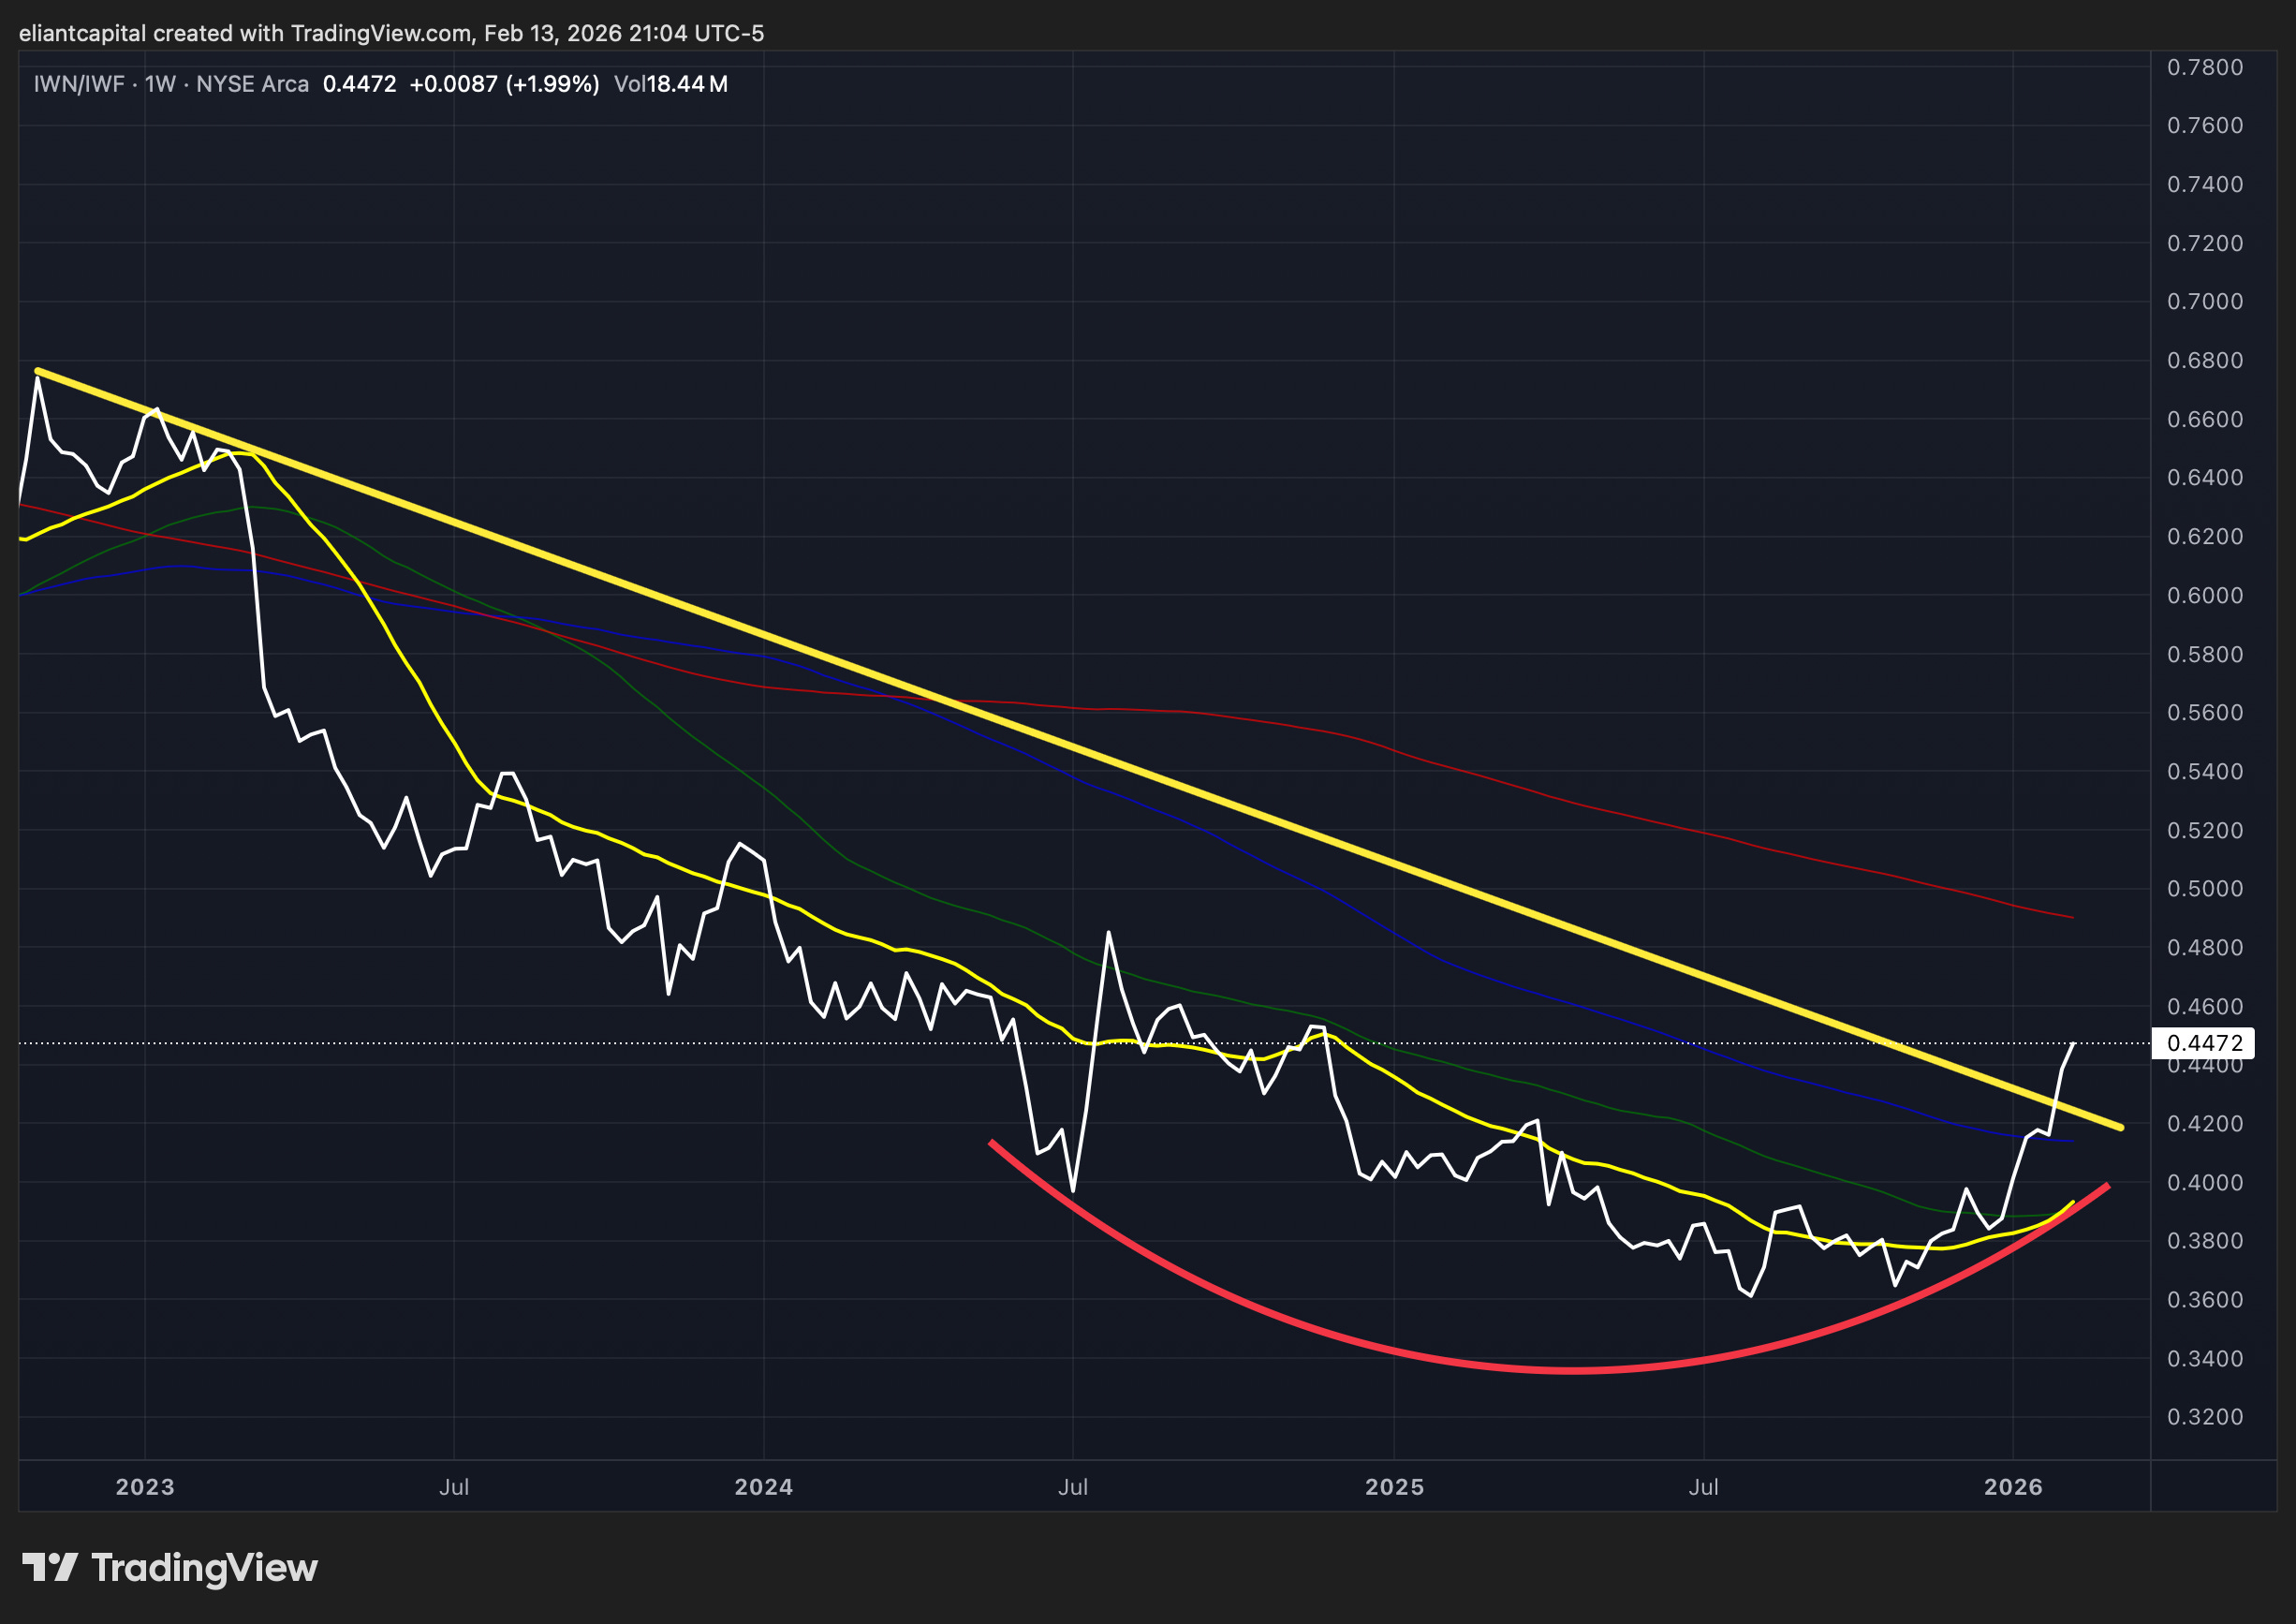
With that being said, given the large YTD outperformance of Value over Growth (12%), the growing question into the coming months boils down to whether or not this recent trend is a lasting one (IWN/IWF Breakout) & or if it instead proves to be another ‘fakeout’ as its done so in prior instances:
And again, in terms of why this period of Value over Growth outperformance has amplified more recently?
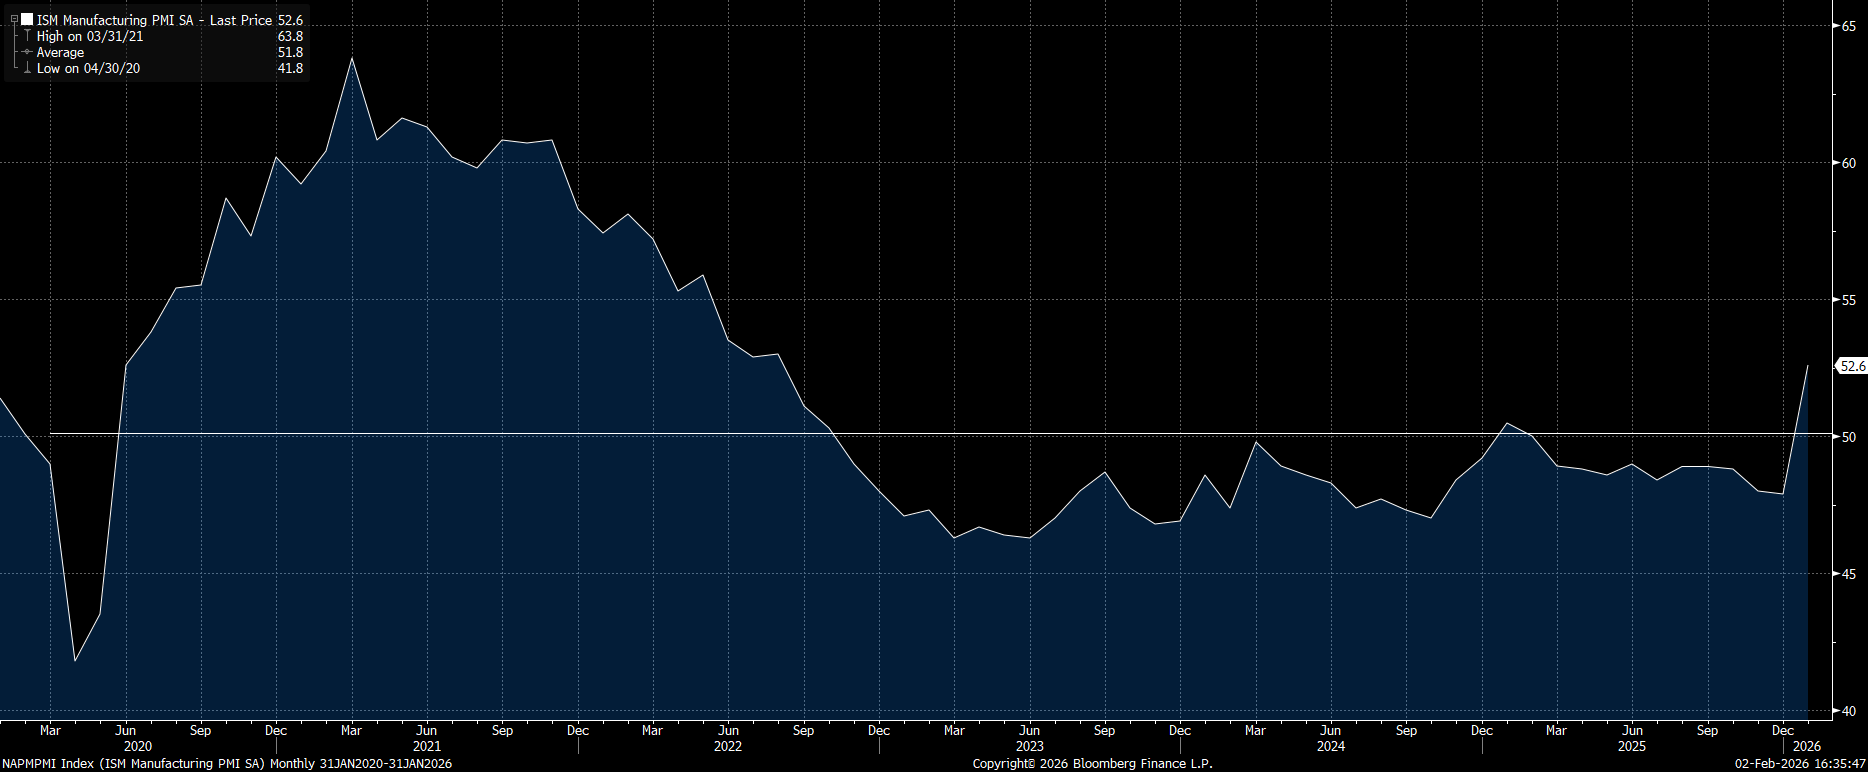
Well, the markets are pricing-in an ongoing economic re-acceleration.
The prior week to this past week for instance, the ISM Manufacturing Index jumped to 52.6 which essentially is the highest level reached since January ’22:
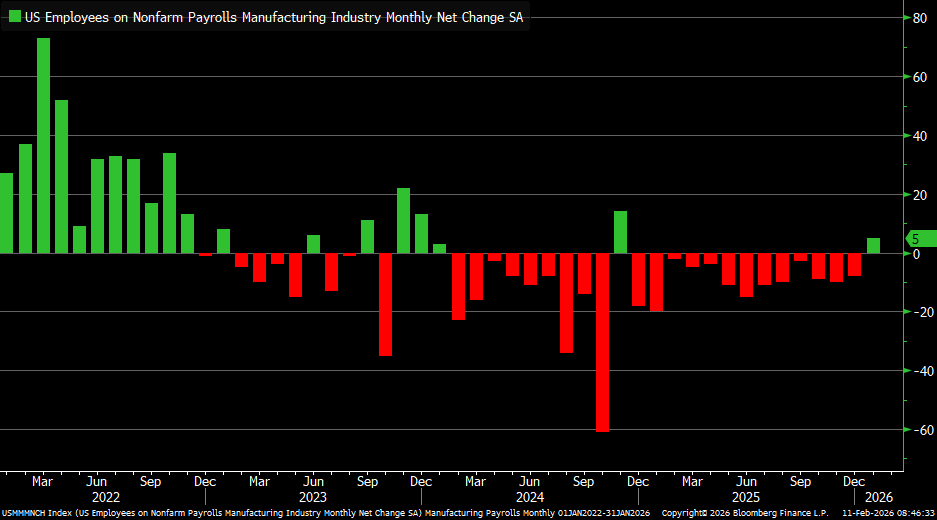
Moving along, looking back at this past week, Manufacturing Payrolls posted their first gain since November ‘24:
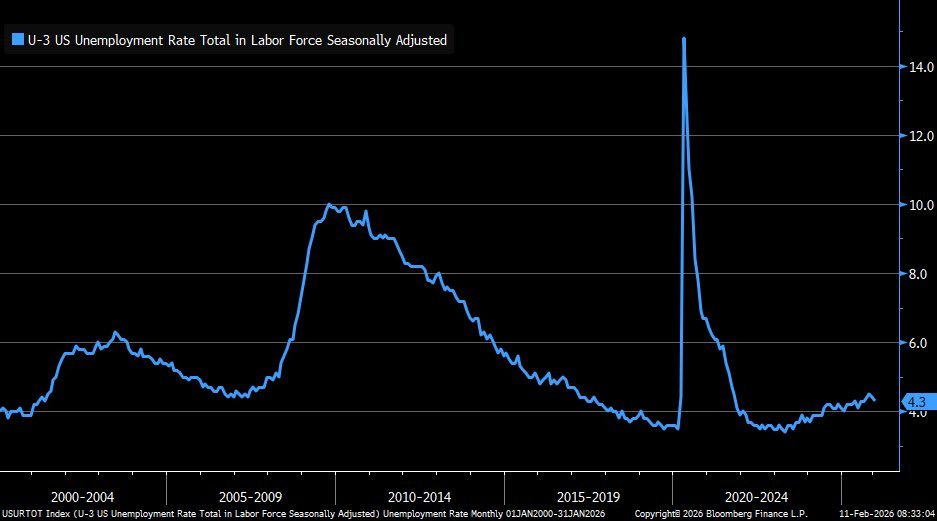
And in regard to the January Nonfarm Payrolls report, jobs came in at 130K vs. 65K expected, alongside an unemployment rate of 4.3% vs. 4.4% expected. Again, the beat reinforces that after a brief wobble in ‘25, the labor market is stabilizing rather than continuing to undergo a slowdown hence the continued pricing-in of an economic re-acceleration:
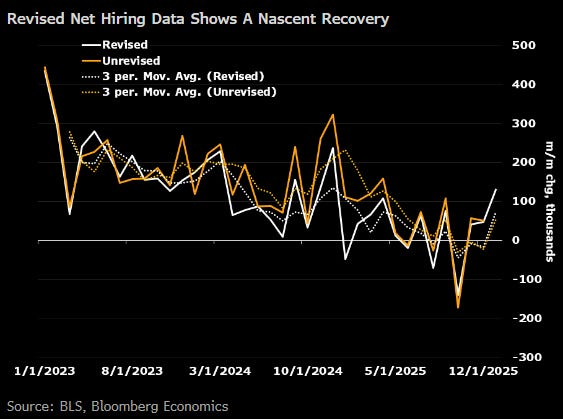
And lastly, the chart below emphasizes the point that the recent labor market / economic re-acceleration has really just started after coming out of the late ‘25 Q4 slowdown mostly driven by the government shutdown:
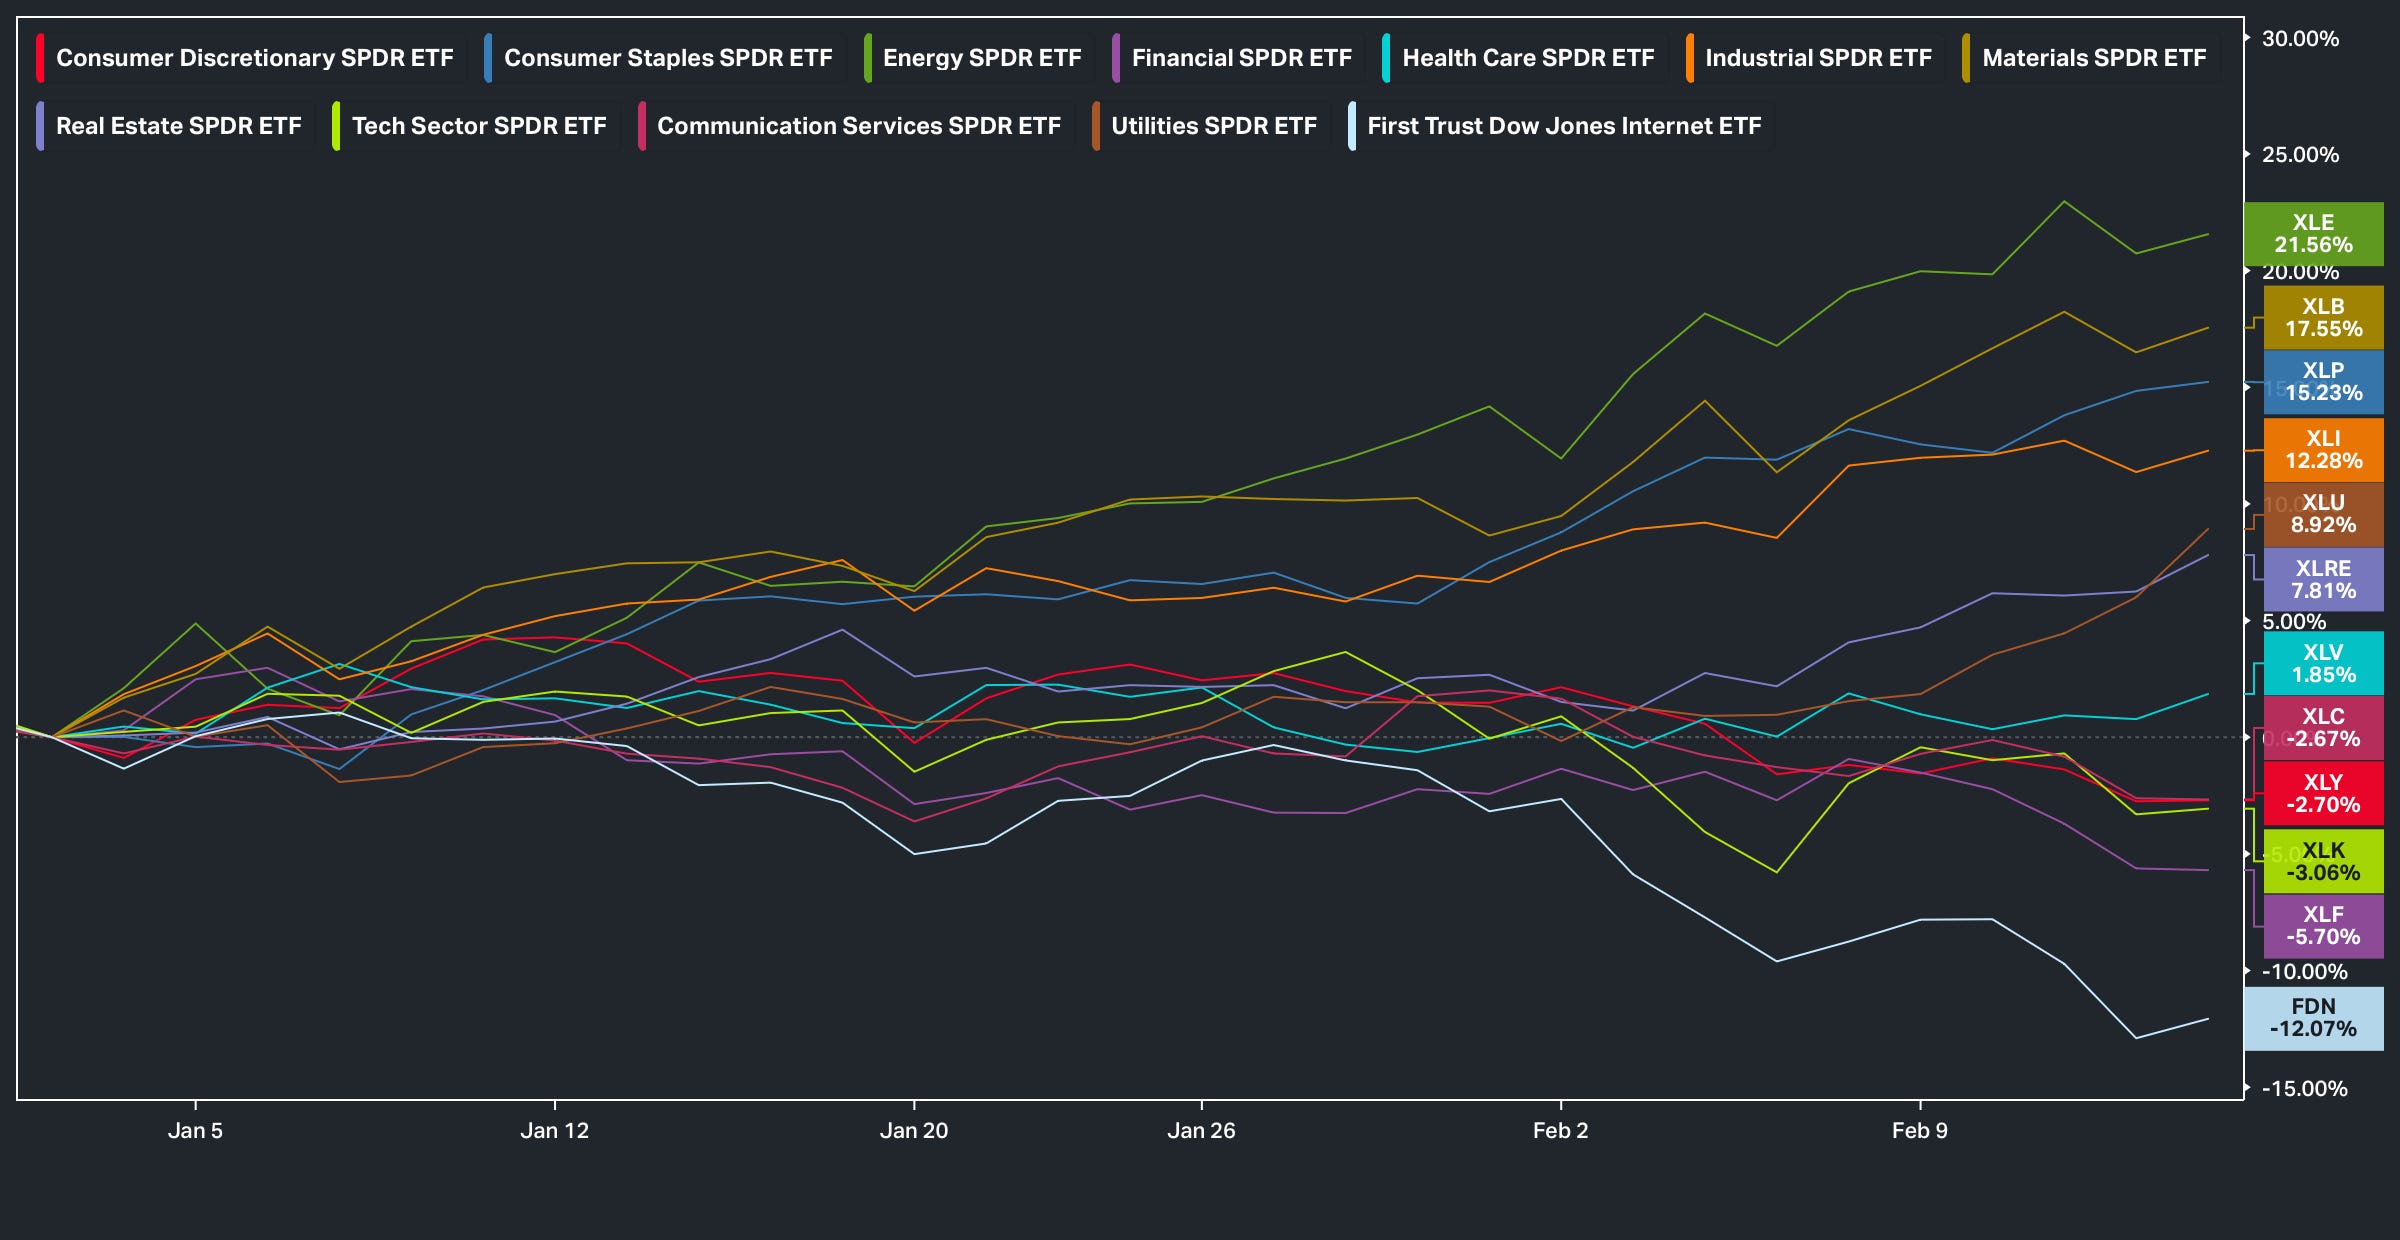
And as we’ve touched on these last few weeks but in regard to the pricing-in of an economic re-acceleration, of the 5 best performing sectors YTD, 3 of them are Cyclical (Was 4 prior but the recent rally in bonds has fueled outperformance amongst Utes thus taking the #5 spot):
- Energy (Cyclical)
- Materials (Cyclical)
- Staples (Defensive)
- Industrials (Cyclical)
- Utilities (Defensive)
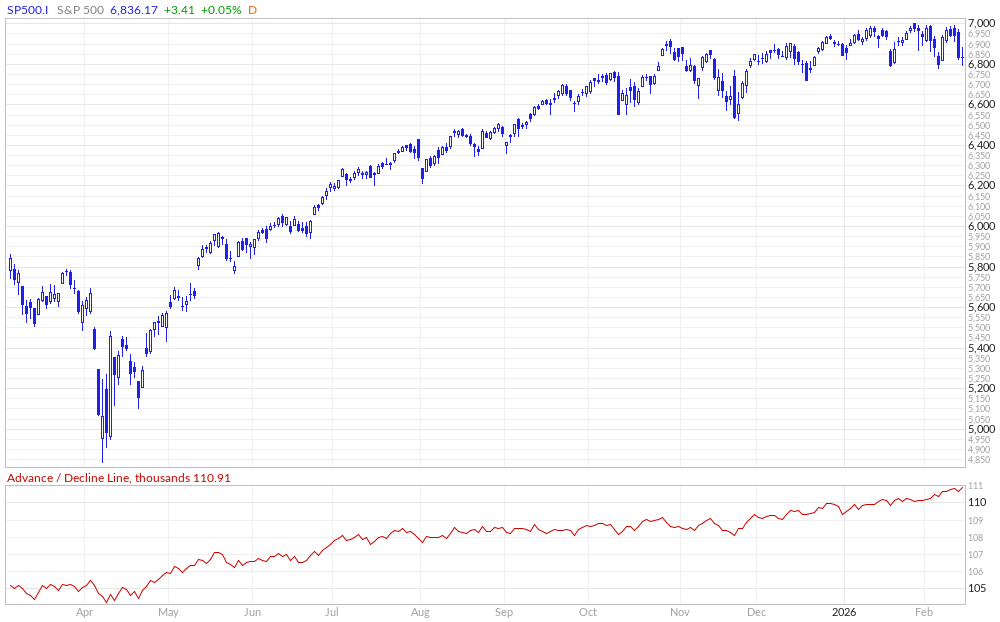
And as a result, it’s led to quite the broadening of upside participation as despite Spooz being just over 230bps off the highs, the Advance-Decline Line has continued to churn and make higher-highs:
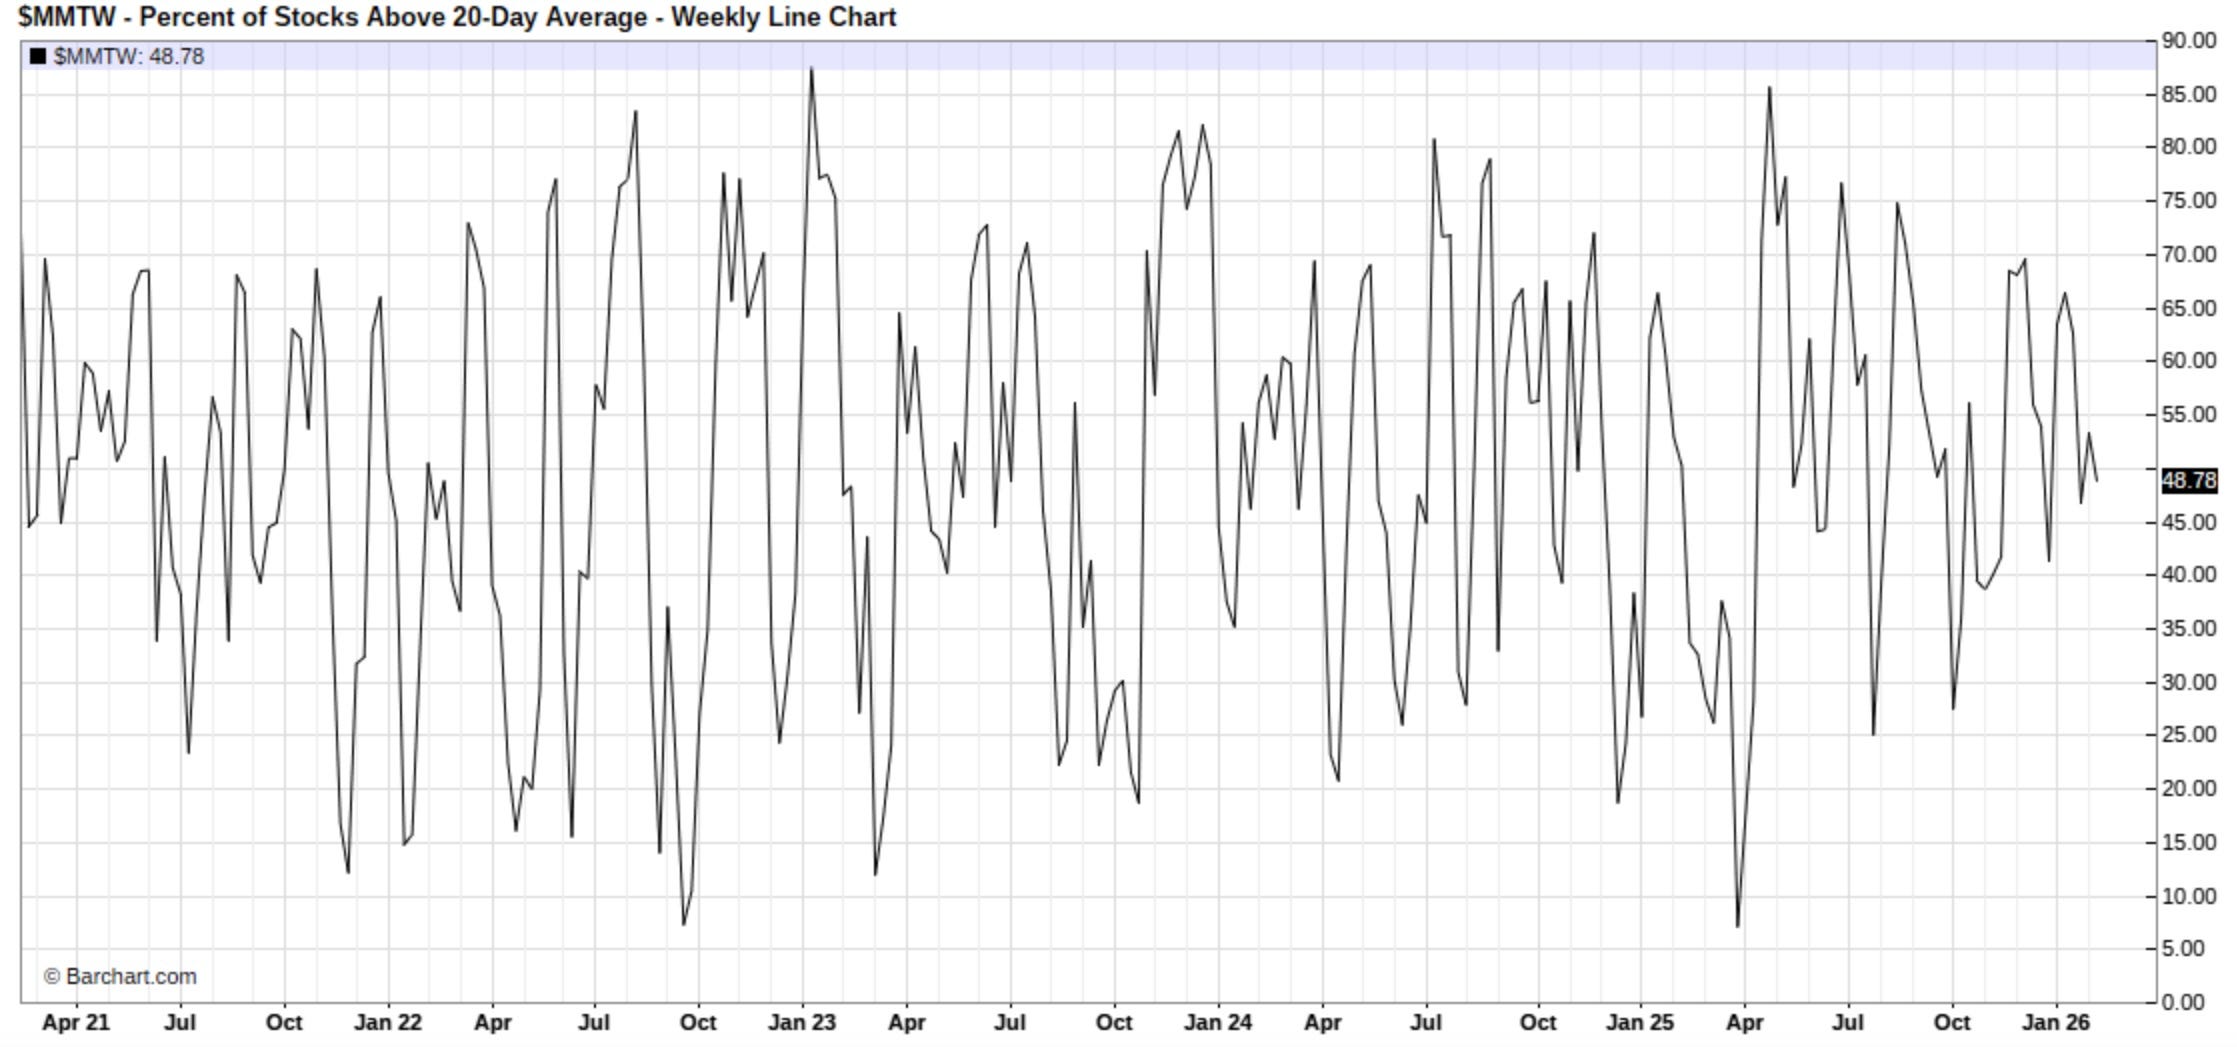
With that being said, despite the broadening of upside participation along with the continued higher-highs within the Advance-Decline Index, the % of Stocks Above the 20D still remains more neutral (Instead of overbought & or oversold) as it currently sits at 48% which is mostly attributed to the vast single stock volatility:
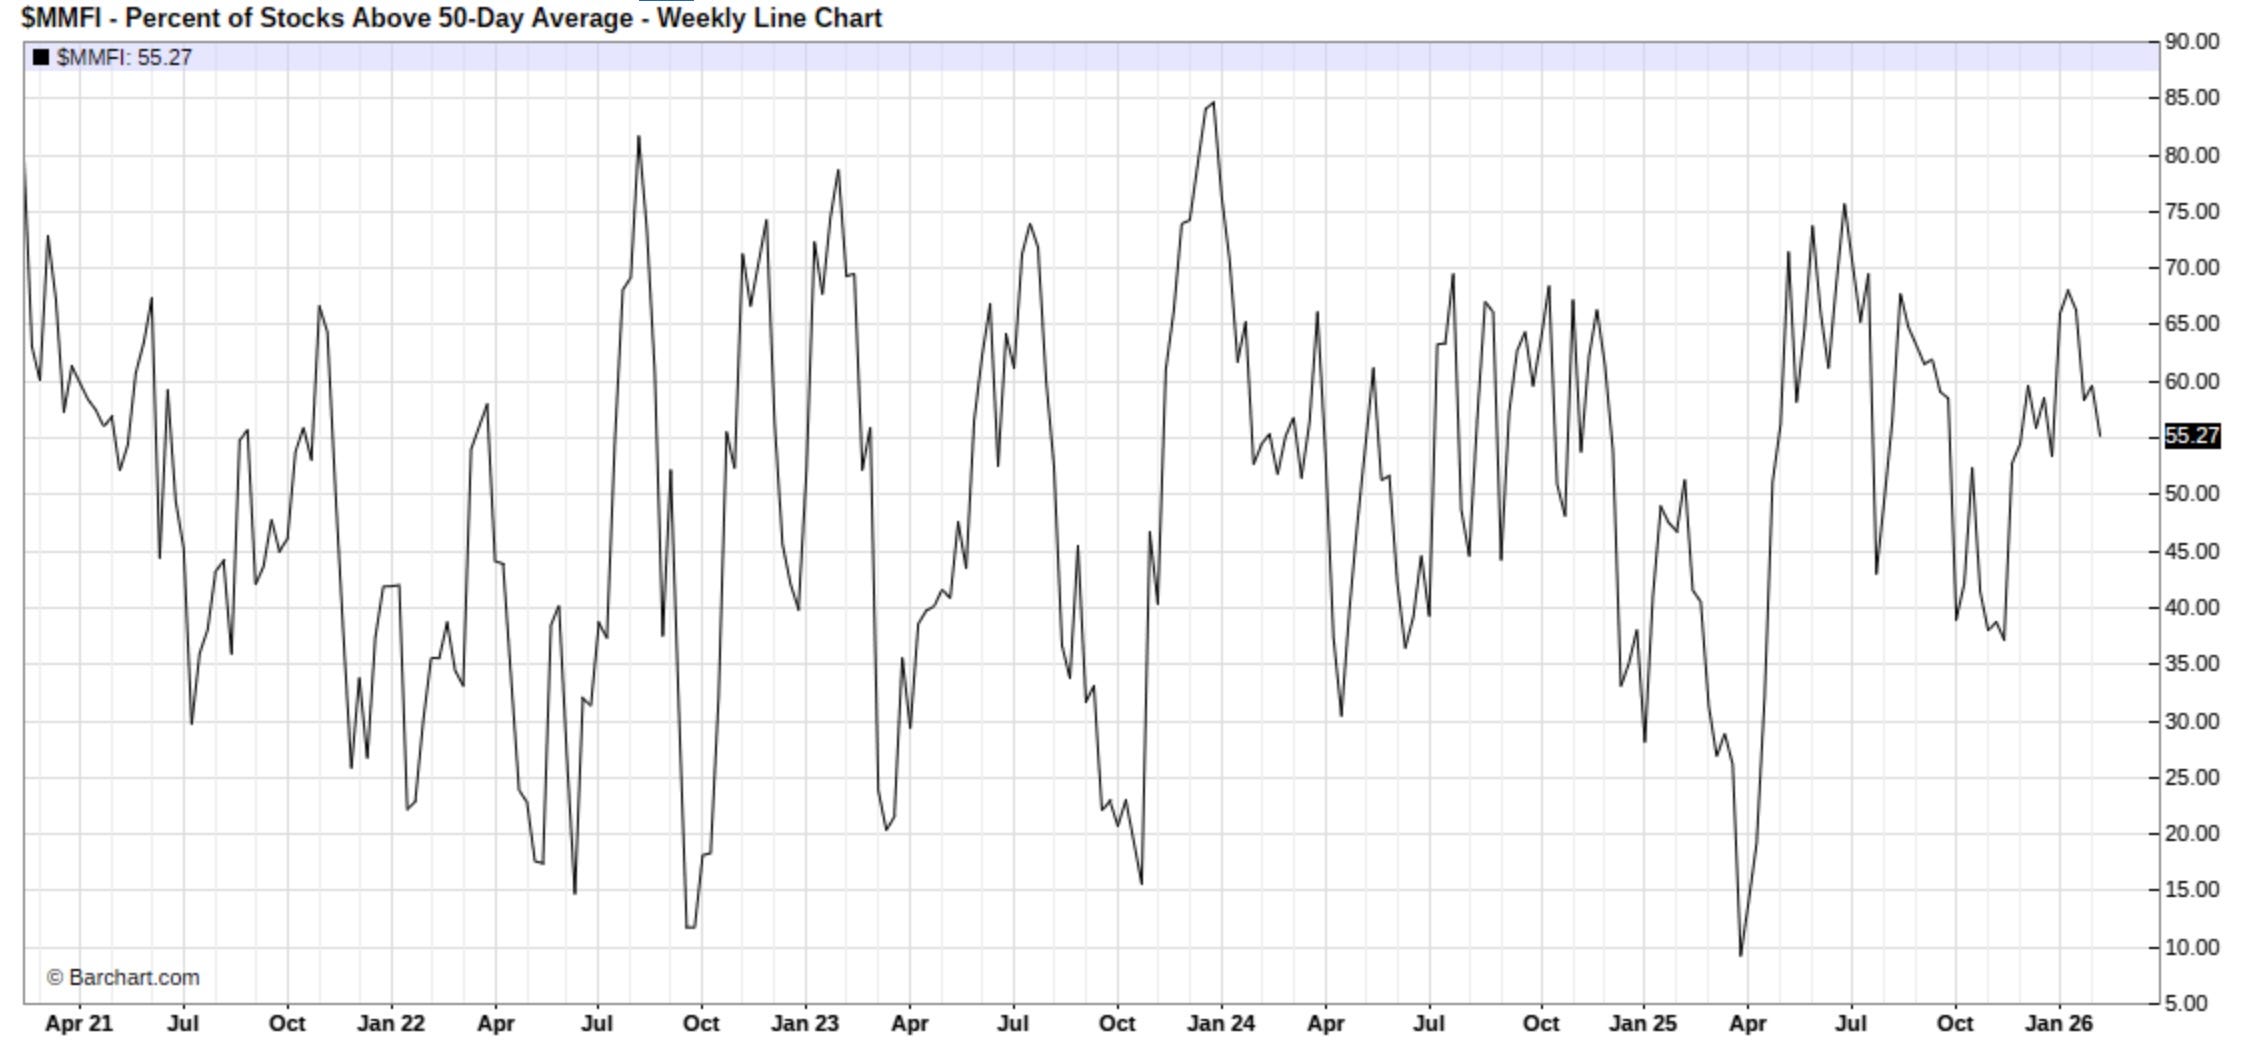
And similar can be said on a more broader timeframe as well as there is still 55% of stocks remaining above the 50D (Neutral Reading) despite the Nasdaq for example remaining below the 100D which just emphasizes the underlying dispersion within the markets:
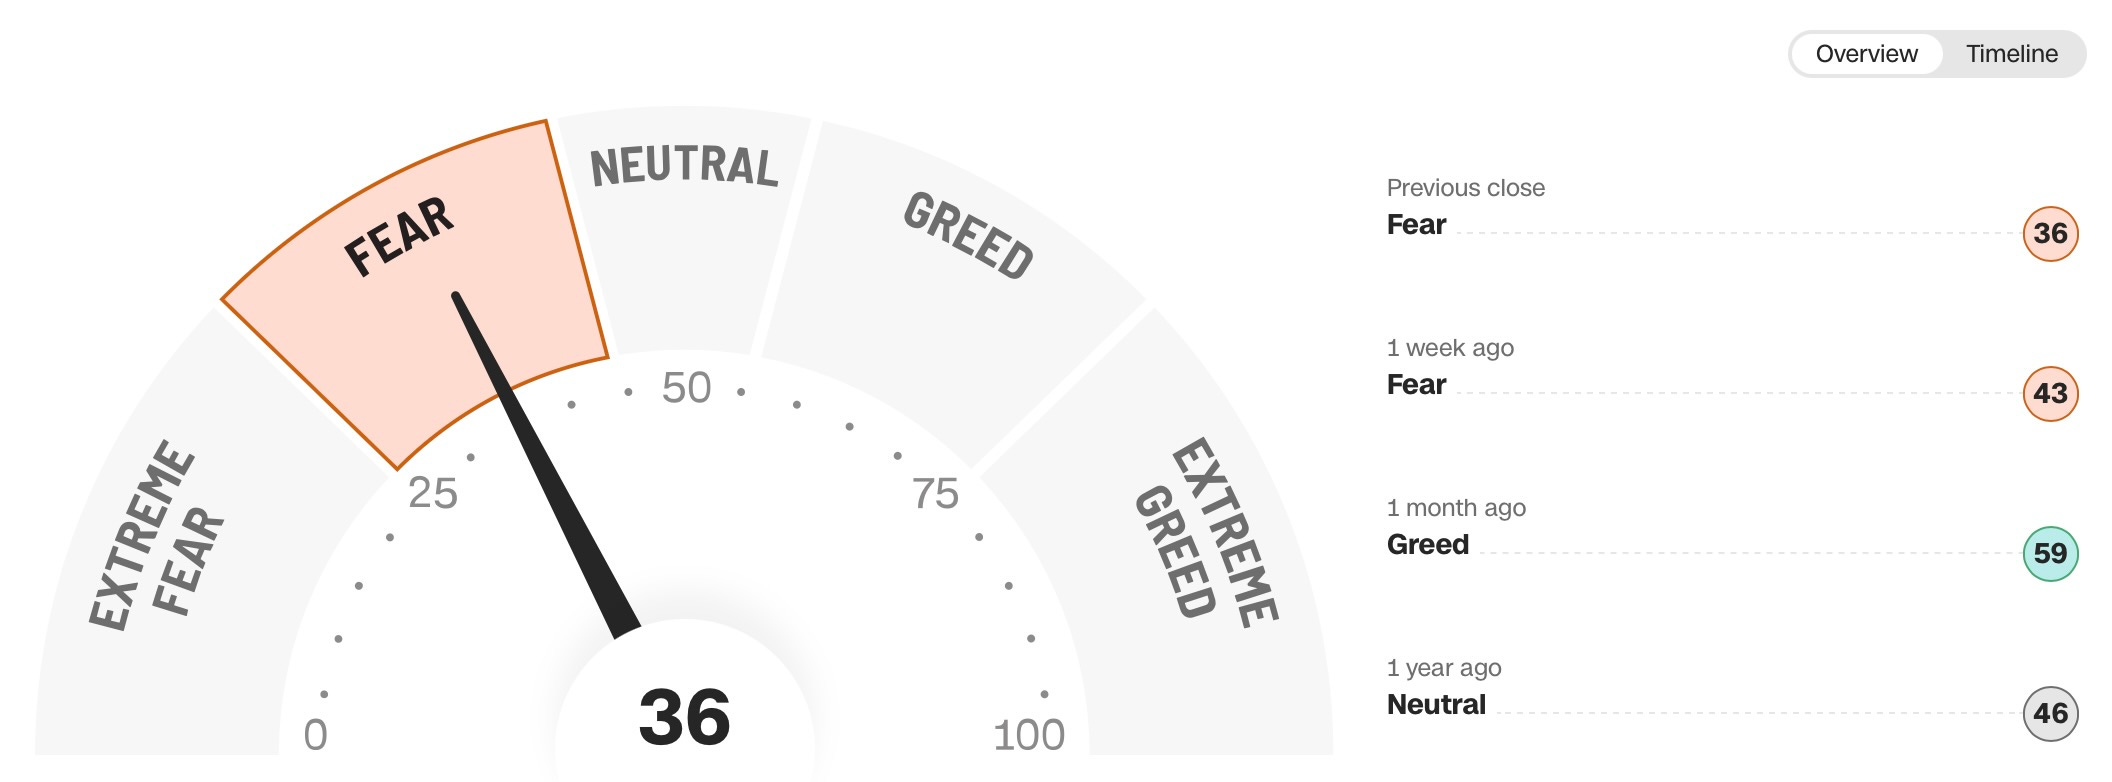
However, the Fear-Greed Index, instead of pointing toward a market that remains within neutral territory, has made its way back into fear territory despite the continued broadening of breadth and new highs within the Advance-Decline Index. This again circles back to the amount of dispersion within the market, along with elevated single-stock volatility, despite the indices sitting near their respective highs. We’ve essentially had Liberation Day–style volatility among single names whilst the indices themselves are hardly off their highs:
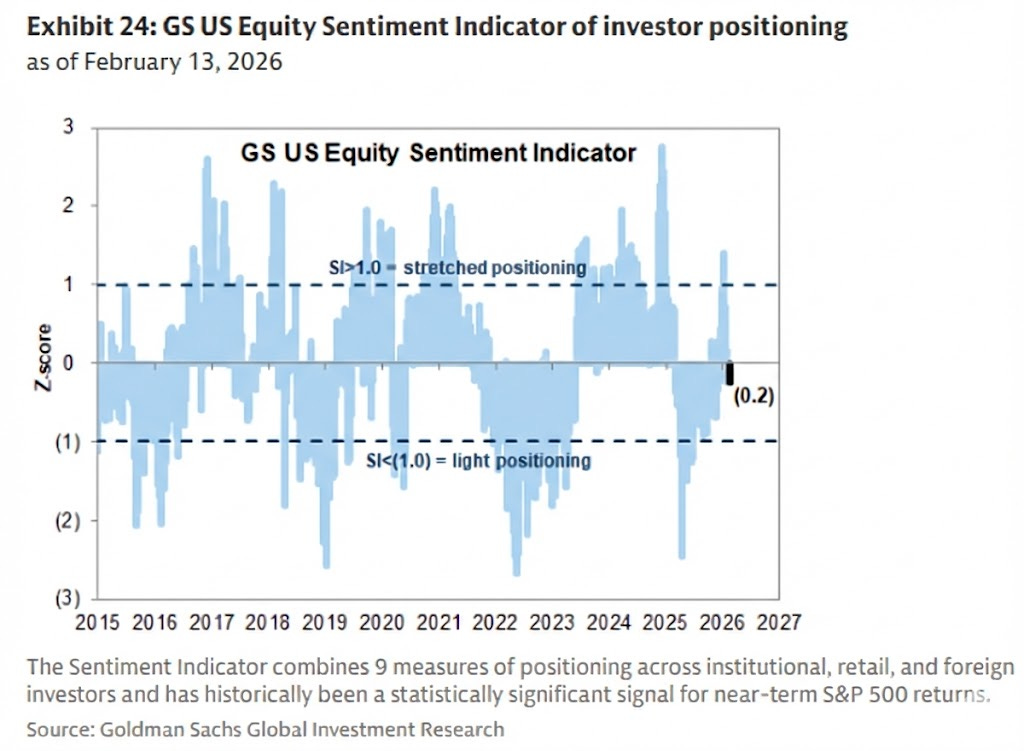
And finally, in respect to positioning, despite Spooz having pulled back only about 2% from all-time highs, Goldman’s U.S. equity sentiment indicator has already slipped back into negative territory. Considering the persistent calls of market exuberance and bubble conditions, sentiment and positioning remain far removed from levels typically associated with true market euphoria.