The Week Ahead 3/1/26

Hello All,
I hope you’re all enjoying the weekend and getting some time away from the screens & wishing you all a successful ‘26 ahead.
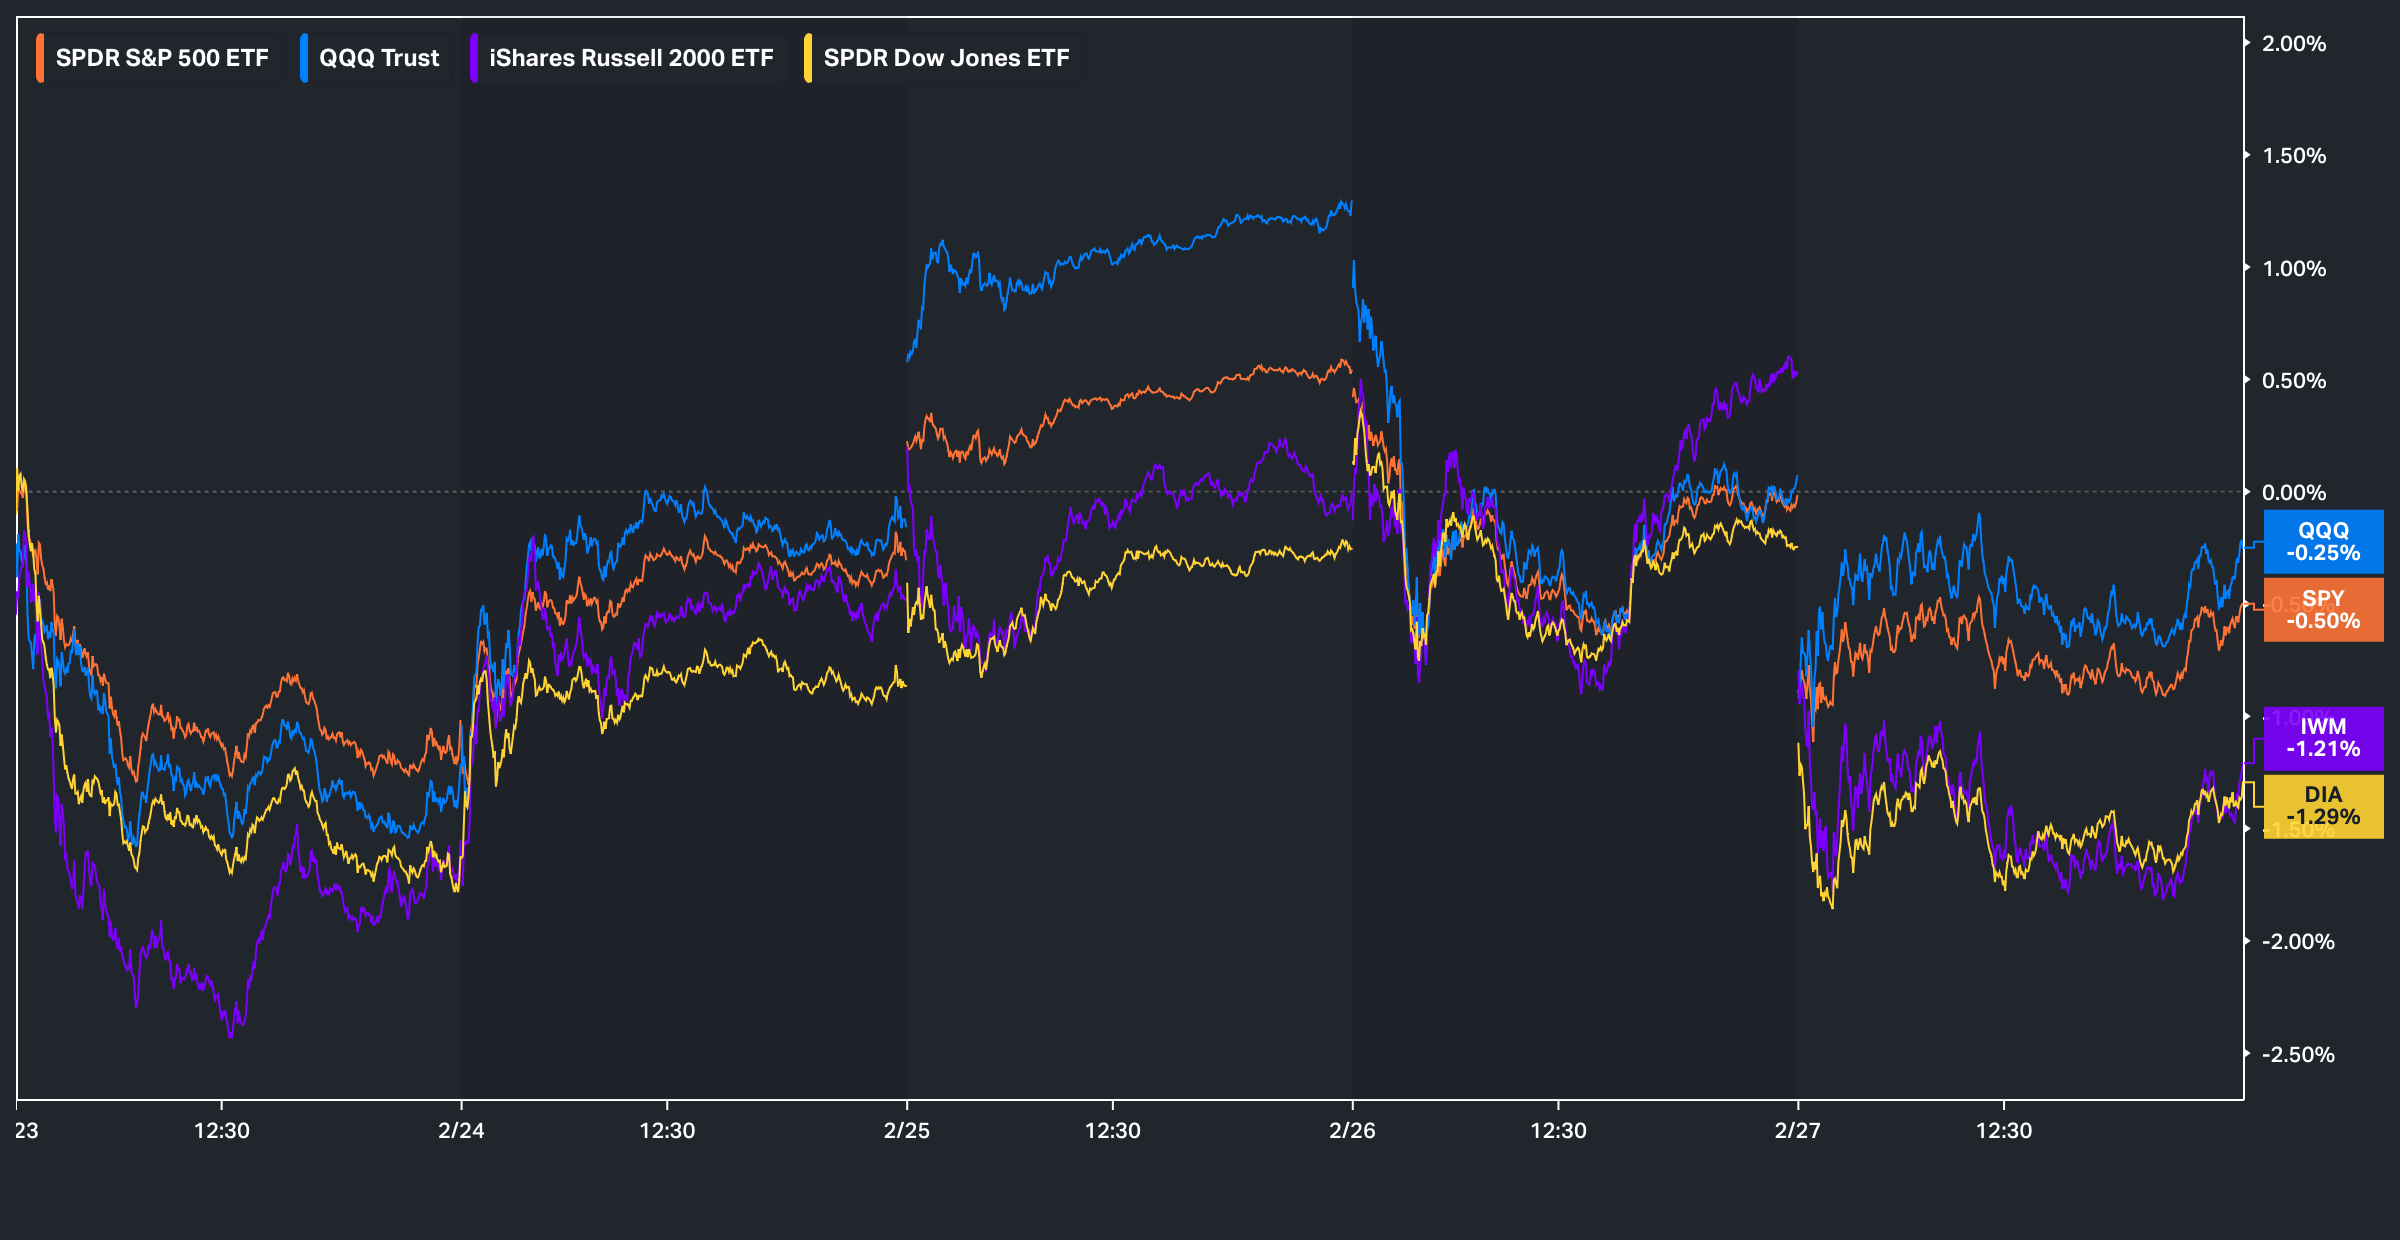
Looking back at this past week, despite continued AI-disruption fears and U.S.-Iran headlines, it ended up being a relatively choppy period, with action remaining concentrated in single stocks (dispersion) even as headline indices appeared relatively tame on the surface.
On the week, to surprise, the Q’s were the ‘best’ performing of the indices, though still closed lower by 25bps, whereas the Dow was the worst performing of the indices, having closed lower by 129bps.
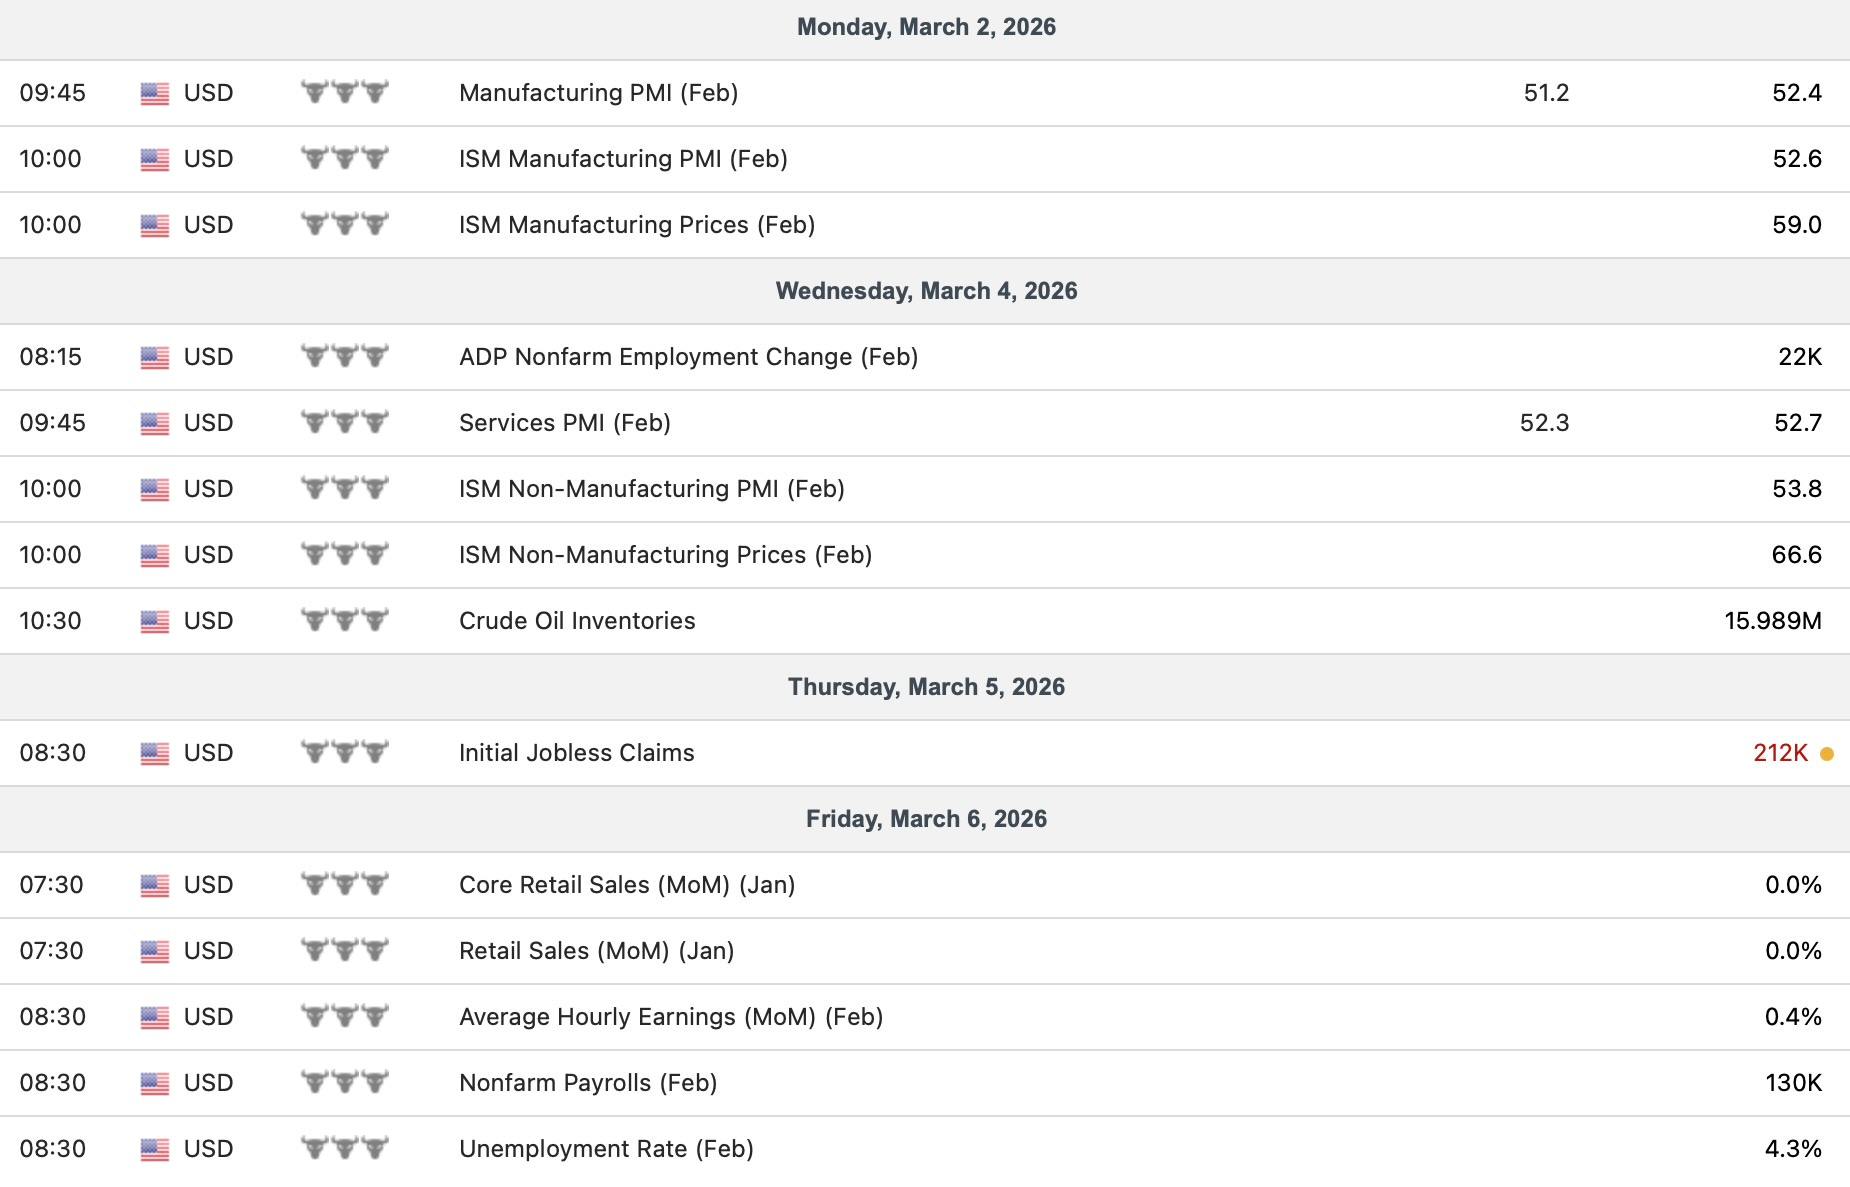
- Economic Data for the Coming Week:
In regard to economic data in the upcoming week, aside from geopolitical developments, the most important datapoint will be Friday’s NFP report. As a reminder, the January jobs report was a blowout, so it will be important to see whether that strength was largely driven by seasonal factors or if the February report reinforces the same underlying momentum. We also have retail sales on Friday, along with a handful of scattered economic datapoints throughout the week too.
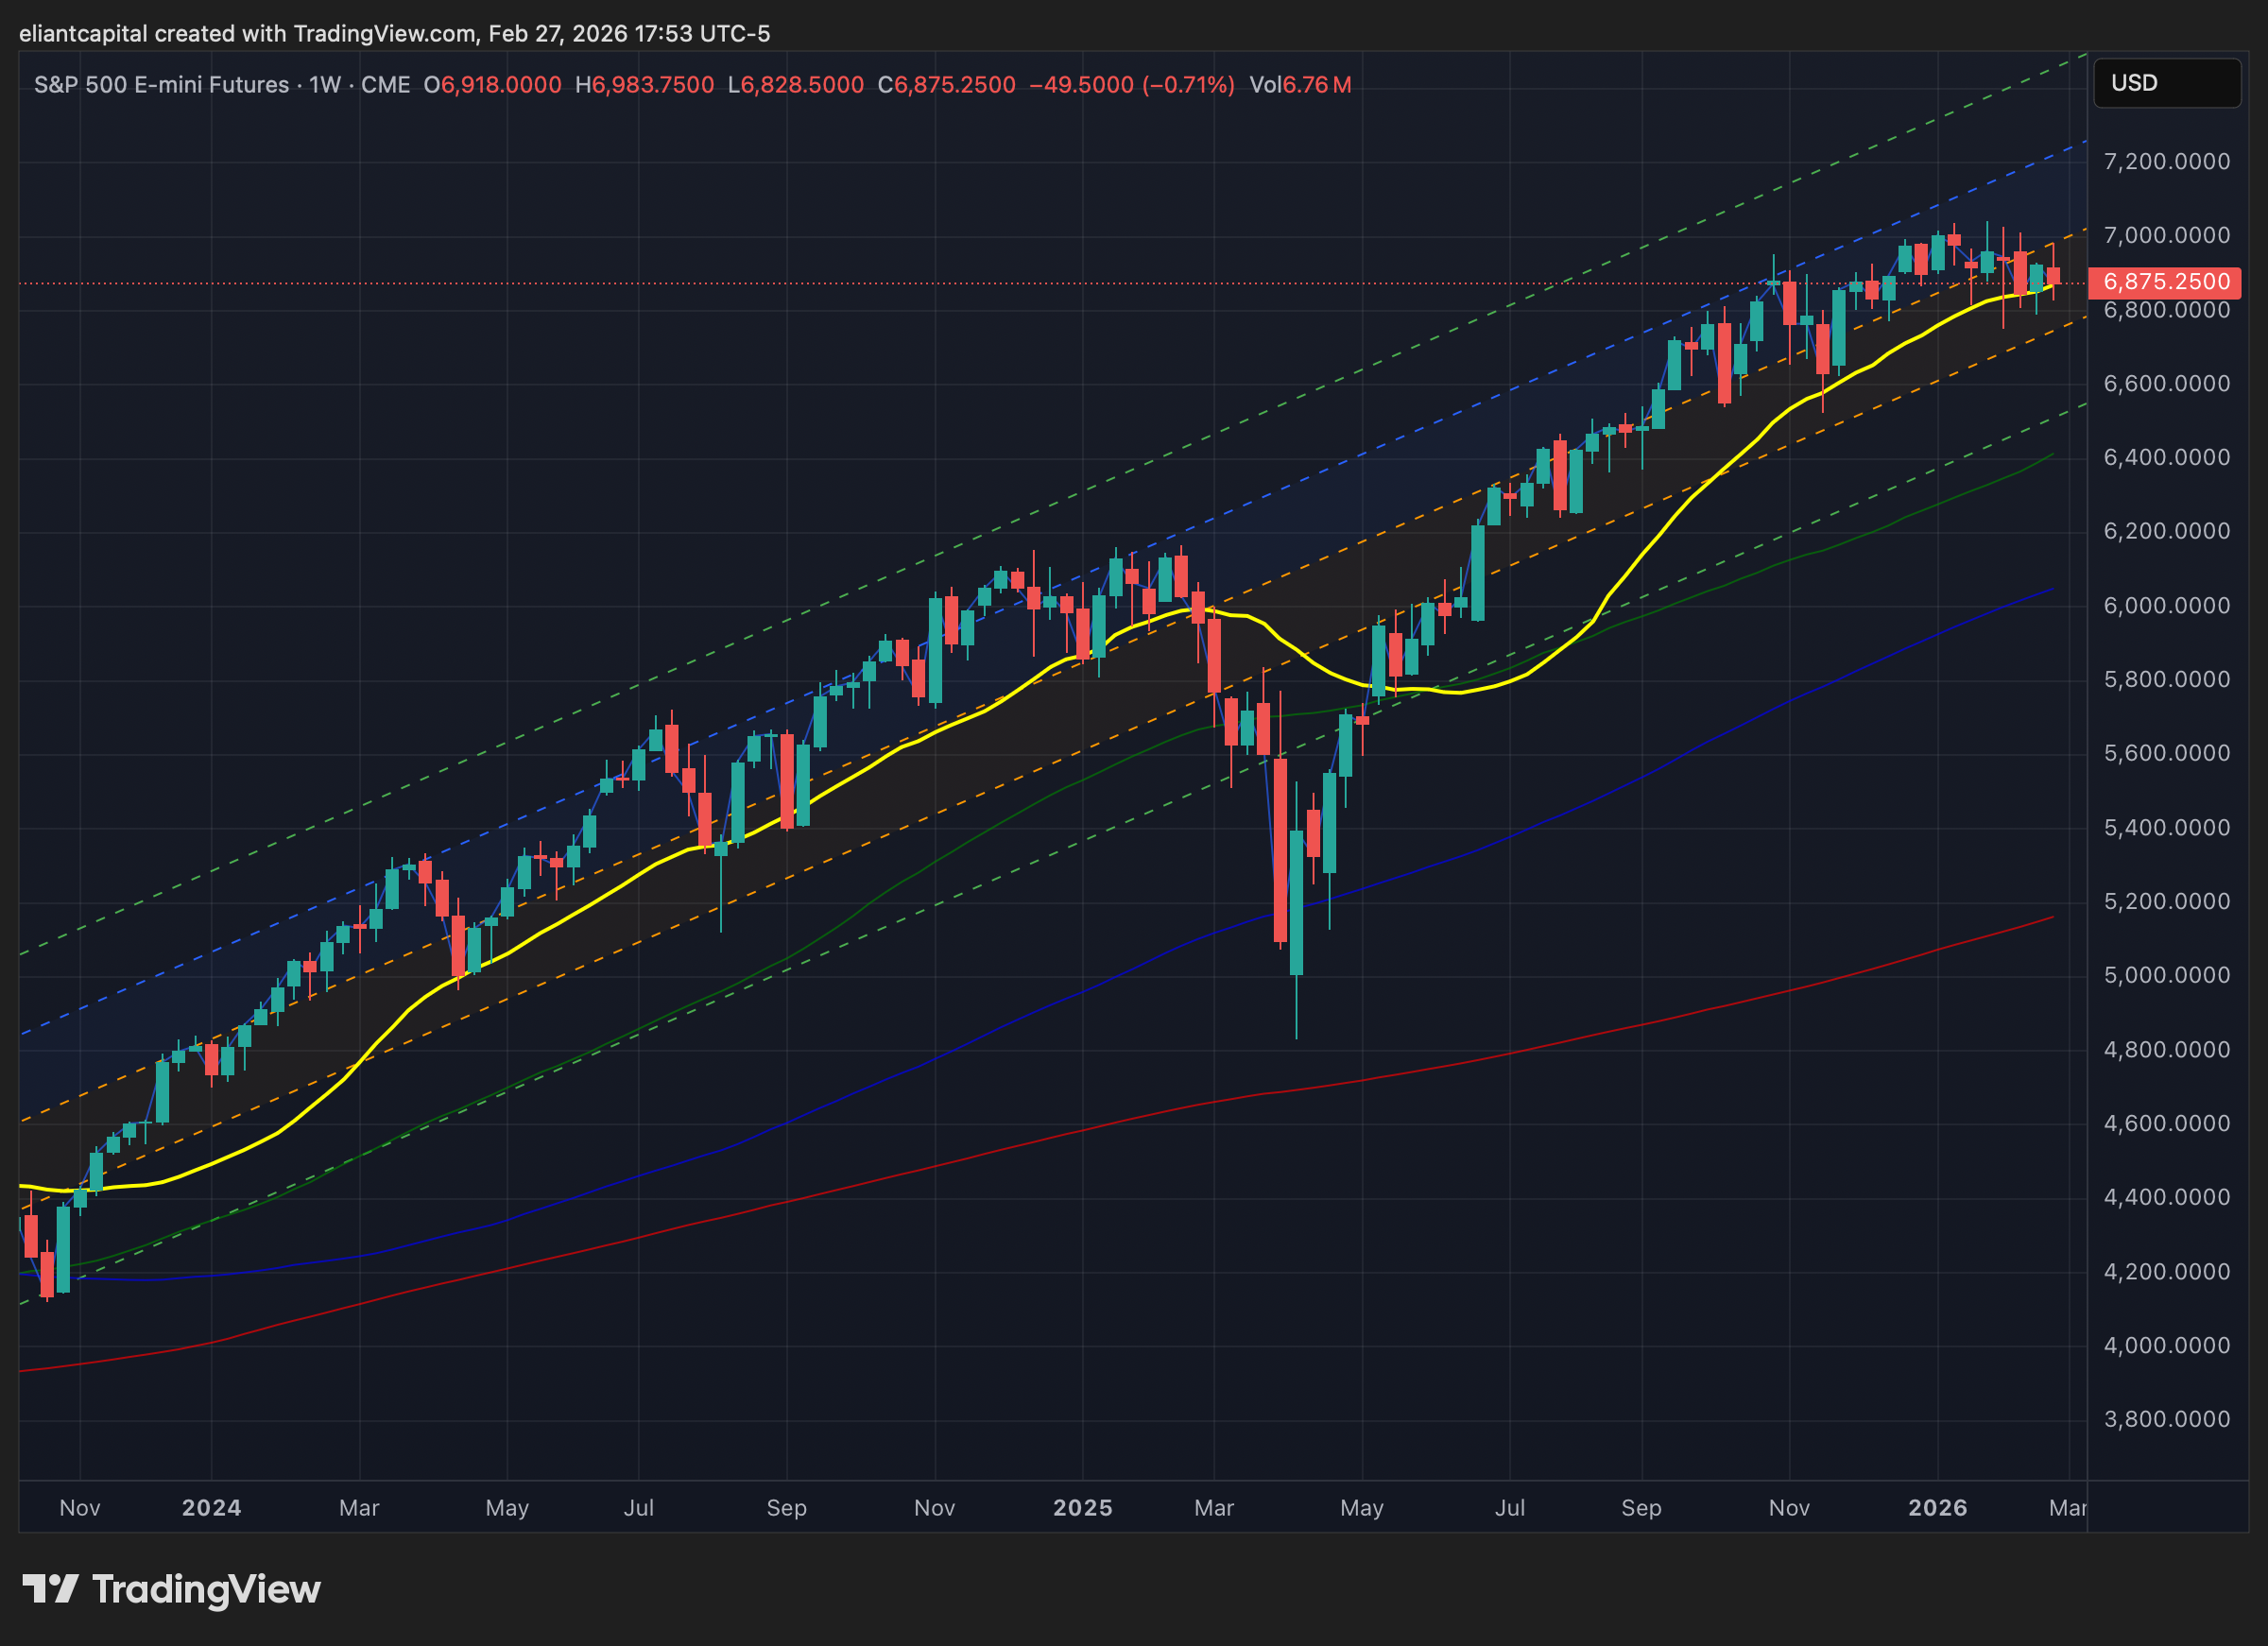
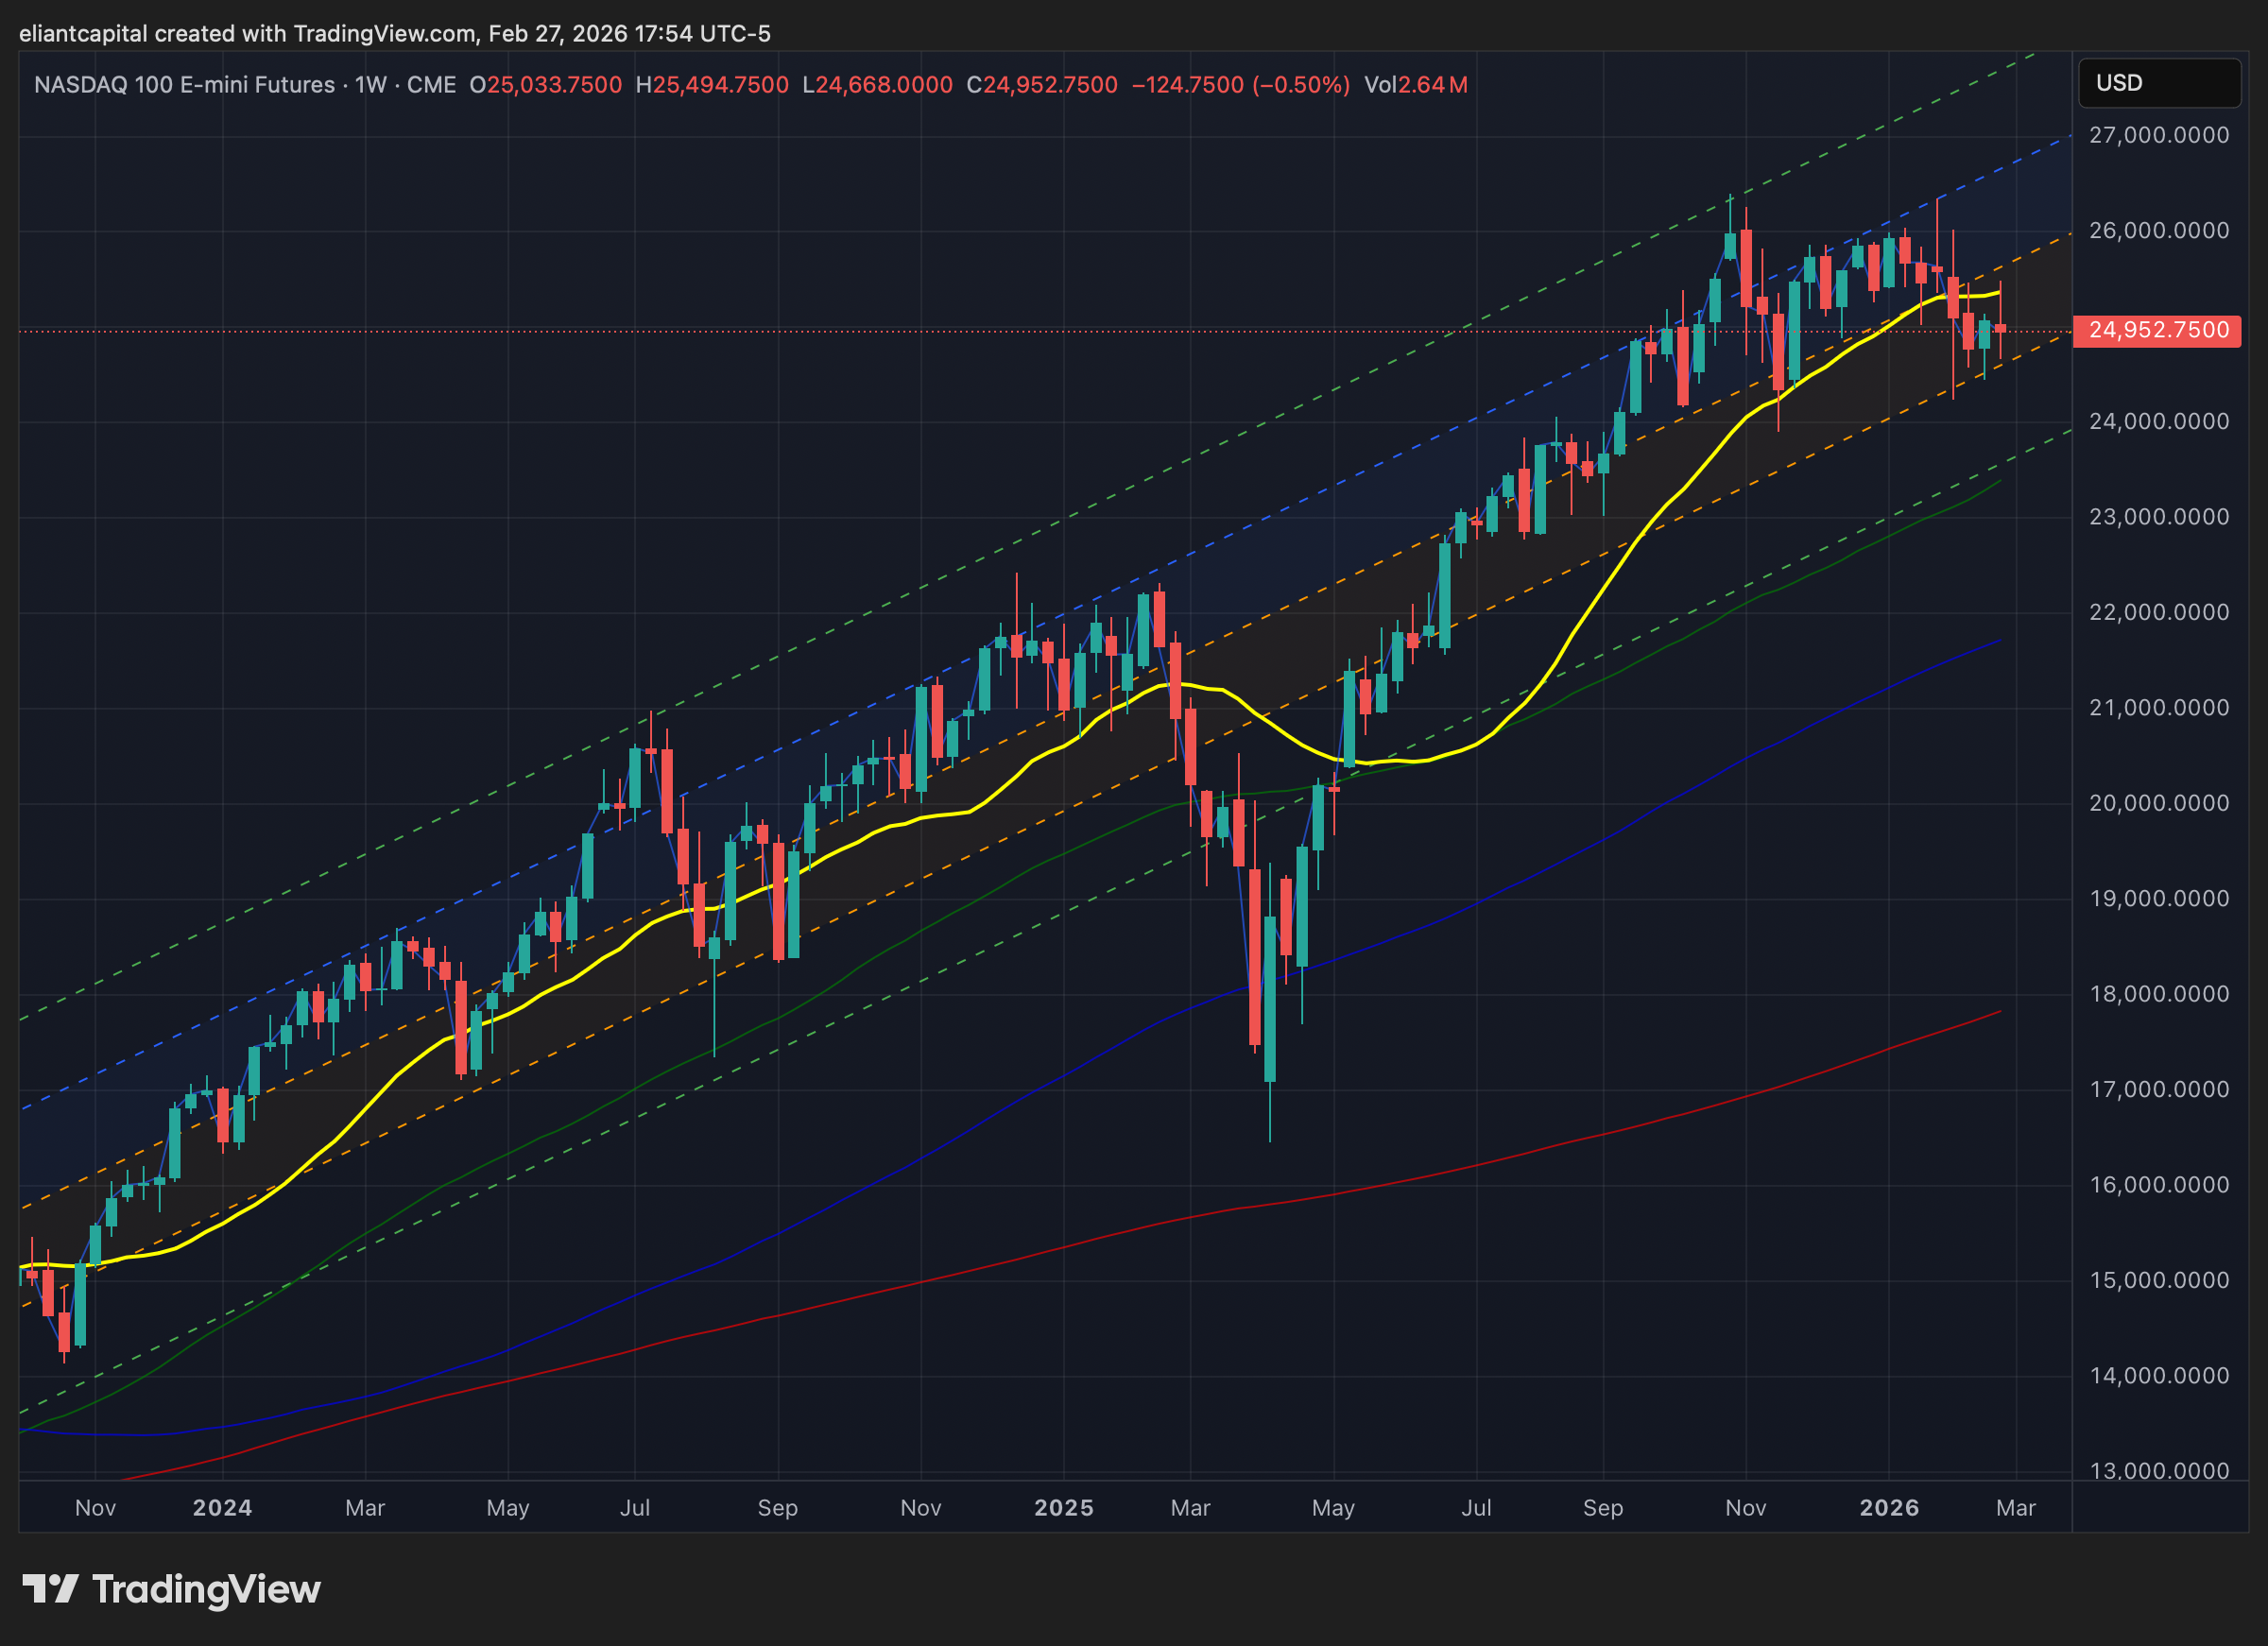
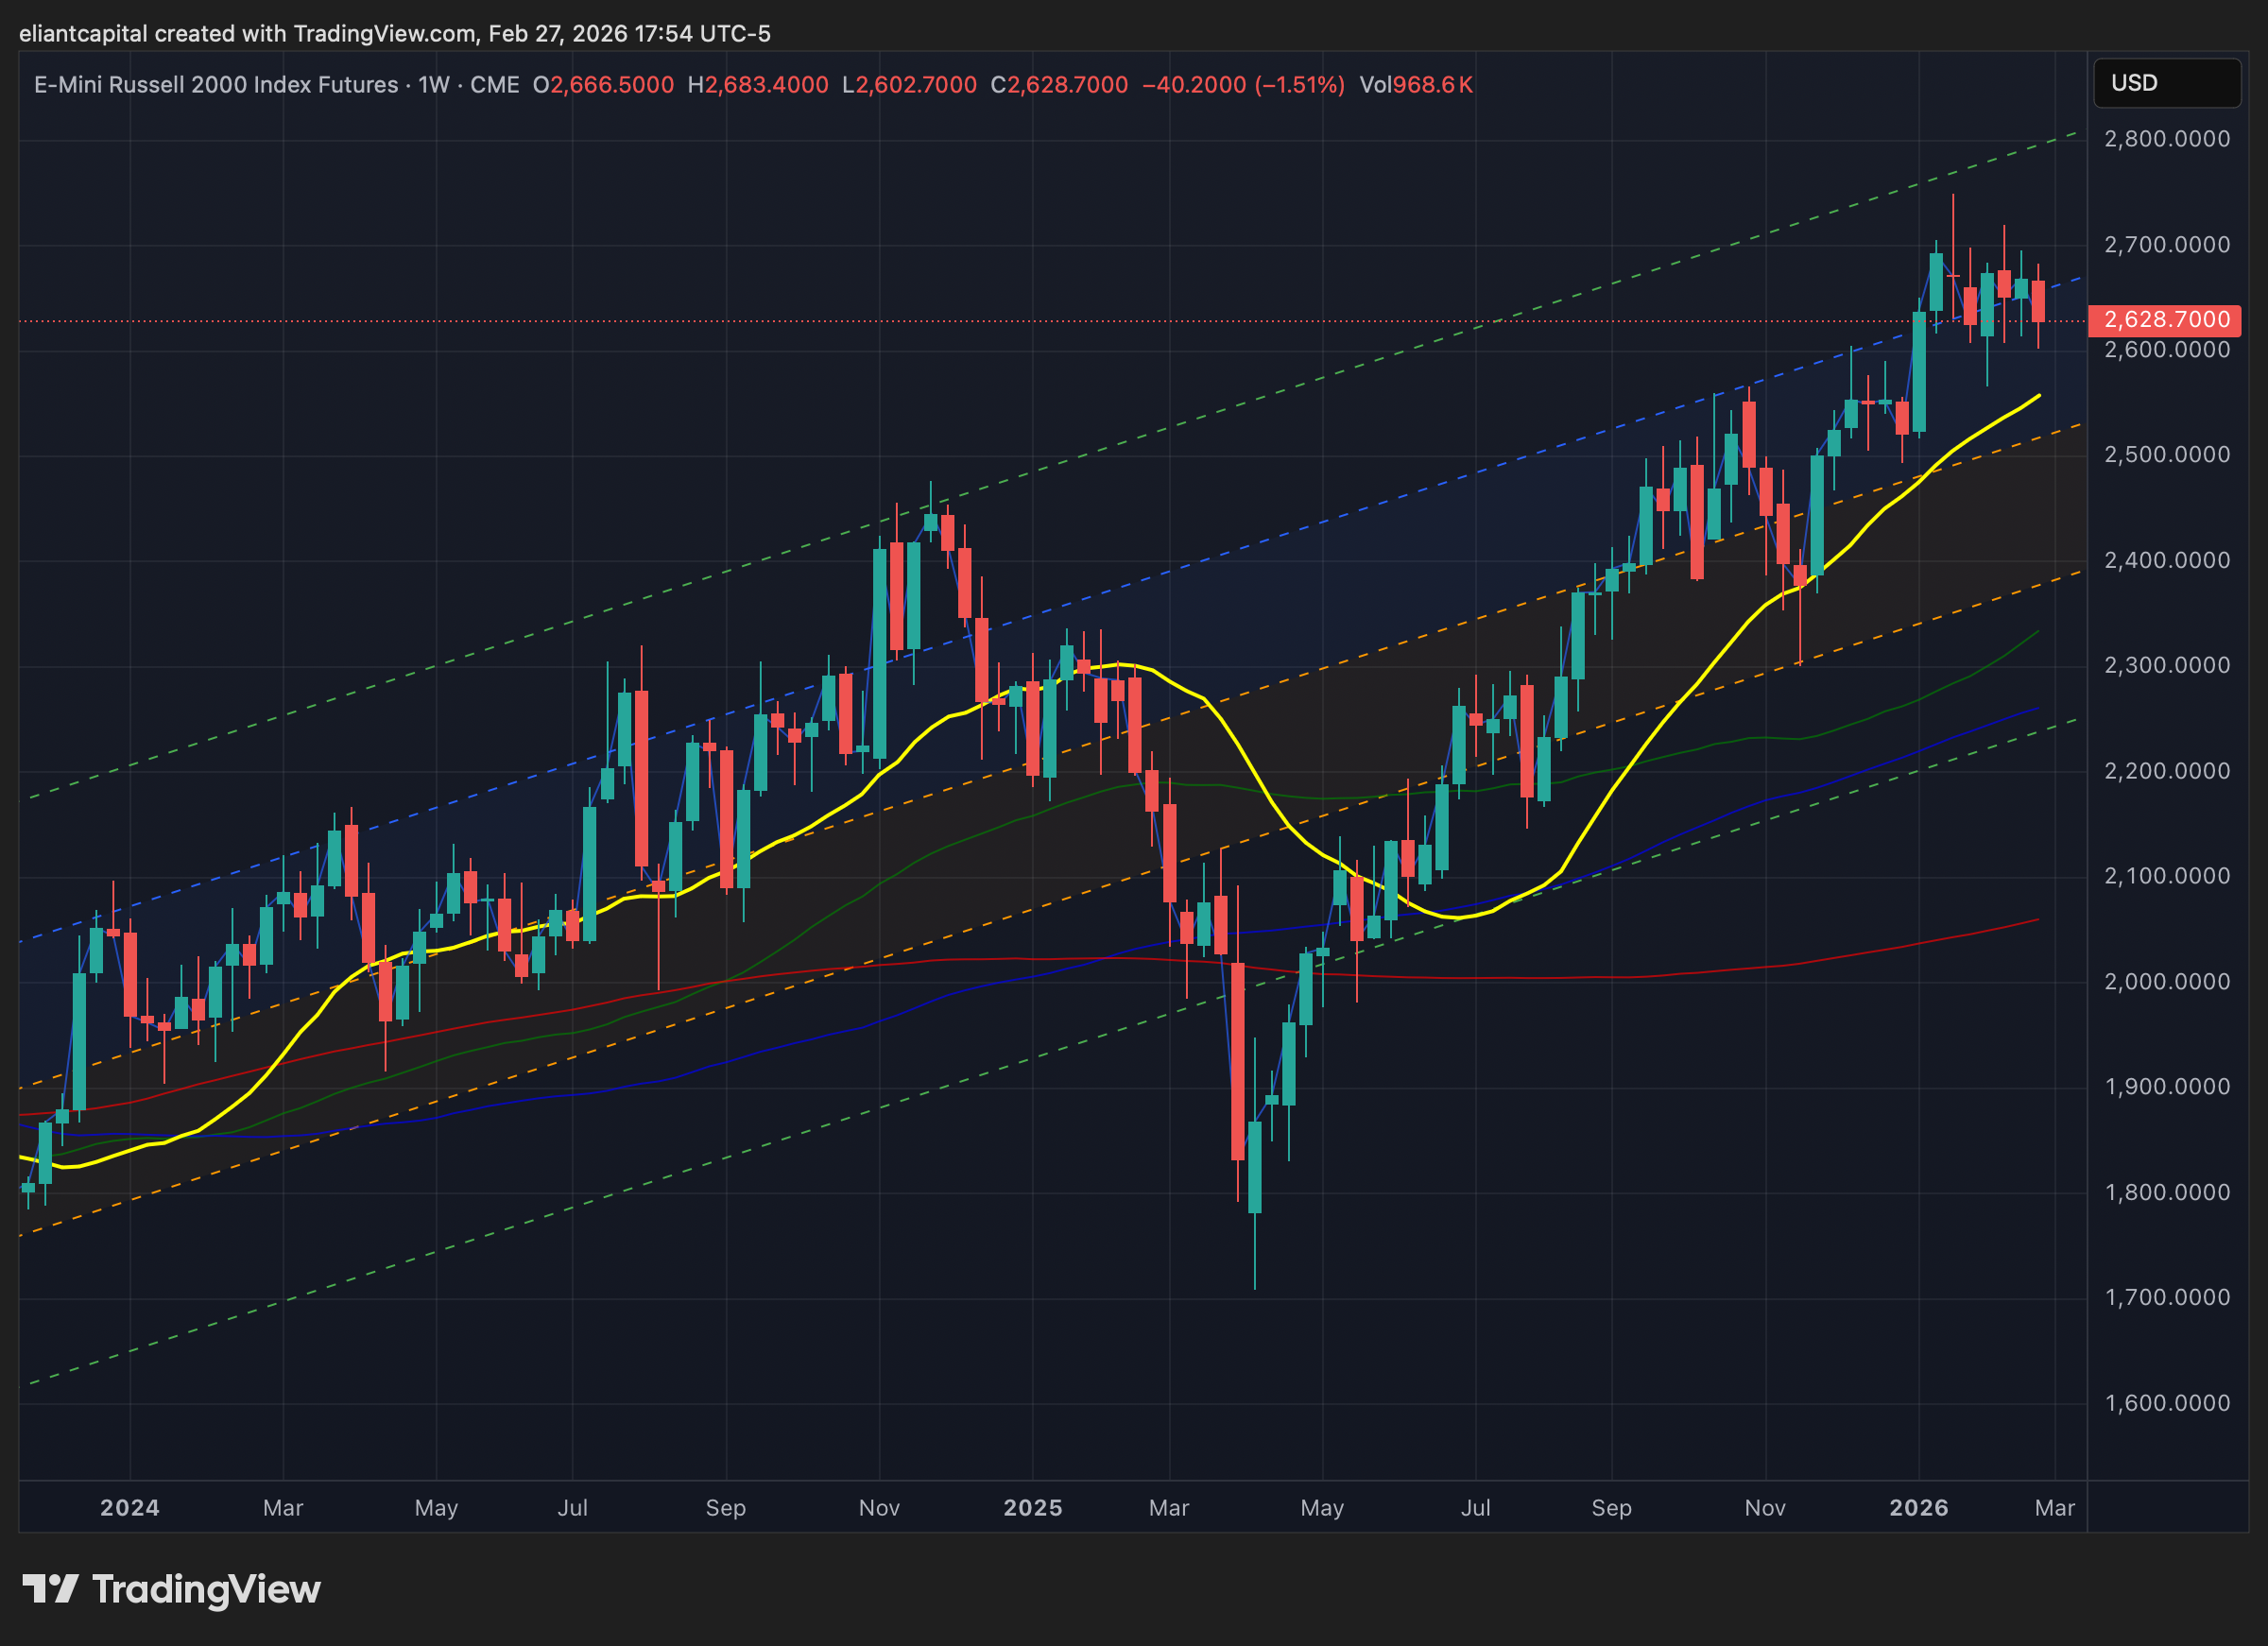
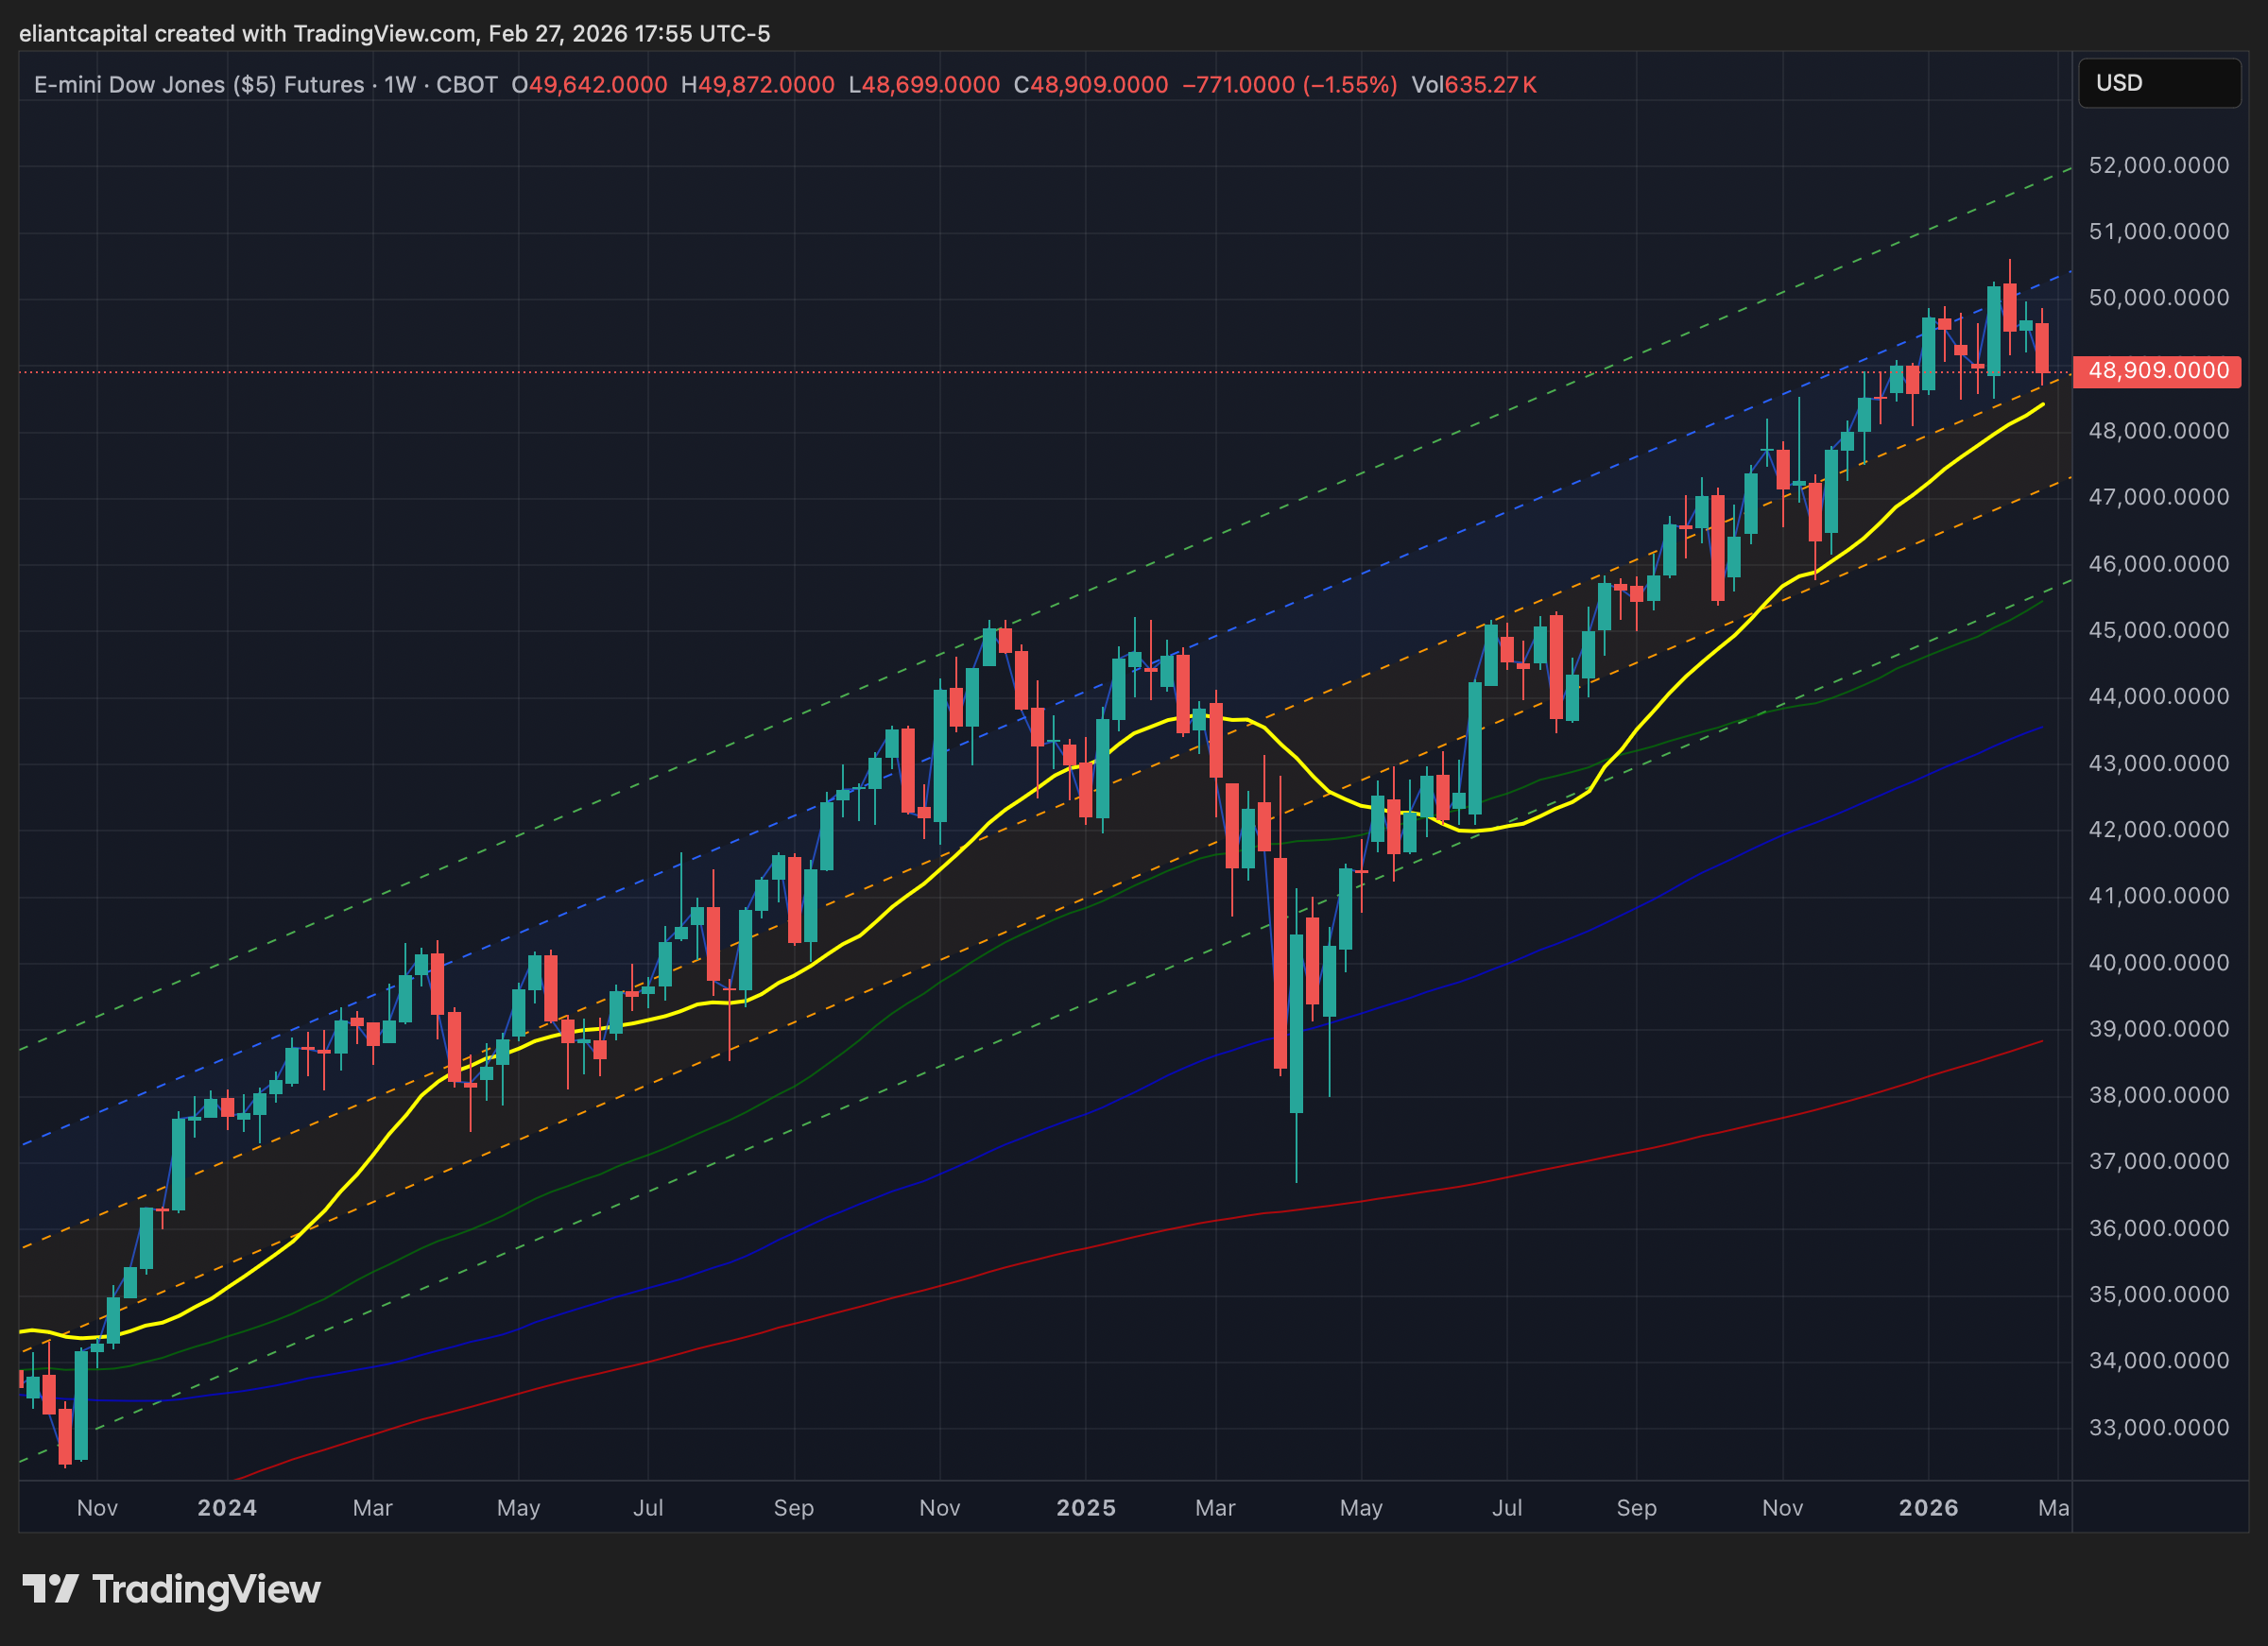
- STD Channels on Indices for Perspective: Weekly TF
- SPY
- QQQ
- IWM
- DJIA
Since starting this Substack back in June of ‘23, between individual names / tactical trades / baskets, we have netted a 180.34% return whilst in the same period, the Q’s have returned 72.34% / Spooz has returned 64.17% / Dow has returned 51.72% & Small-caps have returned 49.21%, so nice outperformance against all the indices whilst having a 81.8% win rate, averaging a 27.87% return on realized gains / winners & a 15.34% loss on realized losses / losers.
Looking forward to the future & continued success through ‘26.
And for anyone who wants to follow an actively managed portfolio in real time:
I’ve joined Plutus as the cleanest, day-to-day way to track an actively managed portfolio in real time. It’s a live dashboard that’s broader, more diversified, actively managed by me, & updated continuously.
The Eliant Flagship is published on RunPlutus.
Once your Plutus account is approved, you’ll have the option to allocate right away. If you do, it’s straightforward: create an account, link your brokerage (Available only for IBKR at this time), & select the Eliant Flagship (or any of the baskets I’ve built). Your money stays in your account, and trades, position changes, and rebalances are replicated automatically so there’s nothing manual to manage. The idea is to make it easier to access an actively managed portfolio run by me without the overhead of traditional fund structures or high minimums, whilst you keep full custody of your assets & I stay focused on research, positioning, and portfolio construction.
And just to be clear, NOTHING is changing with Substack. It’ll stay exactly what it’s always been since we originally launched in the Summer of ‘23: where I share the thinking, research, & select trades behind my personal PA, along with ongoing commentary across all markets.

For those who may have missed, we published our ‘2026 Outlook’ which has a plethora of coverage on a wide range of topics / themes as ‘26 kicks off after coming off a strong ‘25 & for those whom would like to go back & read the report, I included it just below:

Earlier in 2024, we launched a series titled Educational Pieces, covering a wide range of topics, many of which were suggested directly by you all (4-Part Series).
For those who may have missed the first installment, it covered topics including:
General background / knowledge on all option strategies
In-depth talk on risk / reversals & how to go about expressing / utilizing them
Options Structuring
When to used naked calls / puts vs. spreads
Choosing expiration dates
Identifying key pivots / supports / resistance zones
General briefing on stock gaps
What to look for in regards to fundamentals
Implementing fundamental / macro / technicals into a trade
Hedging
Creating risk/reward setups
Taking profits / managing losses
Overall Process
Book recommendations
A link to the original Educational Piece can be found here .
Given the positive feedback and how useful many of you found the first installment, we followed up with Educational Piece: Part Deux earlier in 2025 & for those who may have missed, a link to the piece can be found here & we then went on to release Educational Piece: Part Trois which can be found here.
And finally, the most recent installment, Educational Piece: Part Quatre, can be found here.
‘Risk management is the silent prerequisite for compounding & true wealth is built not by chasing the highest returns but by ensuring the survival necessary to realize them.’

To jump straight into it, we’ve now made it through the second month of ‘26, and despite relatively tame index-level action on the surface, it has been nothing short of chaotic beneath the hood in terms of single-stock volatility.
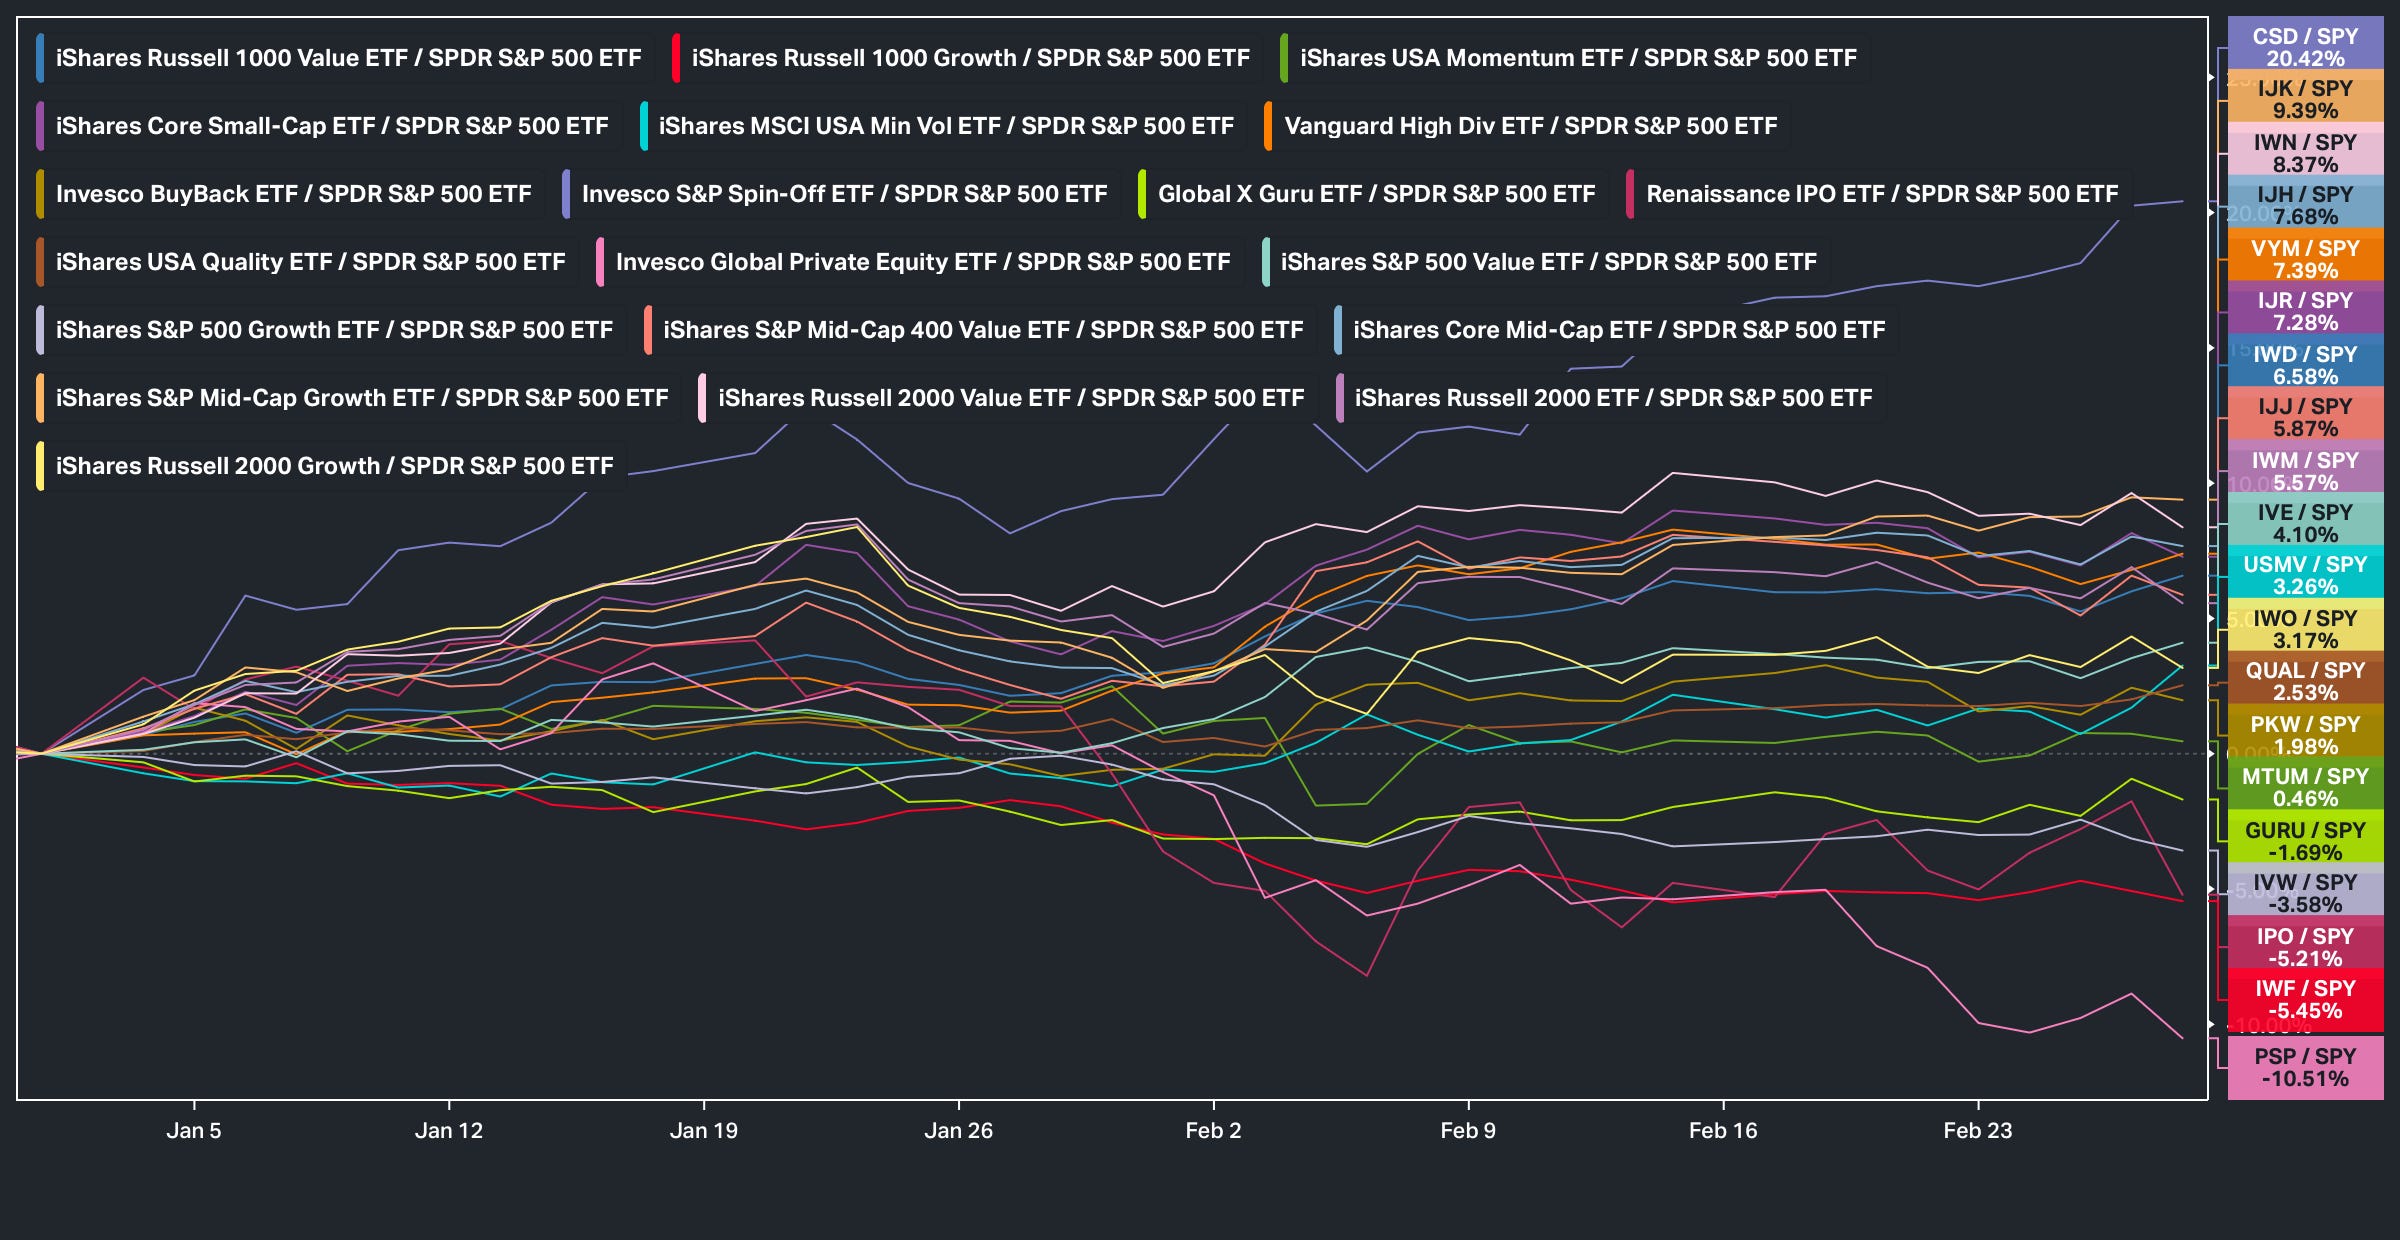
Year to date, the worst-performing group has been private equity, followed by growth, while the best-performing factor has been spin-offs alongside mid-caps.
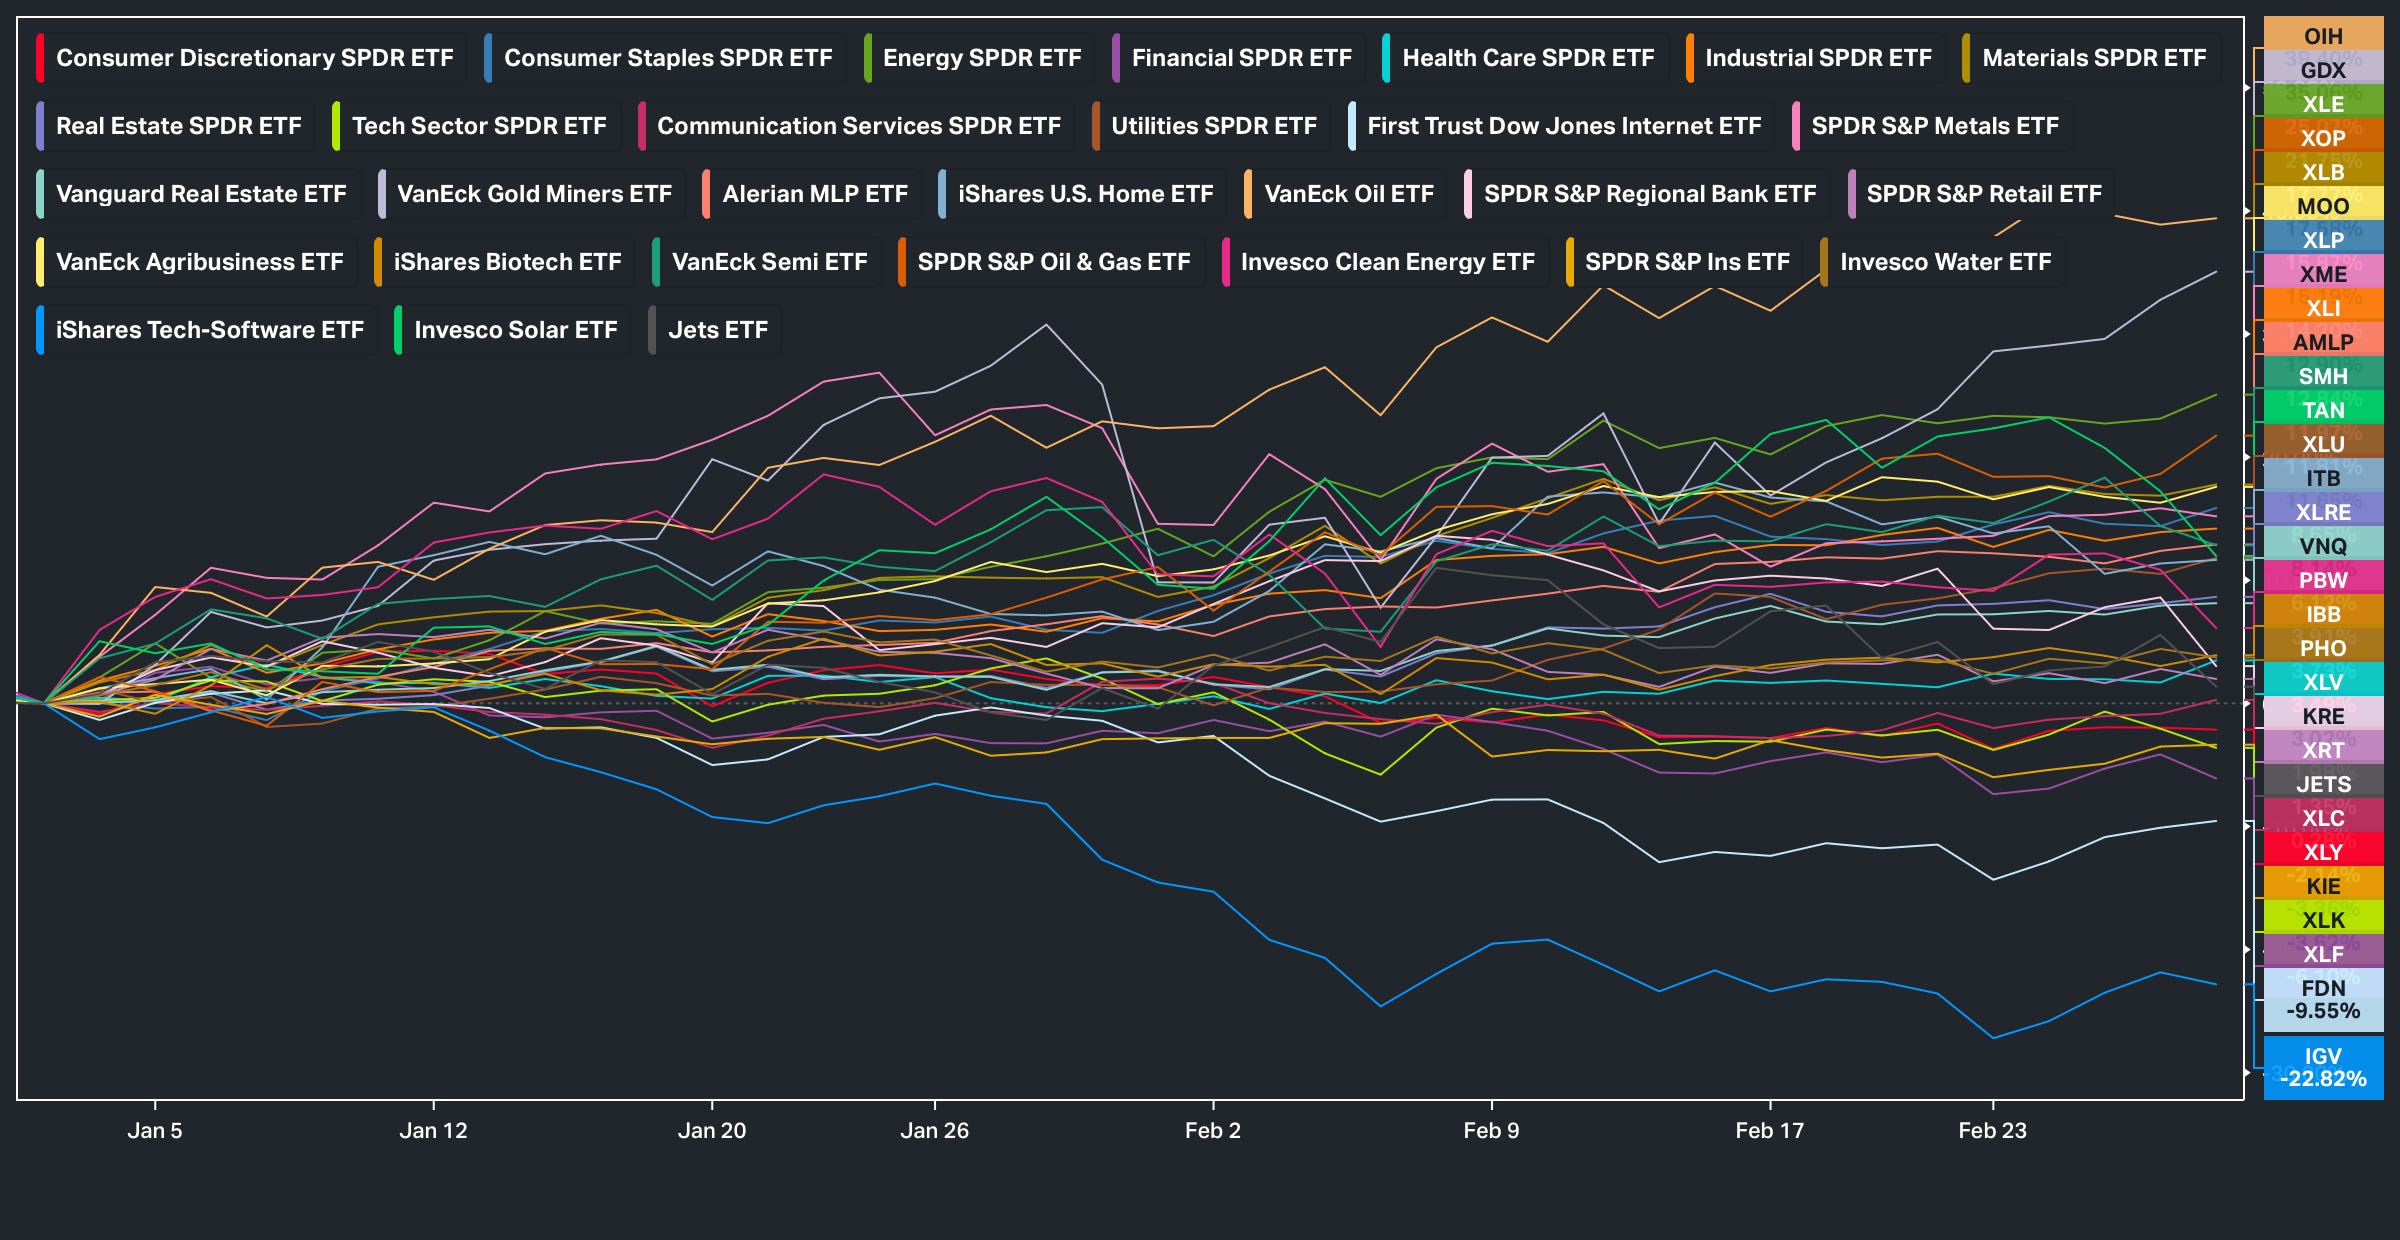
Sector-wise, and unsurprisingly, software has been the worst-performing group year to date, while oil services, gold miners, and energy have been the best-performing sectors:
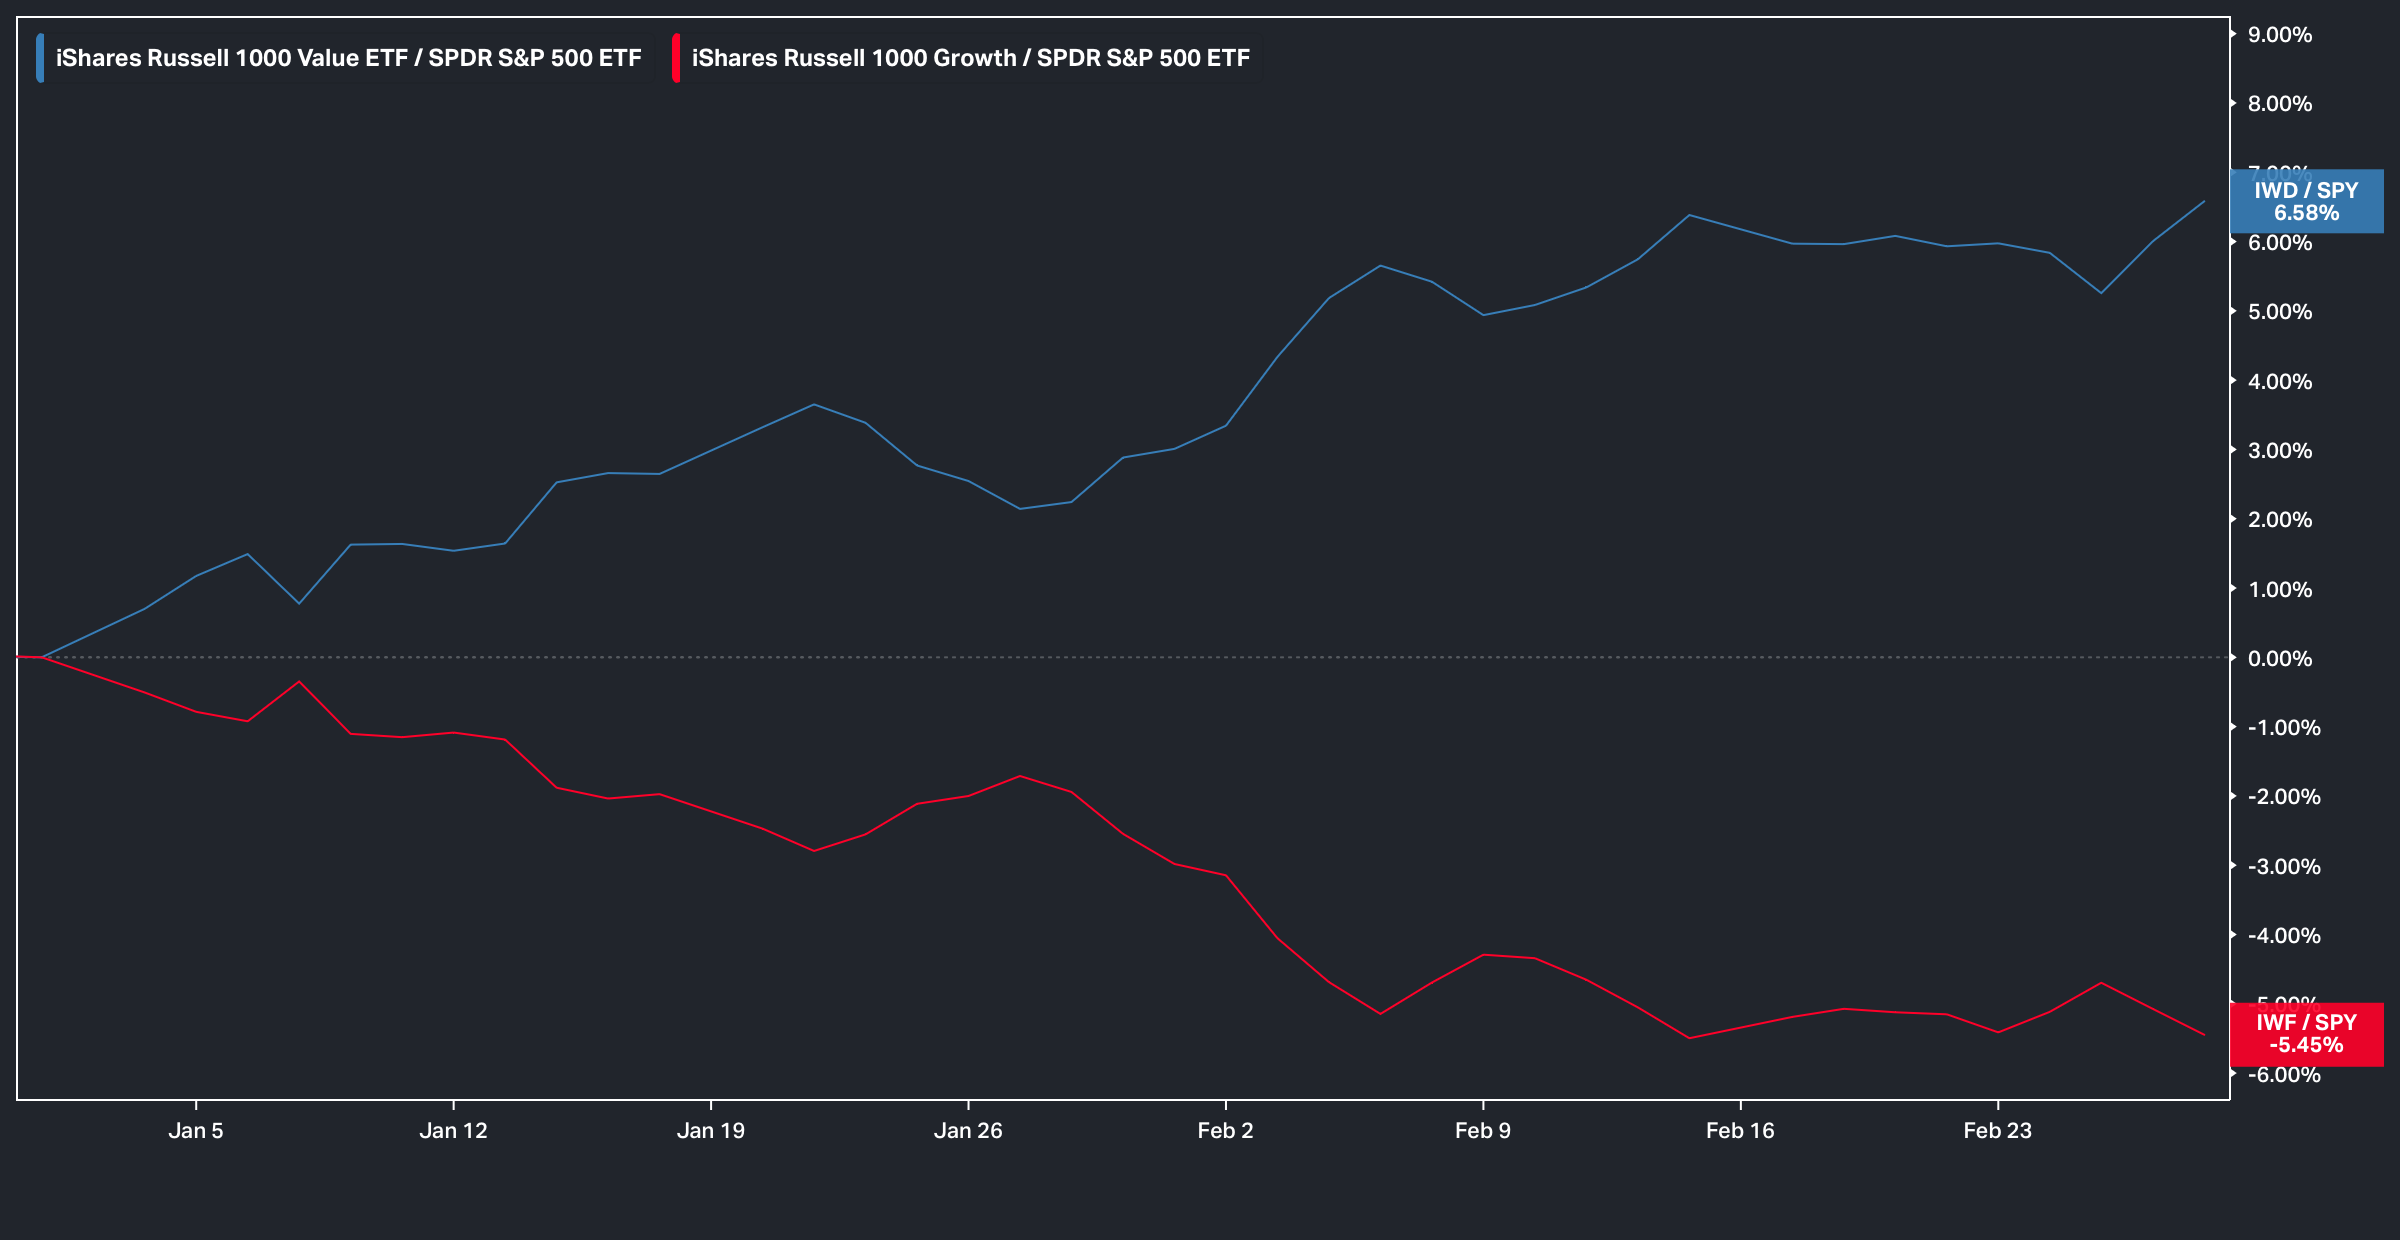
And in relation to growth versus value, given the sector leadership year to date, the performance spread has widened to roughly 12%, with value having outperformed growth:
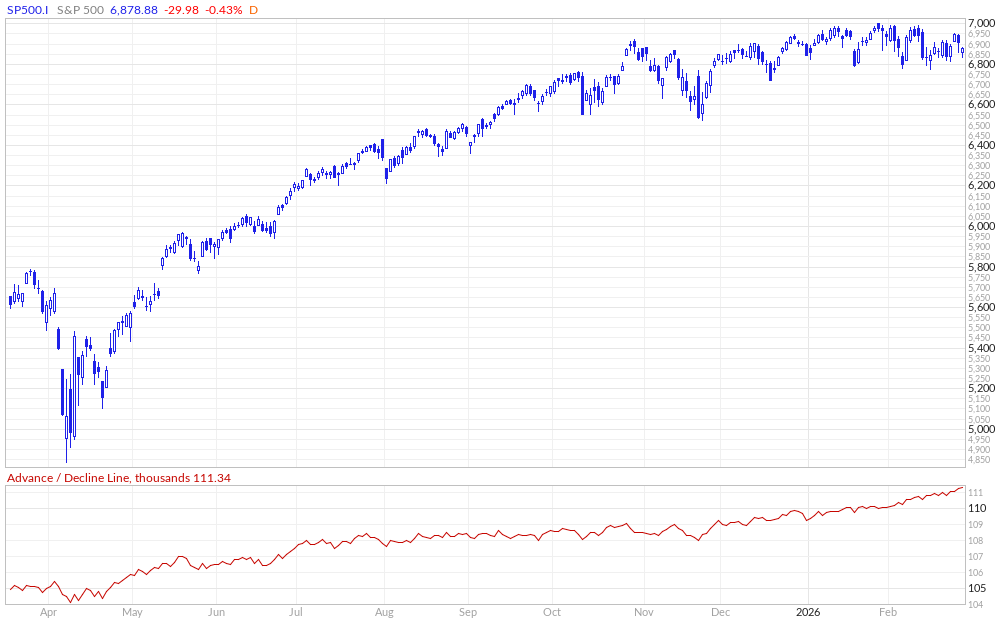
With all that being said, despite the choppiness in February along with the extreme single-stock volatility & Spooz being 200bps off the highs, the Advance-Decline Line has still continued to make higher-highs:
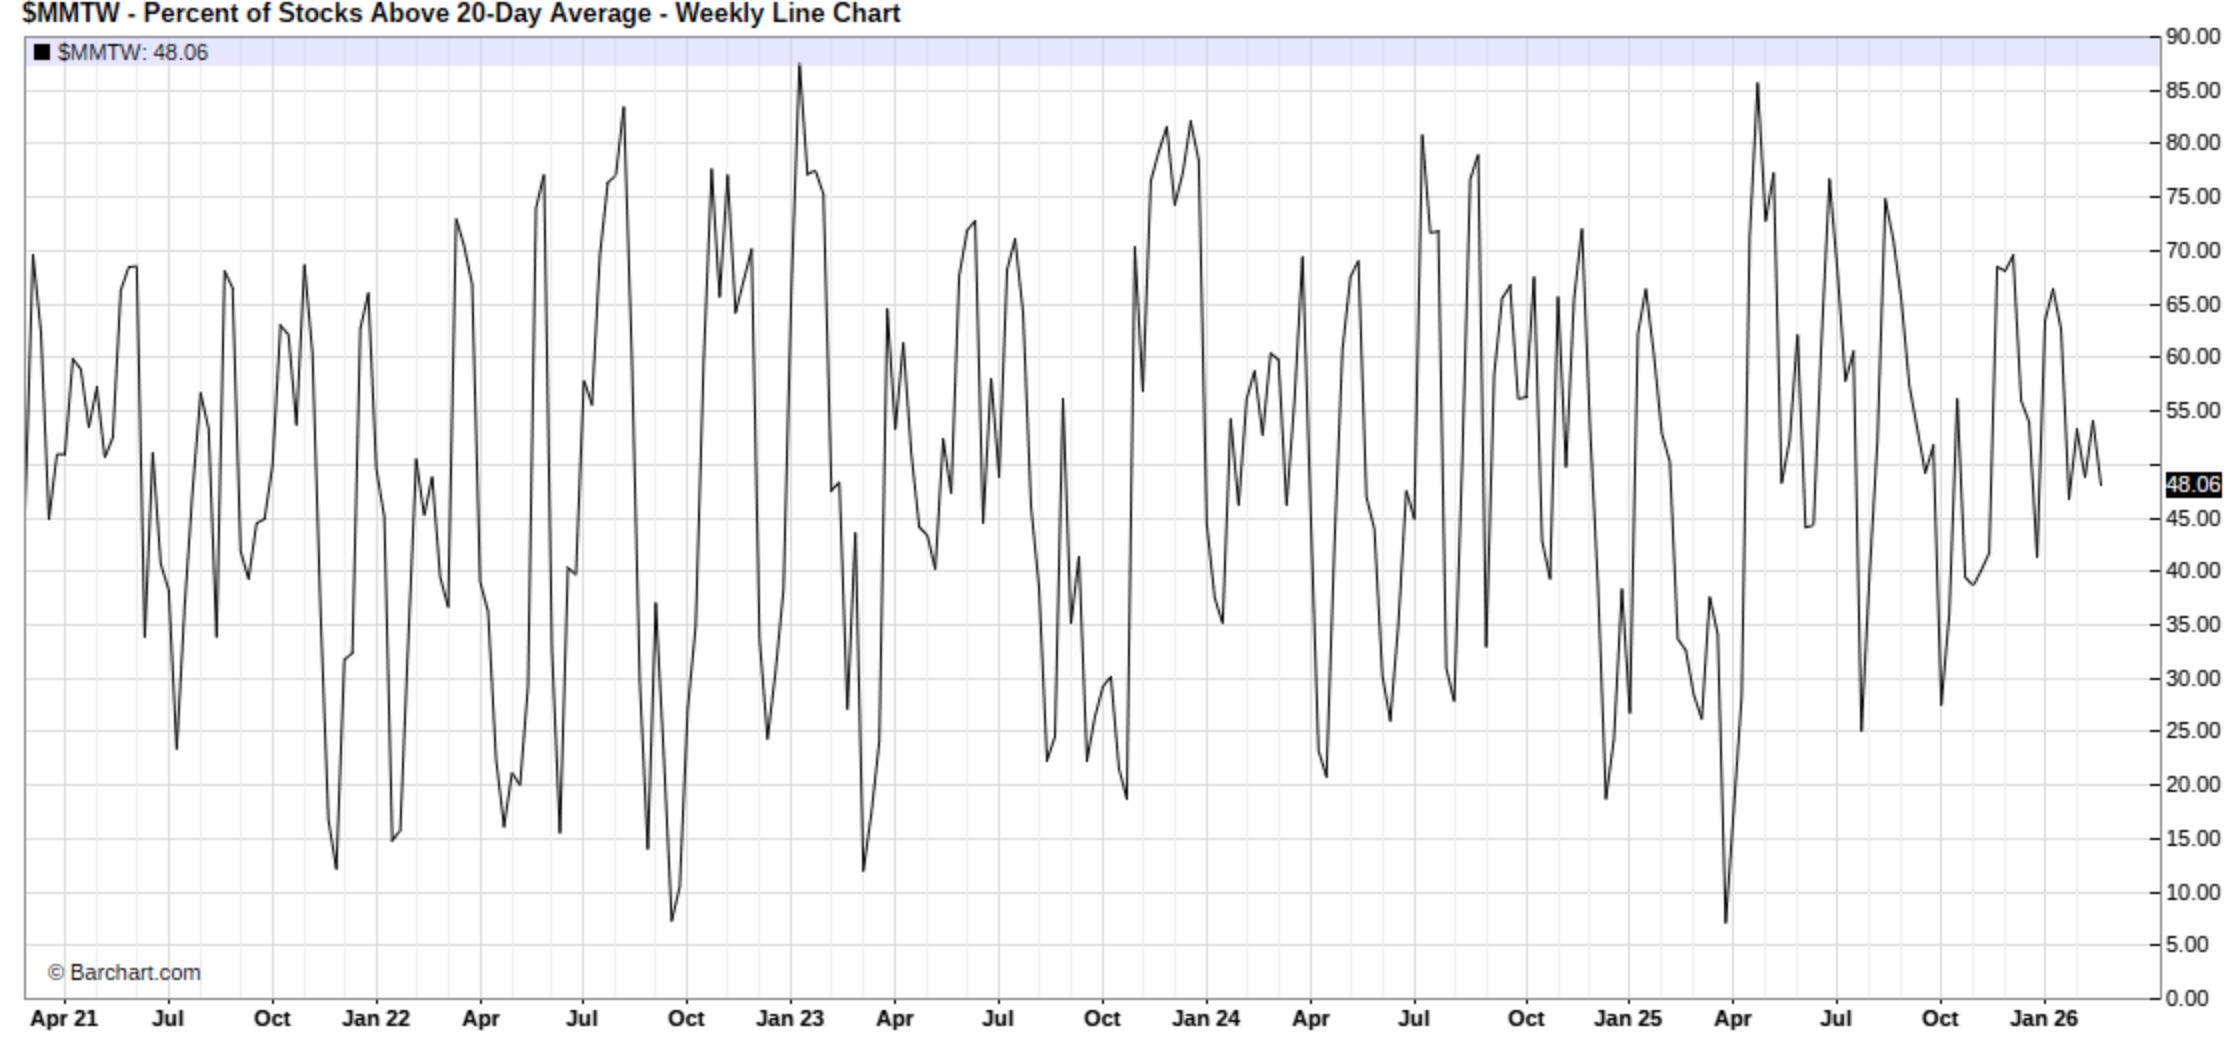
And on that note, despite the broadening of upside participation (Advance-Decline Line Continued New Highs), the % of Stocks Above the 20D still remains more neutral (Instead of overbought & or oversold) as it currently sits at 48%, which again, is mostly attributed to the continued & violent single-stock volatility:
And a similar point can be made on a broader timeframe, as roughly 50% of stocks remain above the 50D (Neutral reading), despite the continued broadening in upside participation, which again emphasizes the ongoing dispersion within markets:
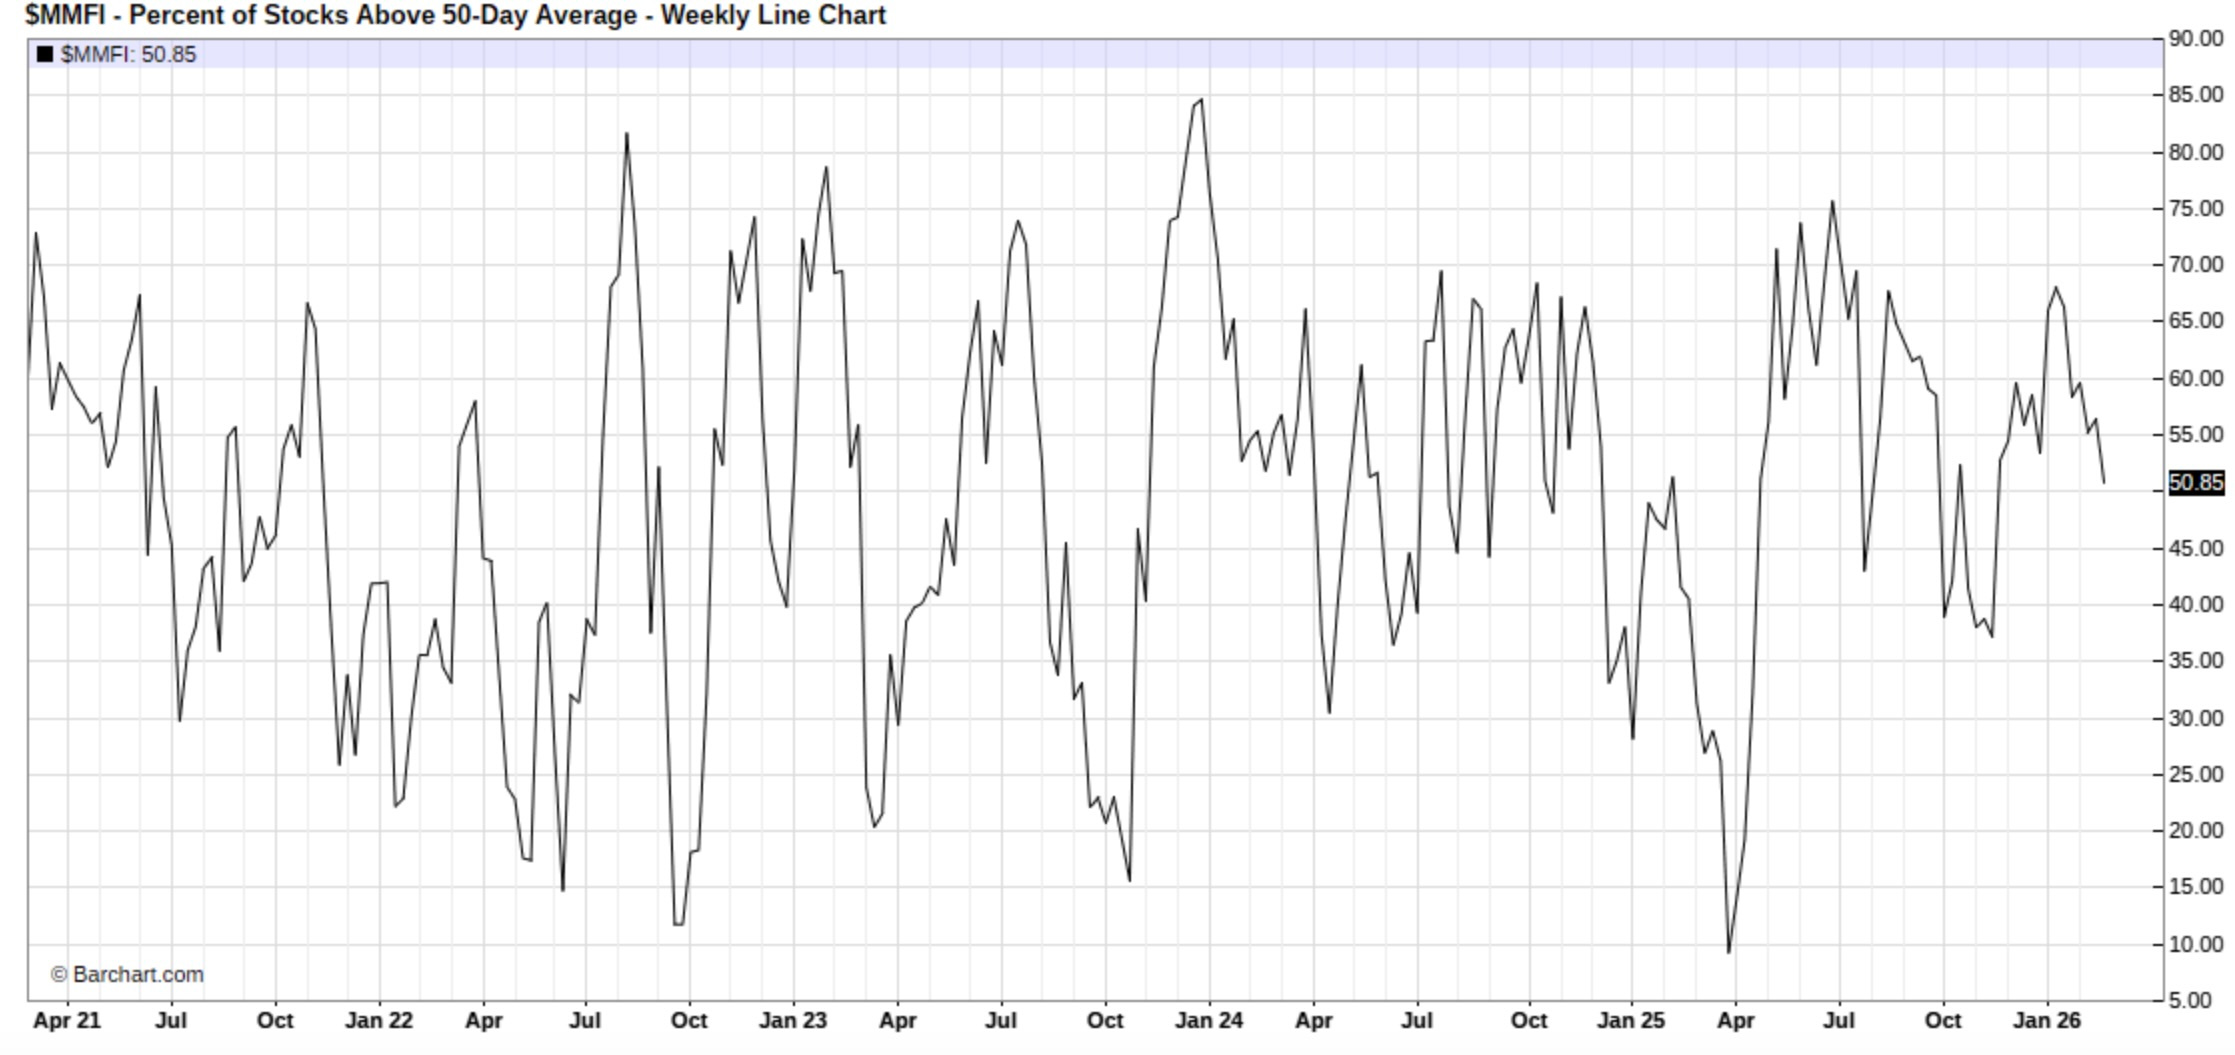
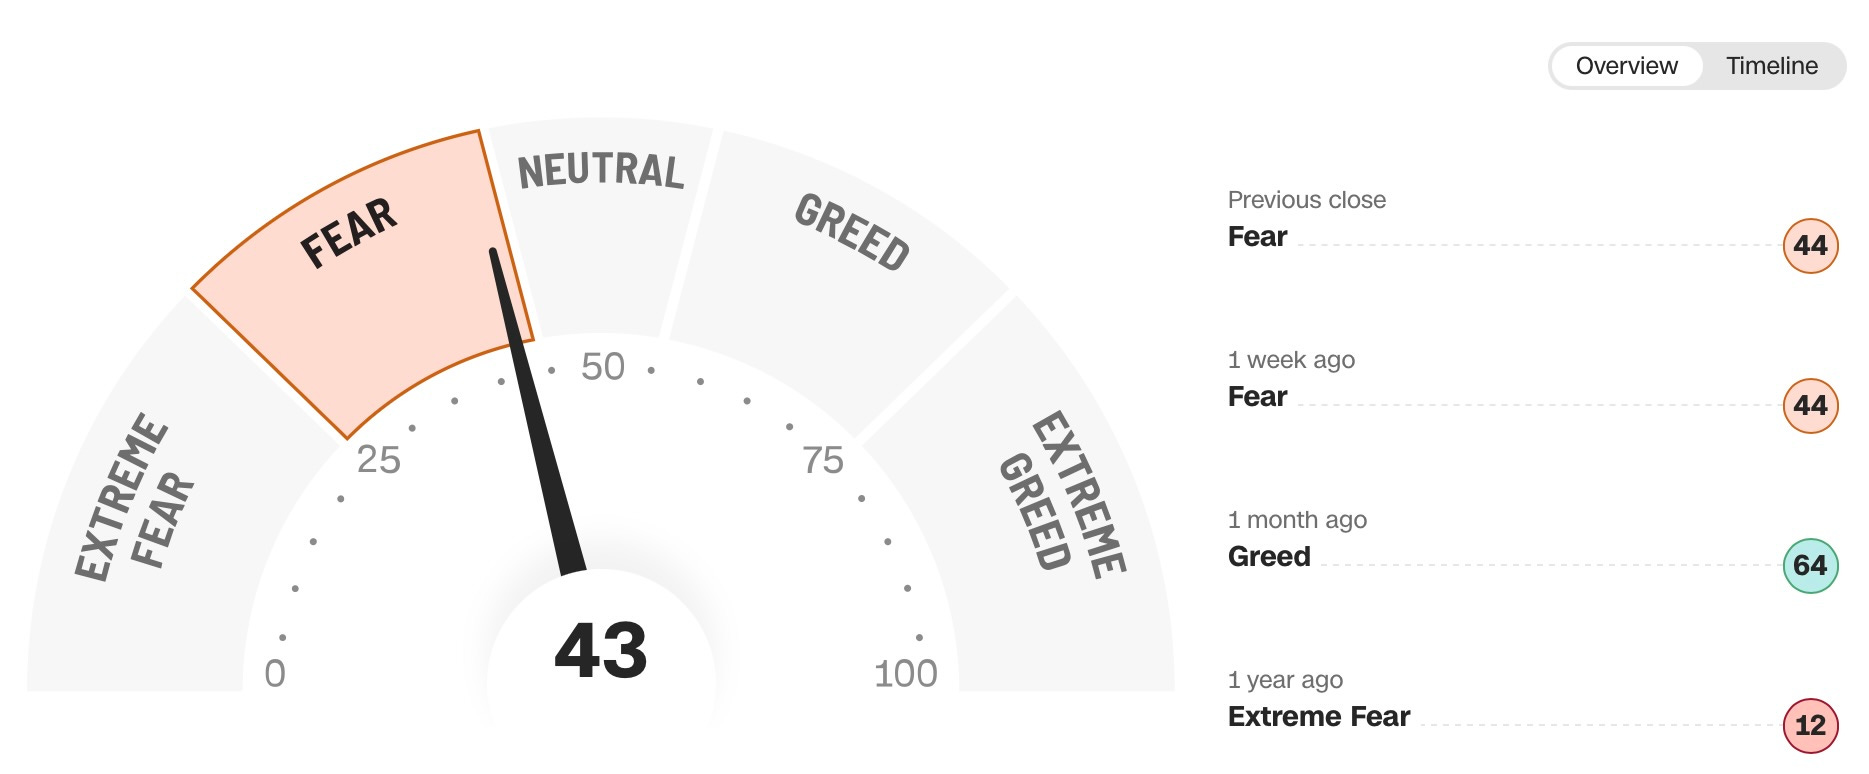
However, despite the neutral readings and headline indices sitting just below all-time highs, again, the market has continued to experience significant underlying dispersion & rolling blowups across multiple sectors, driven largely by AI-disruption narratives and long–short unwind dynamics & as a result, the Fear-Greed Index has continued to oscillate between fear and neutral and for now, sits within fear territory despite the Advance-Decline Index continuing to push to new highs.
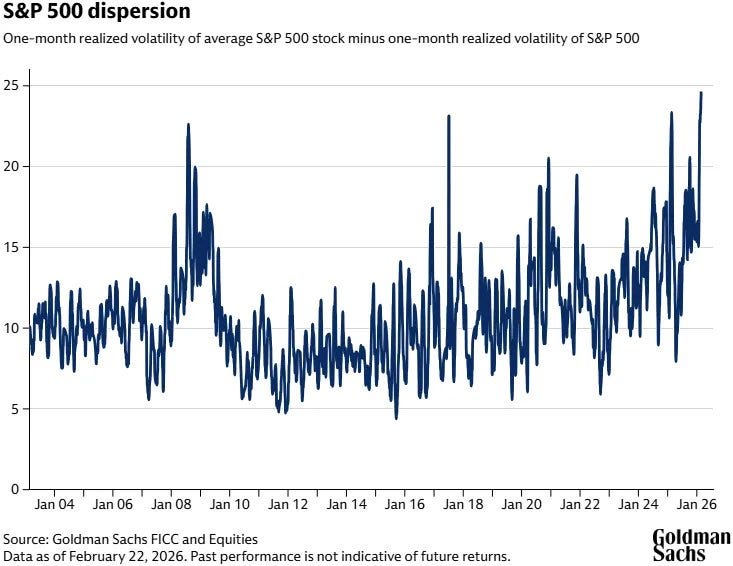
Again, the key takeaway from February is that elevated single-stock volatility alongside a relatively tame index remains the dominant theme. Dispersion has pushed to record levels, with the average stock’s movement versus the index reaching new highs, underscoring how much of the action continues to occur beneath the surface rather than at the index level: