The Week Ahead 3/22/26

Hello All,
I hope you’re all enjoying the weekend and getting some time away from the screens & wishing you all a successful remainder of ‘26.
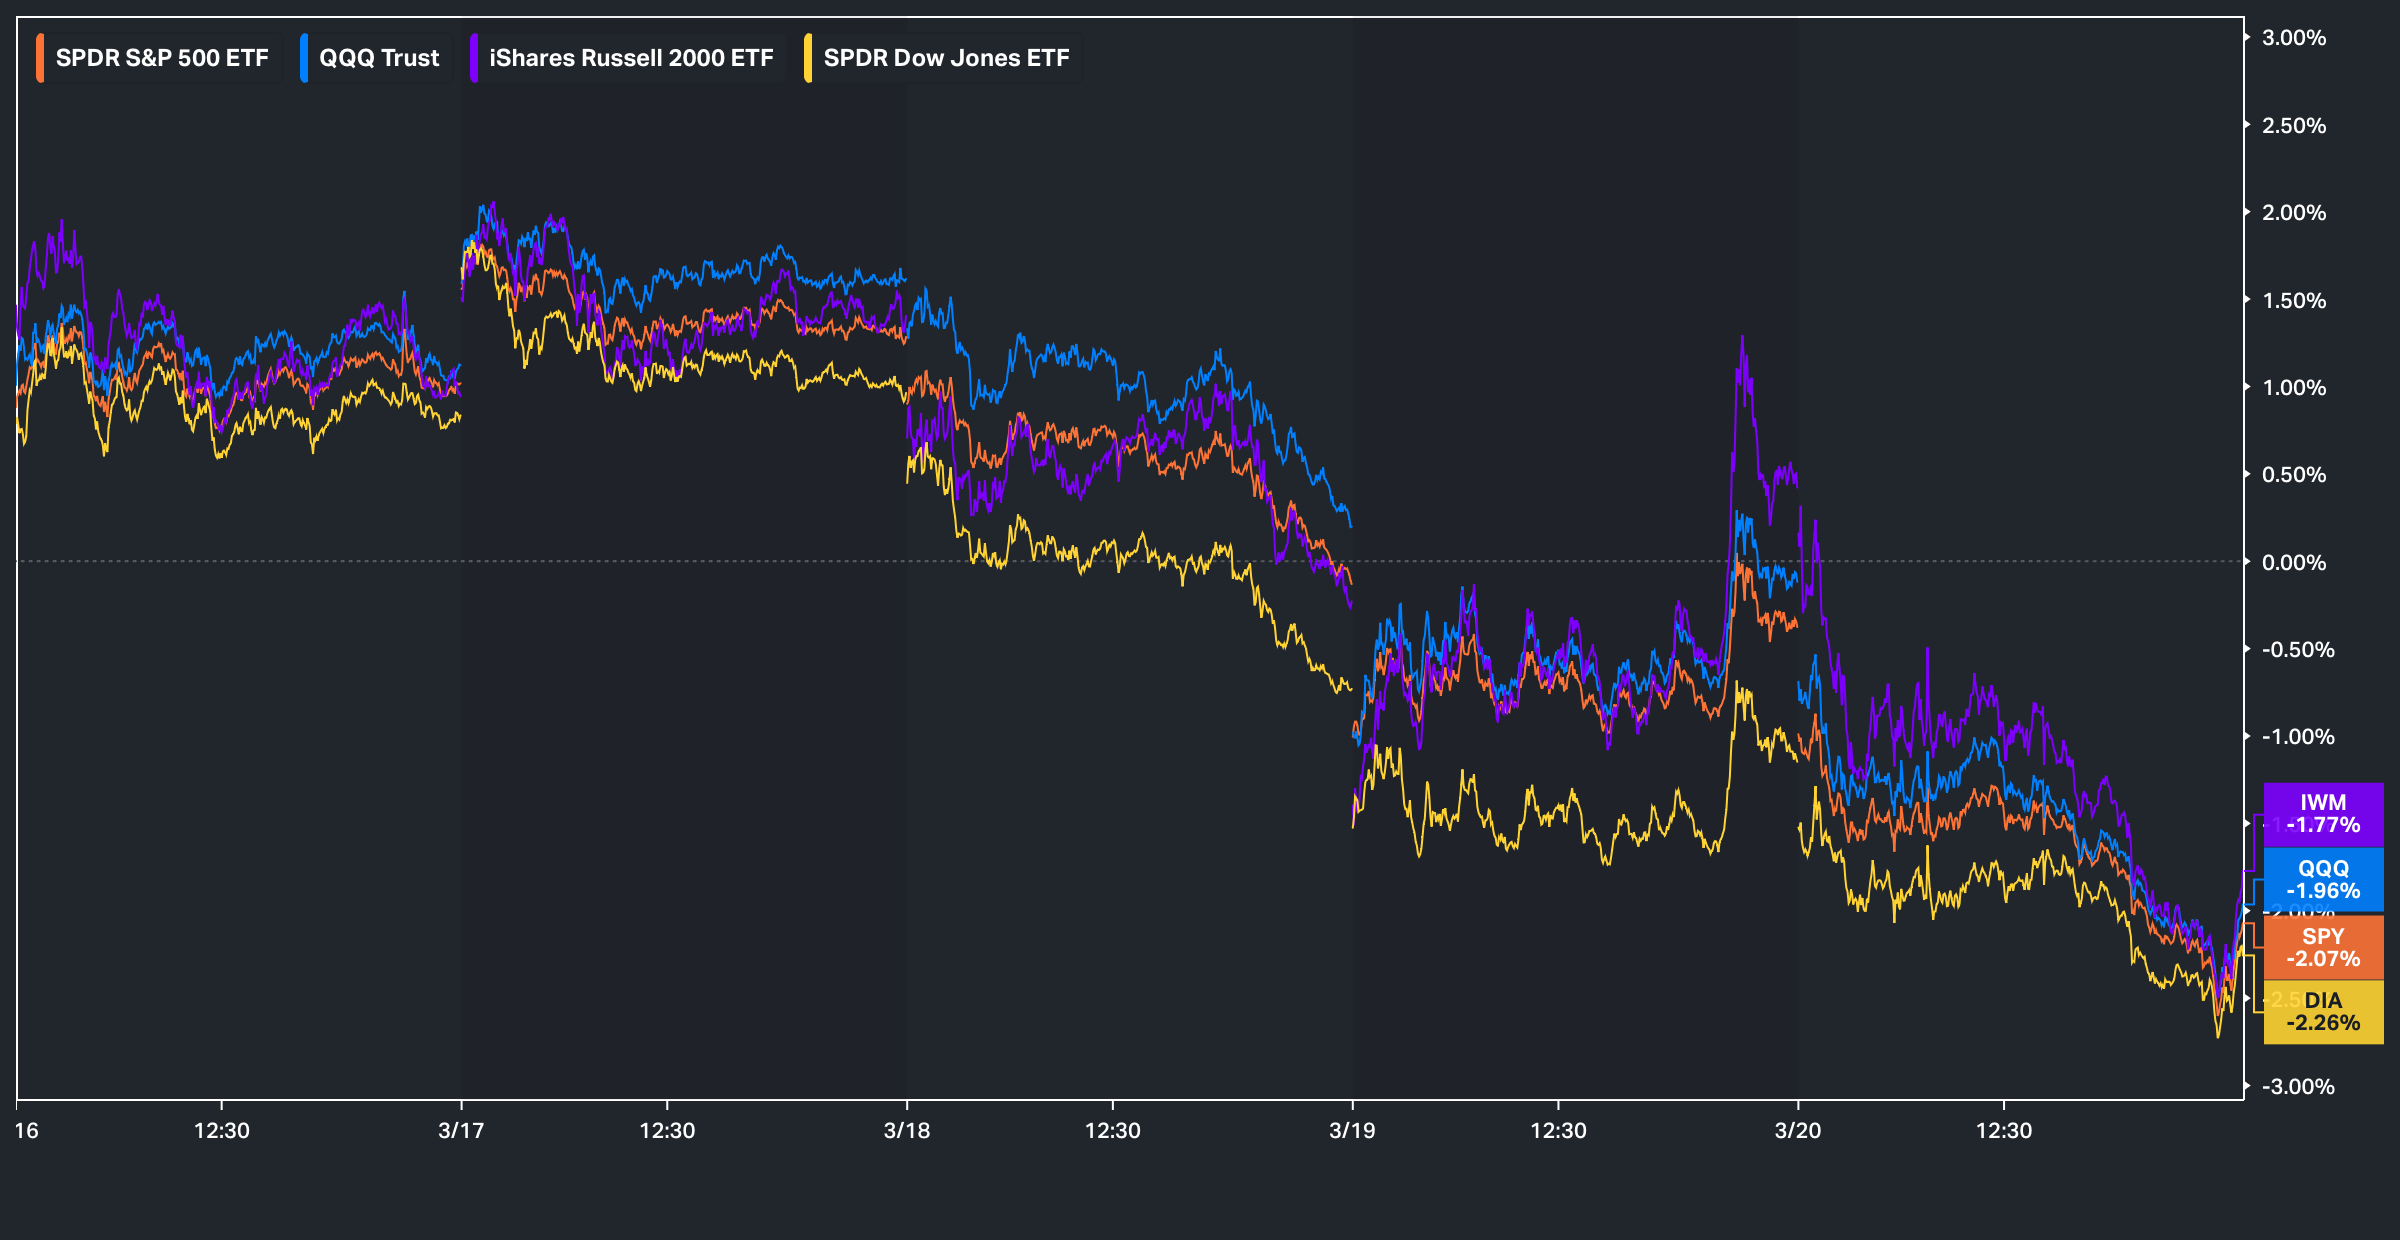
This past week was yet another eventful one geopolitically, but initially, as the week kicked off, the indices started off strong following an announcement by Trump that the U.S. was looking to secure Hormuz by forming a coalition. However, as the week progressed, after an initially quiet few days, Israel escalated the war by striking Iranian energy infrastructure, along with a perceived ‘hawkish’ FOMC, which then led the indices to fade the earlier gains from the start of the week and close lower across the board.
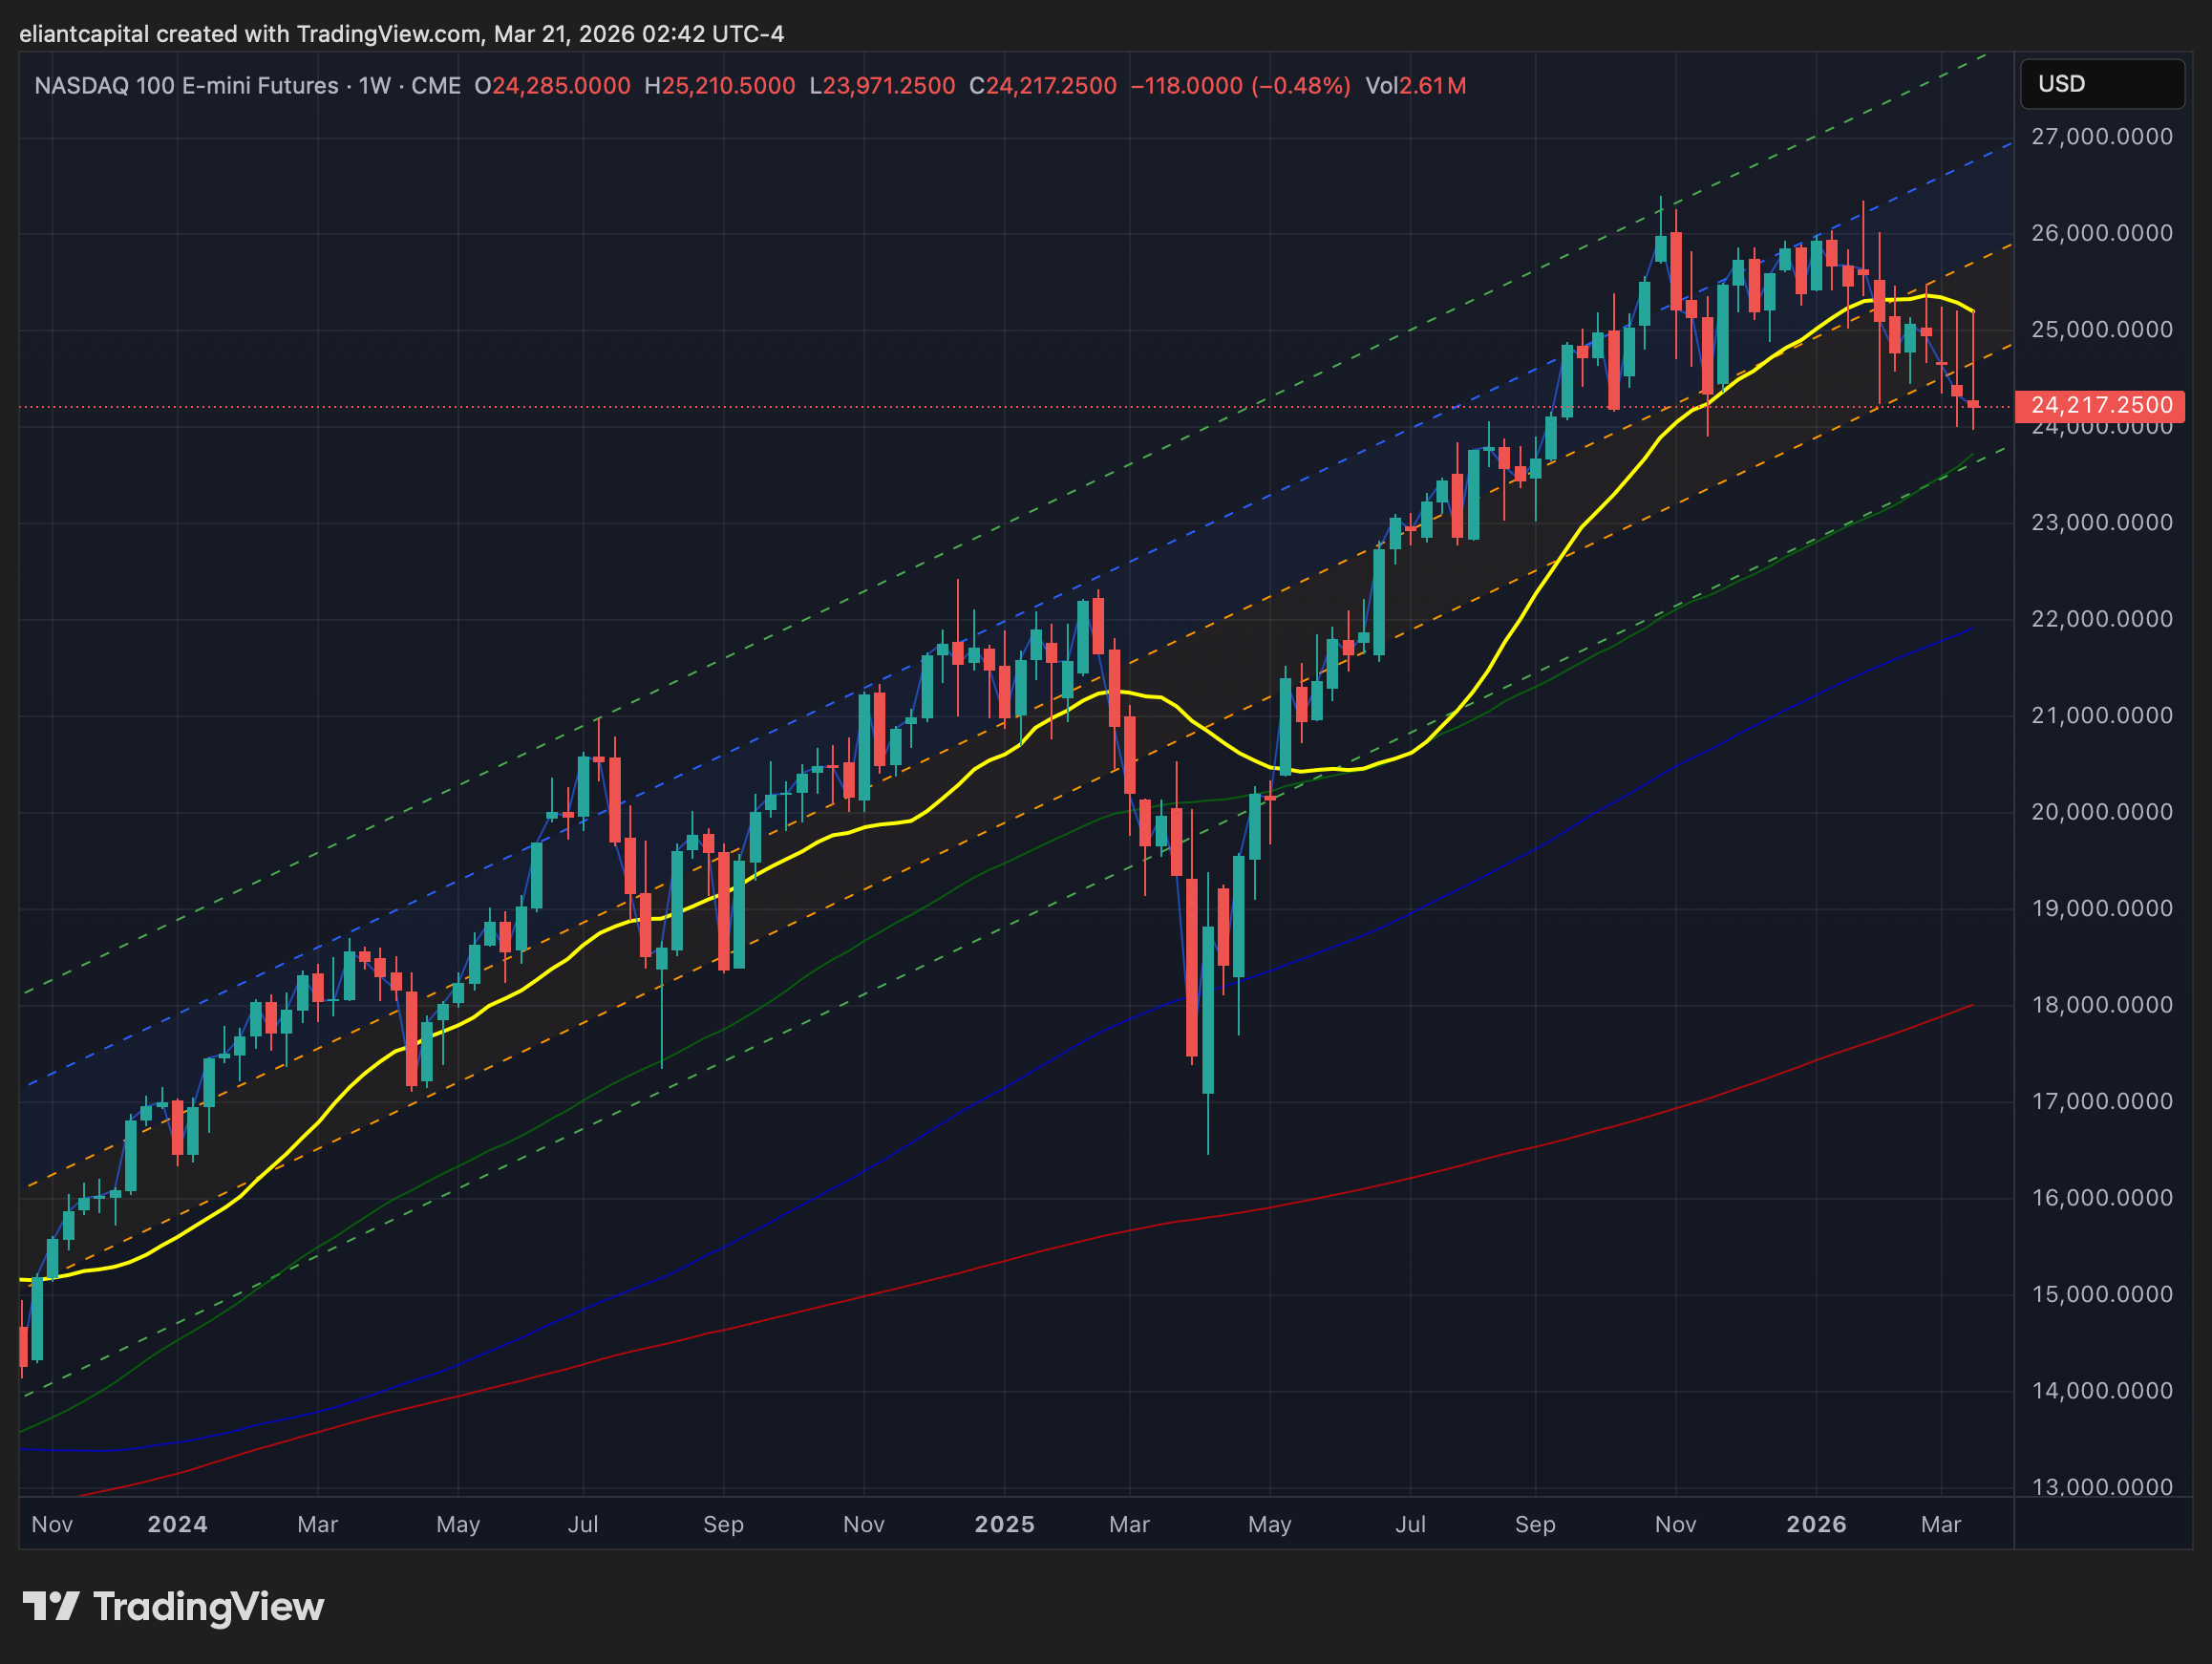
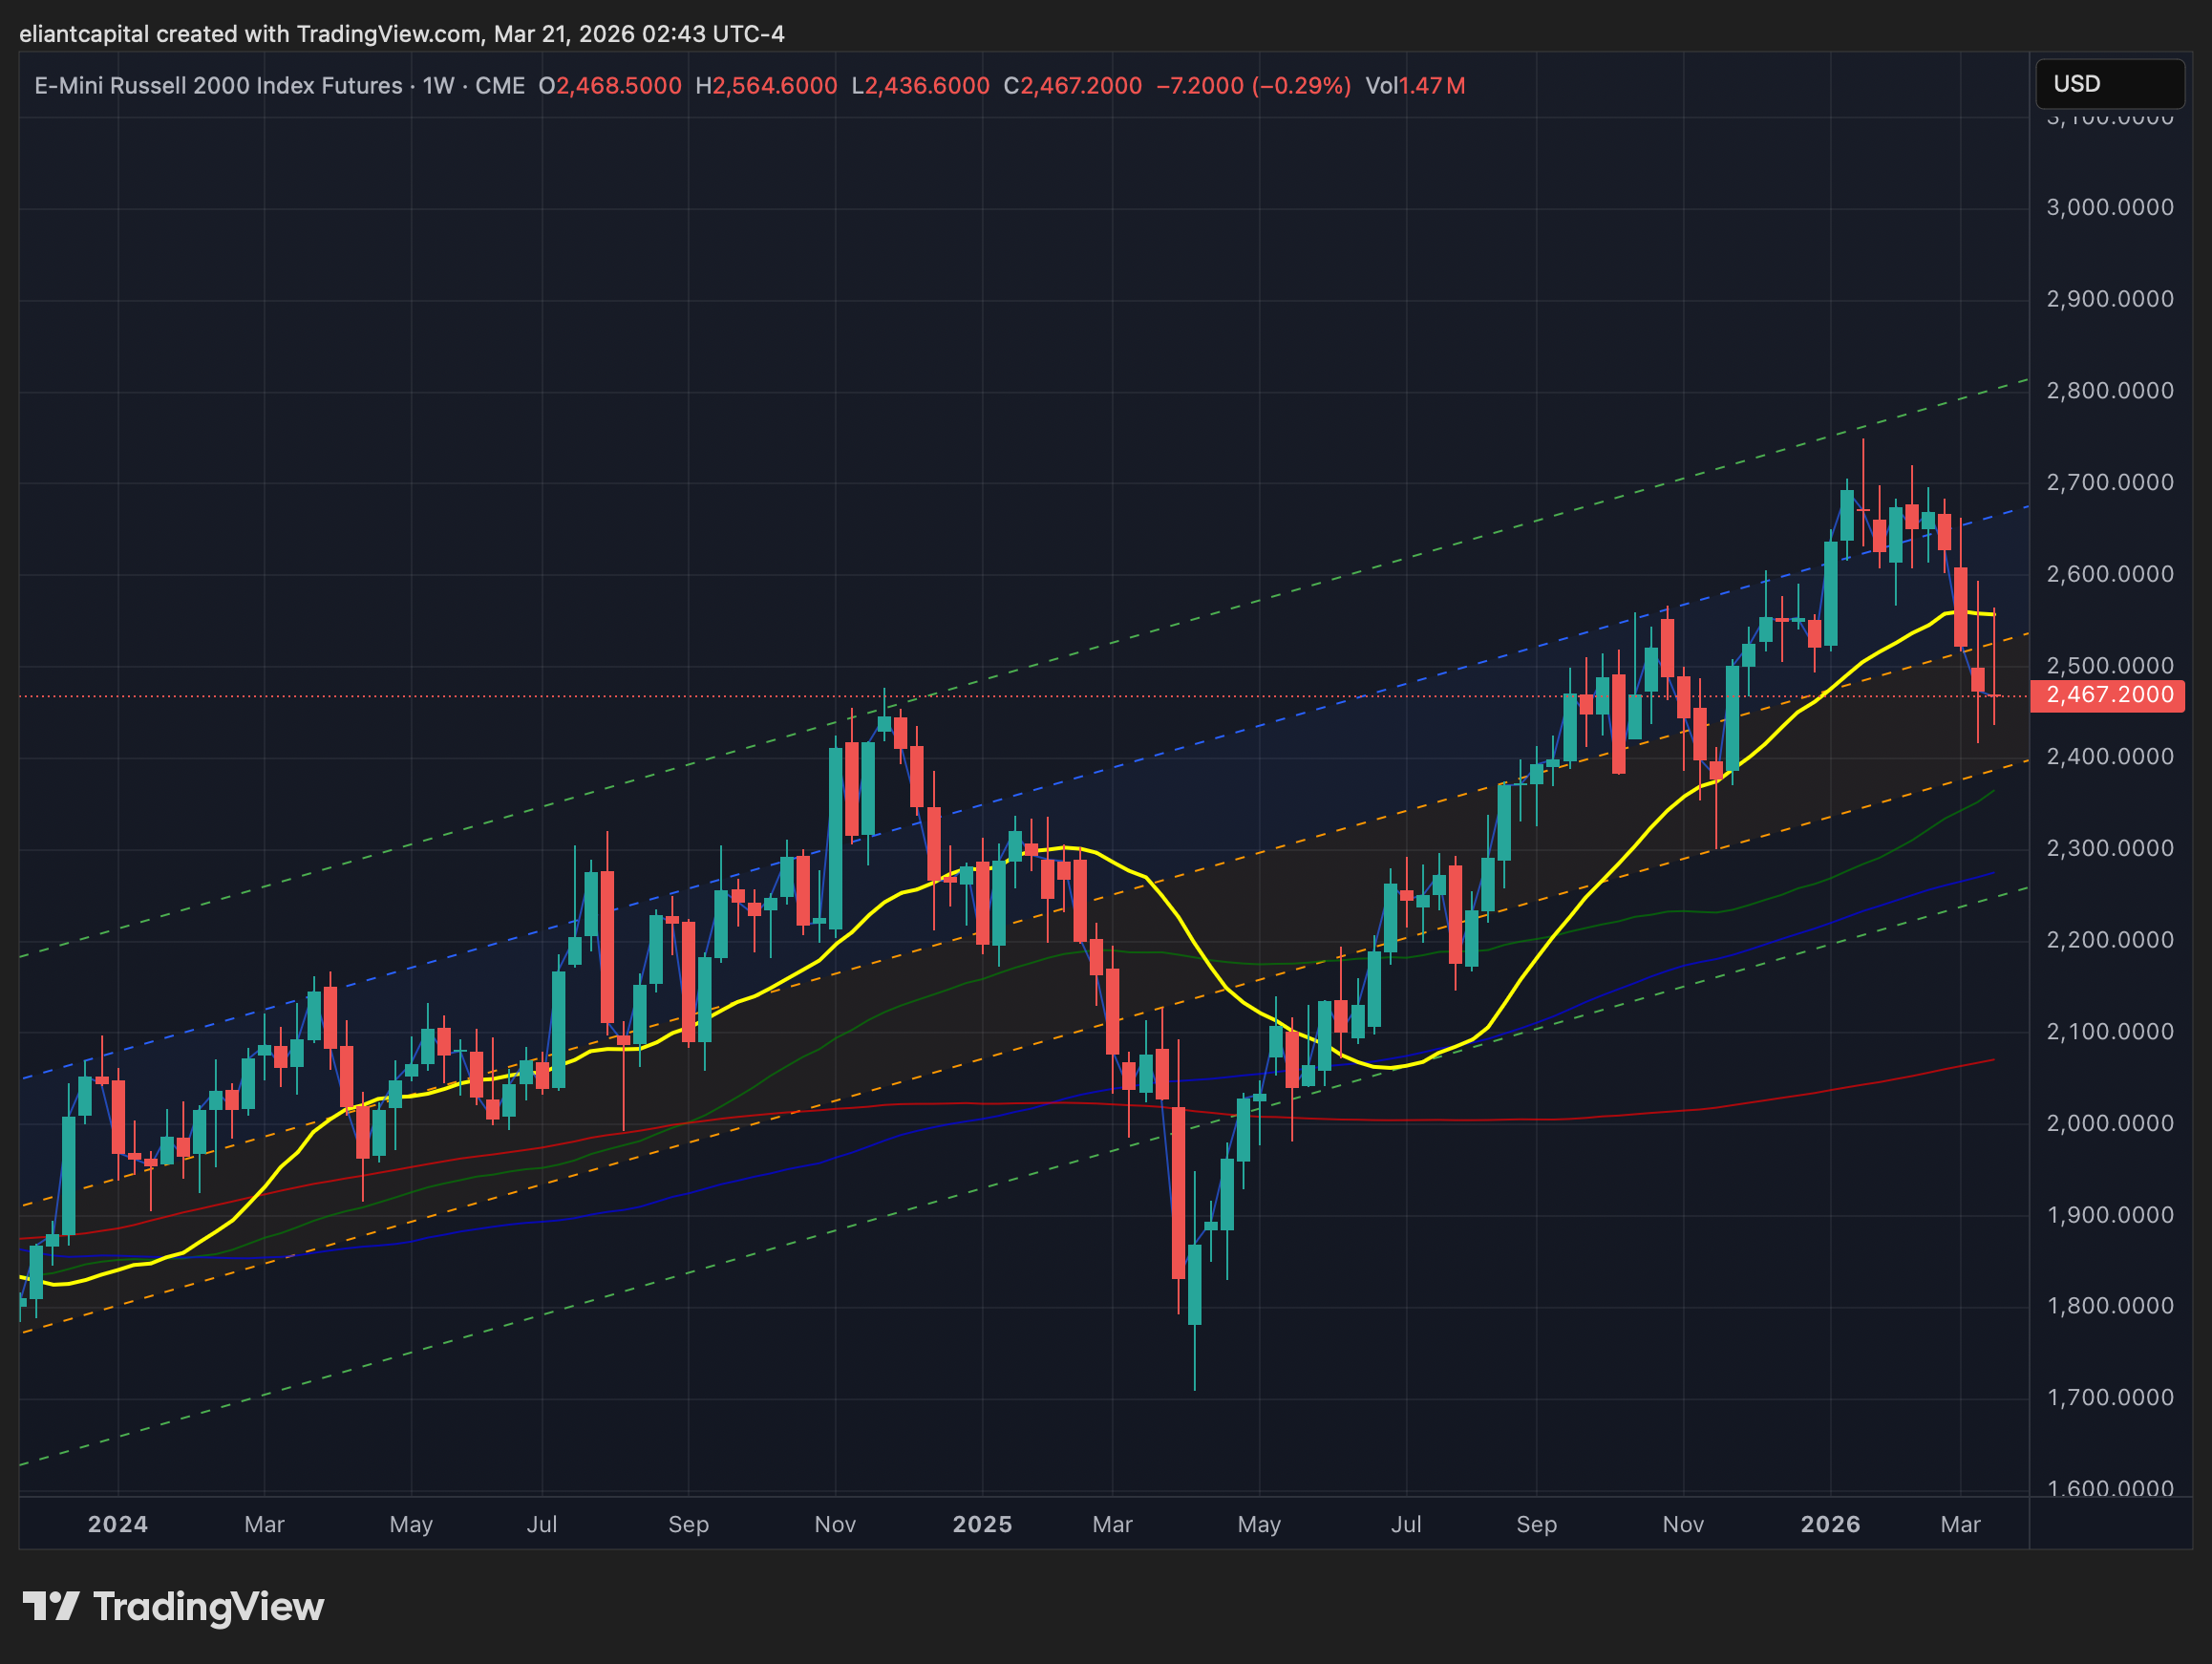
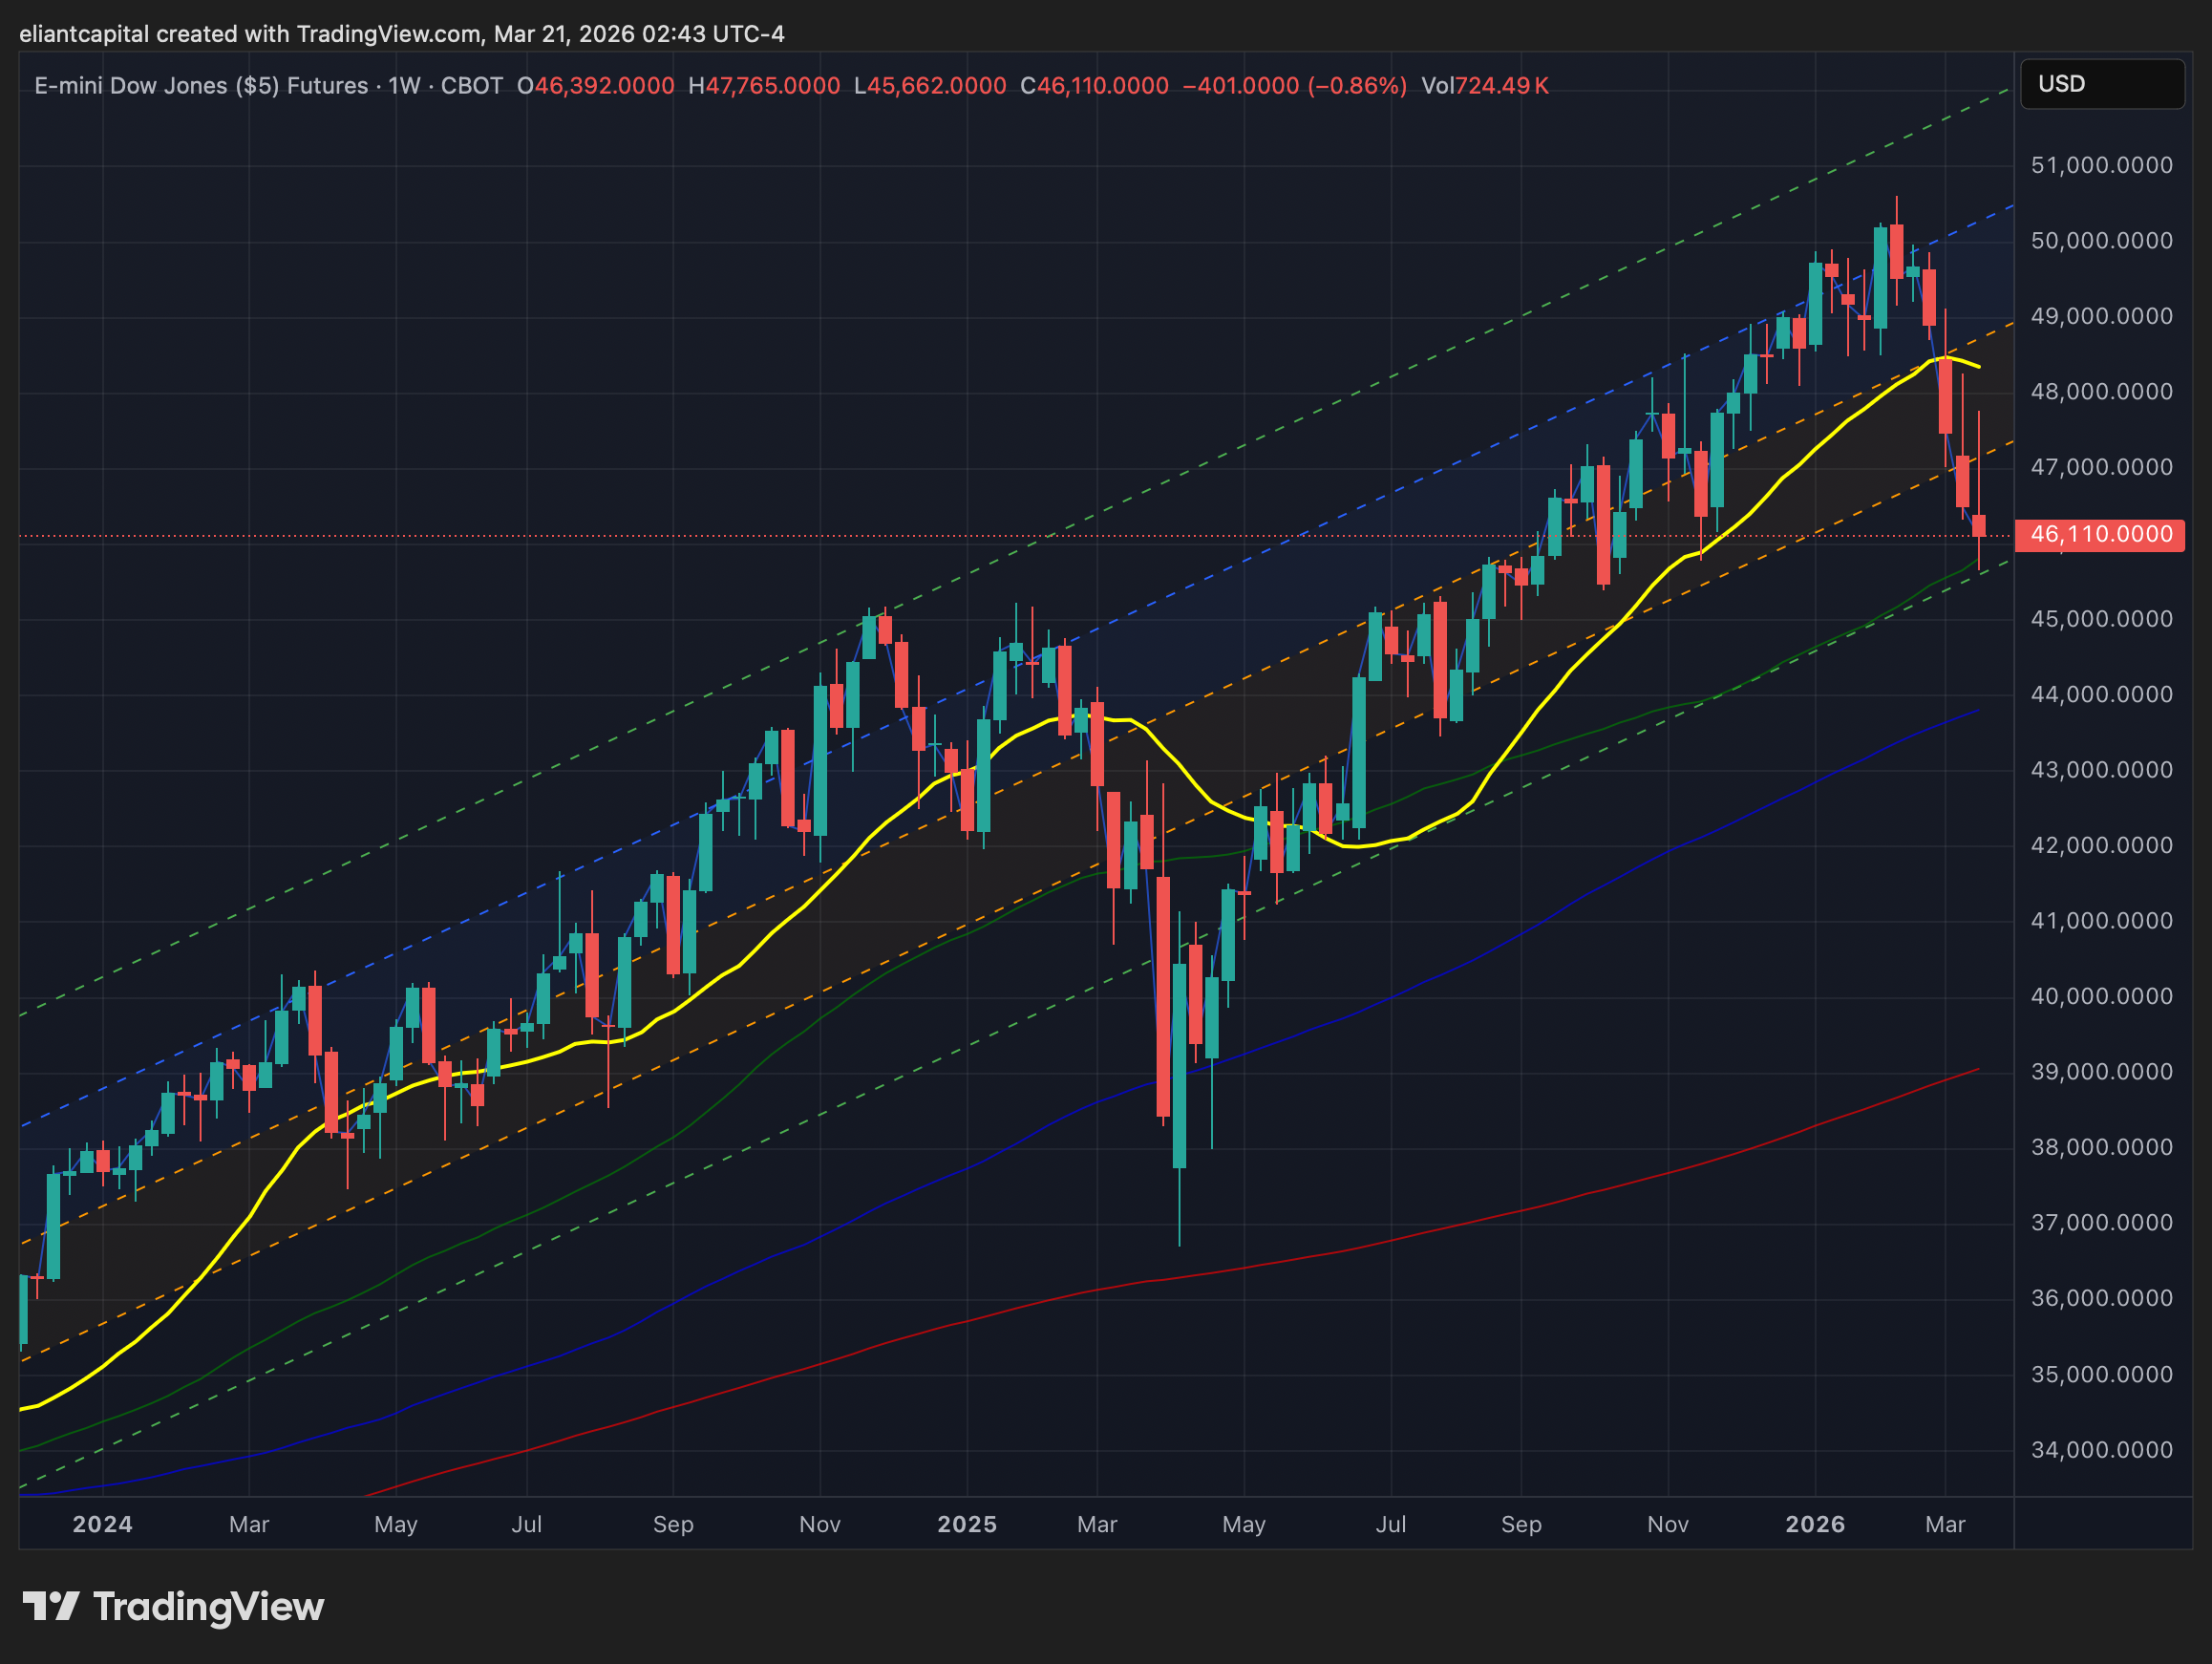
Small caps, surprisingly enough, were the ‘best’ performing of the indices on the week, yet still closed lower by 177bps, whereas the Dow was the worst performing index on the week, closing lower by just over 220bps.
- Economic Data for the Coming Week:
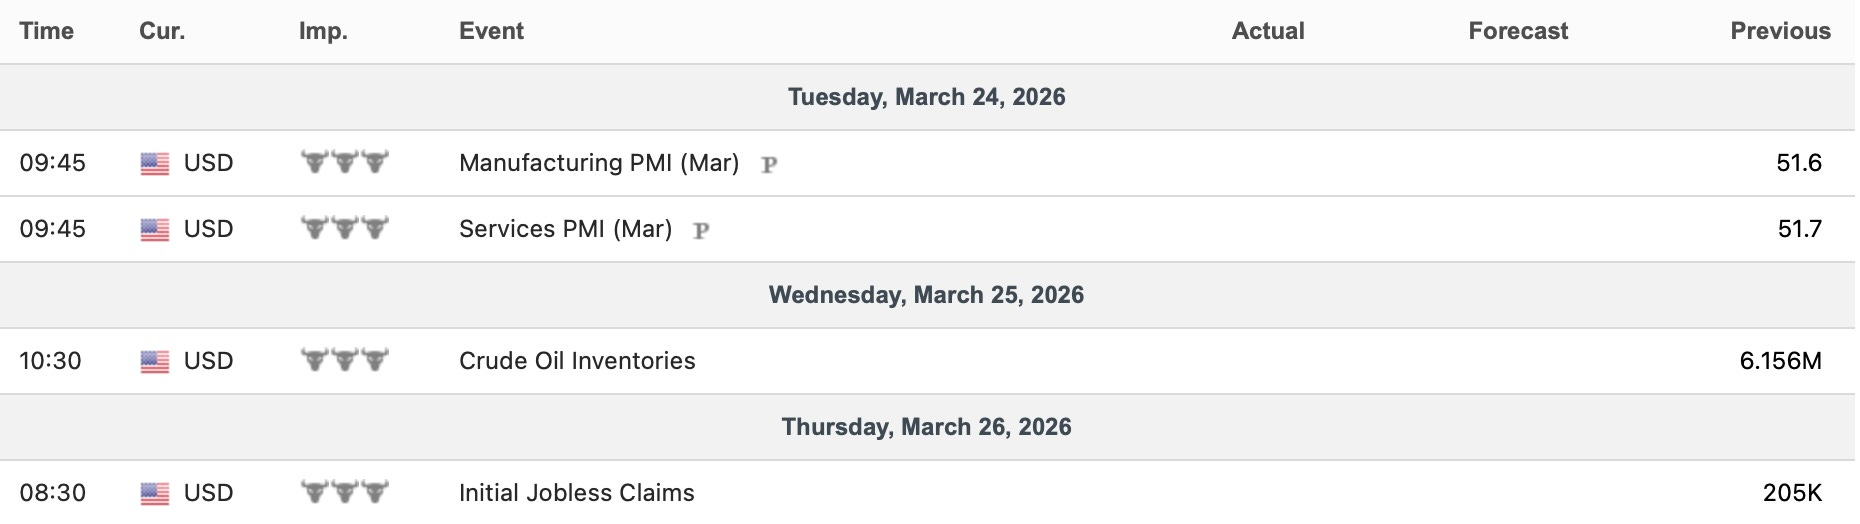
In regard to economic data into the upcoming week, aside from the continued geopolitical concerns, it’s a fairly quiet week ahead with just some smaller, scattered datapoints. However, PMI #’s on Tuesday, given the strong year-to-date trend thus far, will be interesting to watch to see if that recent momentum can continue.
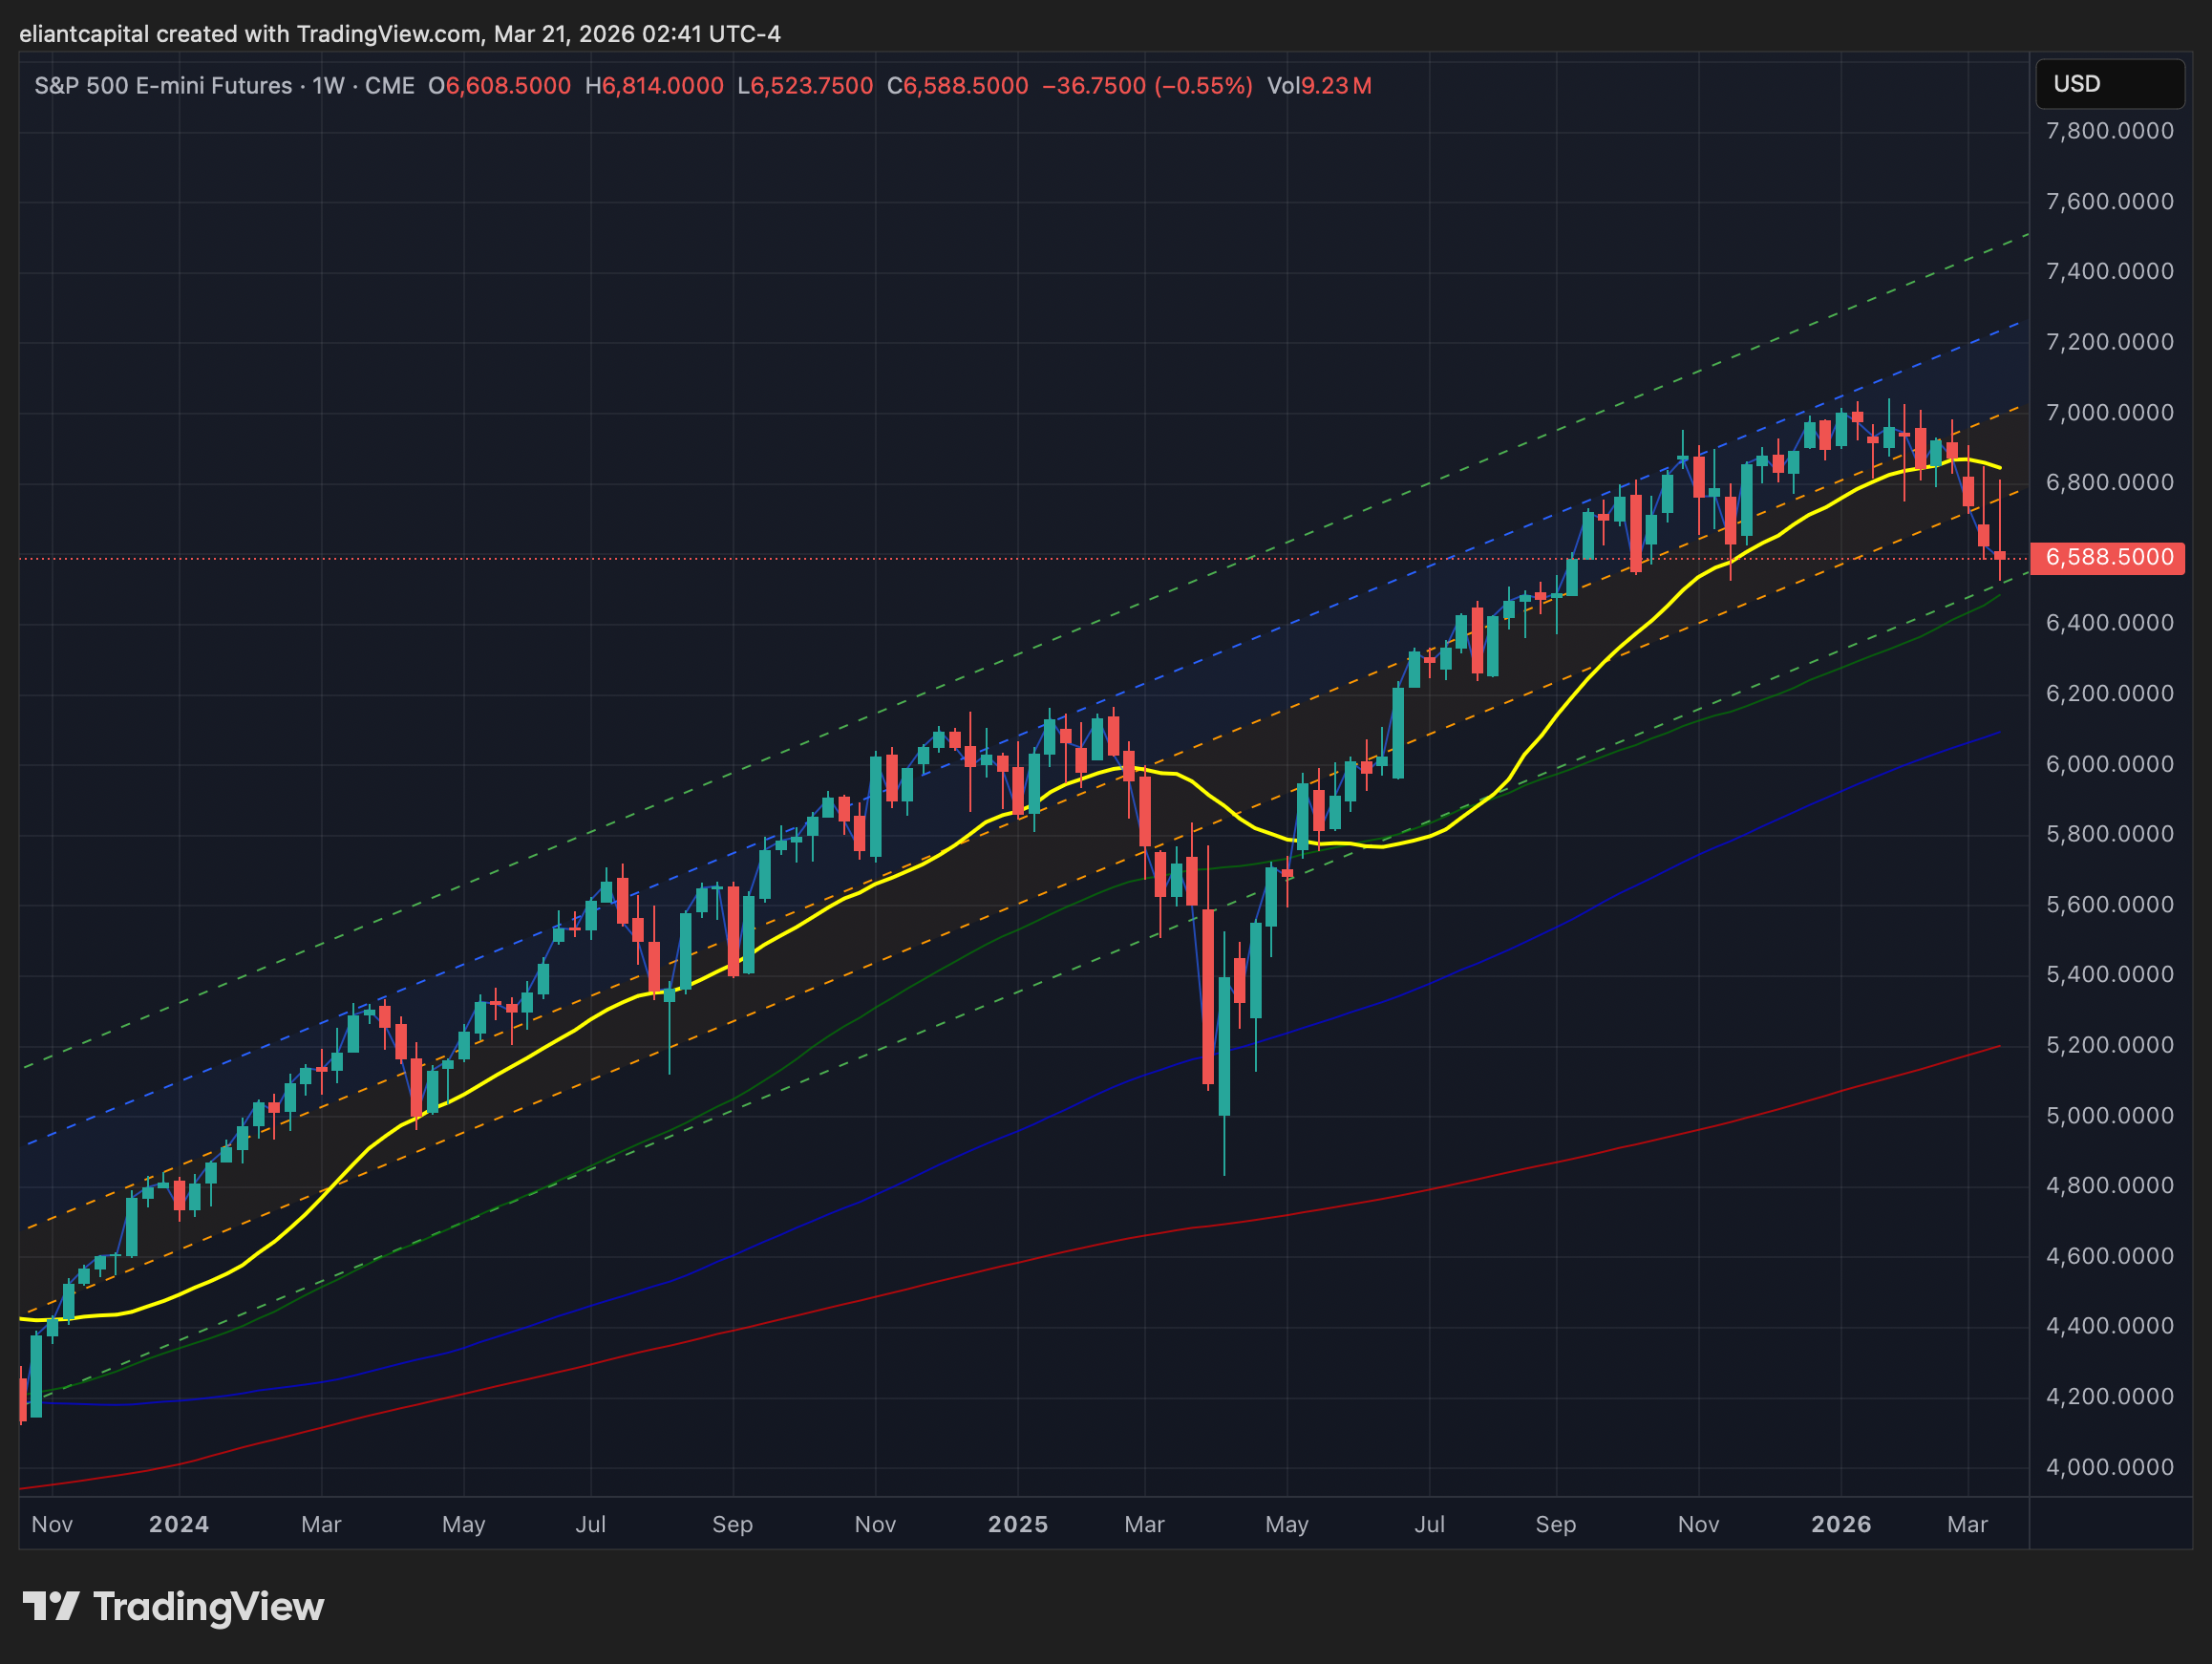
- STD Channels on Indices for Perspective: Weekly TF
- SPY
- QQQ
- IWM
- DJIA
Since starting this Substack back in June of ‘23, between individual names / tactical trades / baskets, we have netted a 169.38% return whilst in the same period, the Q’s have returned 65.18% / Spooz has returned 55.21% / Dow has returned 41.26% & Small-caps have returned 38.50%, so nice outperformance against all the indices whilst having a 81.8% win rate, averaging a 28.14% return on realized gains / winners & a 15.49% loss on realized losses / losers.
Looking forward to the future & continued success through ‘26.
And for anyone who wants to follow an actively managed portfolio in real time:
I’ve joined Plutus as the cleanest, day-to-day way to track an actively managed portfolio in real time. It’s a live dashboard that’s broader, more diversified, actively managed by me, & updated continuously.
The Eliant Flagship is published on RunPlutus.
Once your Plutus account is approved, you’ll have the option to allocate right away. If you do, it’s straightforward: create an account, link your brokerage (Available only for IBKR at this time), & select the Eliant Flagship (or any of the baskets I’ve built). Your money stays in your account, and trades, position changes, and rebalances are replicated automatically so there’s nothing manual to manage. The idea is to make it easier to access an actively managed portfolio run by me without the overhead of traditional fund structures or high minimums, whilst you keep full custody of your assets & I stay focused on research, positioning, and portfolio construction.
And just to be clear, NOTHING is changing with Substack. It’ll stay exactly what it’s always been since we originally launched in the Summer of ‘23: where I share the thinking, research, & select trades behind my personal PA, along with ongoing commentary across all markets.

For those who may have missed, we published our ‘2026 Outlook’ which has a plethora of coverage on a wide range of topics / themes as ‘26 kicks off after coming off a strong ‘25 & for those whom would like to go back & read the report, I included it just below:

Earlier in 2024, we launched a series titled Educational Pieces, covering a wide range of topics, many of which were suggested directly by you all (4-Part Series).
For those who may have missed the first installment, it covered topics including:
General background / knowledge on all option strategies
In-depth talk on risk / reversals & how to go about expressing / utilizing them
Options Structuring
When to used naked calls / puts vs. spreads
Choosing expiration dates
Identifying key pivots / supports / resistance zones
General briefing on stock gaps
What to look for in regards to fundamentals
Implementing fundamental / macro / technicals into a trade
Hedging
Creating risk/reward setups
Taking profits / managing losses
Overall Process
Book recommendations
A link to the original Educational Piece can be found here .
Given the positive feedback and how useful many of you found the first installment, we followed up with Educational Piece: Part Deux earlier in 2025 & for those who may have missed, a link to the piece can be found here & we then went on to release Educational Piece: Part Trois which can be found here.
And finally, the most recent installment, Educational Piece: Part Quatre, can be found here.
‘Risk management is the silent prerequisite for compounding & true wealth is built not by chasing the highest returns but by ensuring the survival necessary to realize them.’

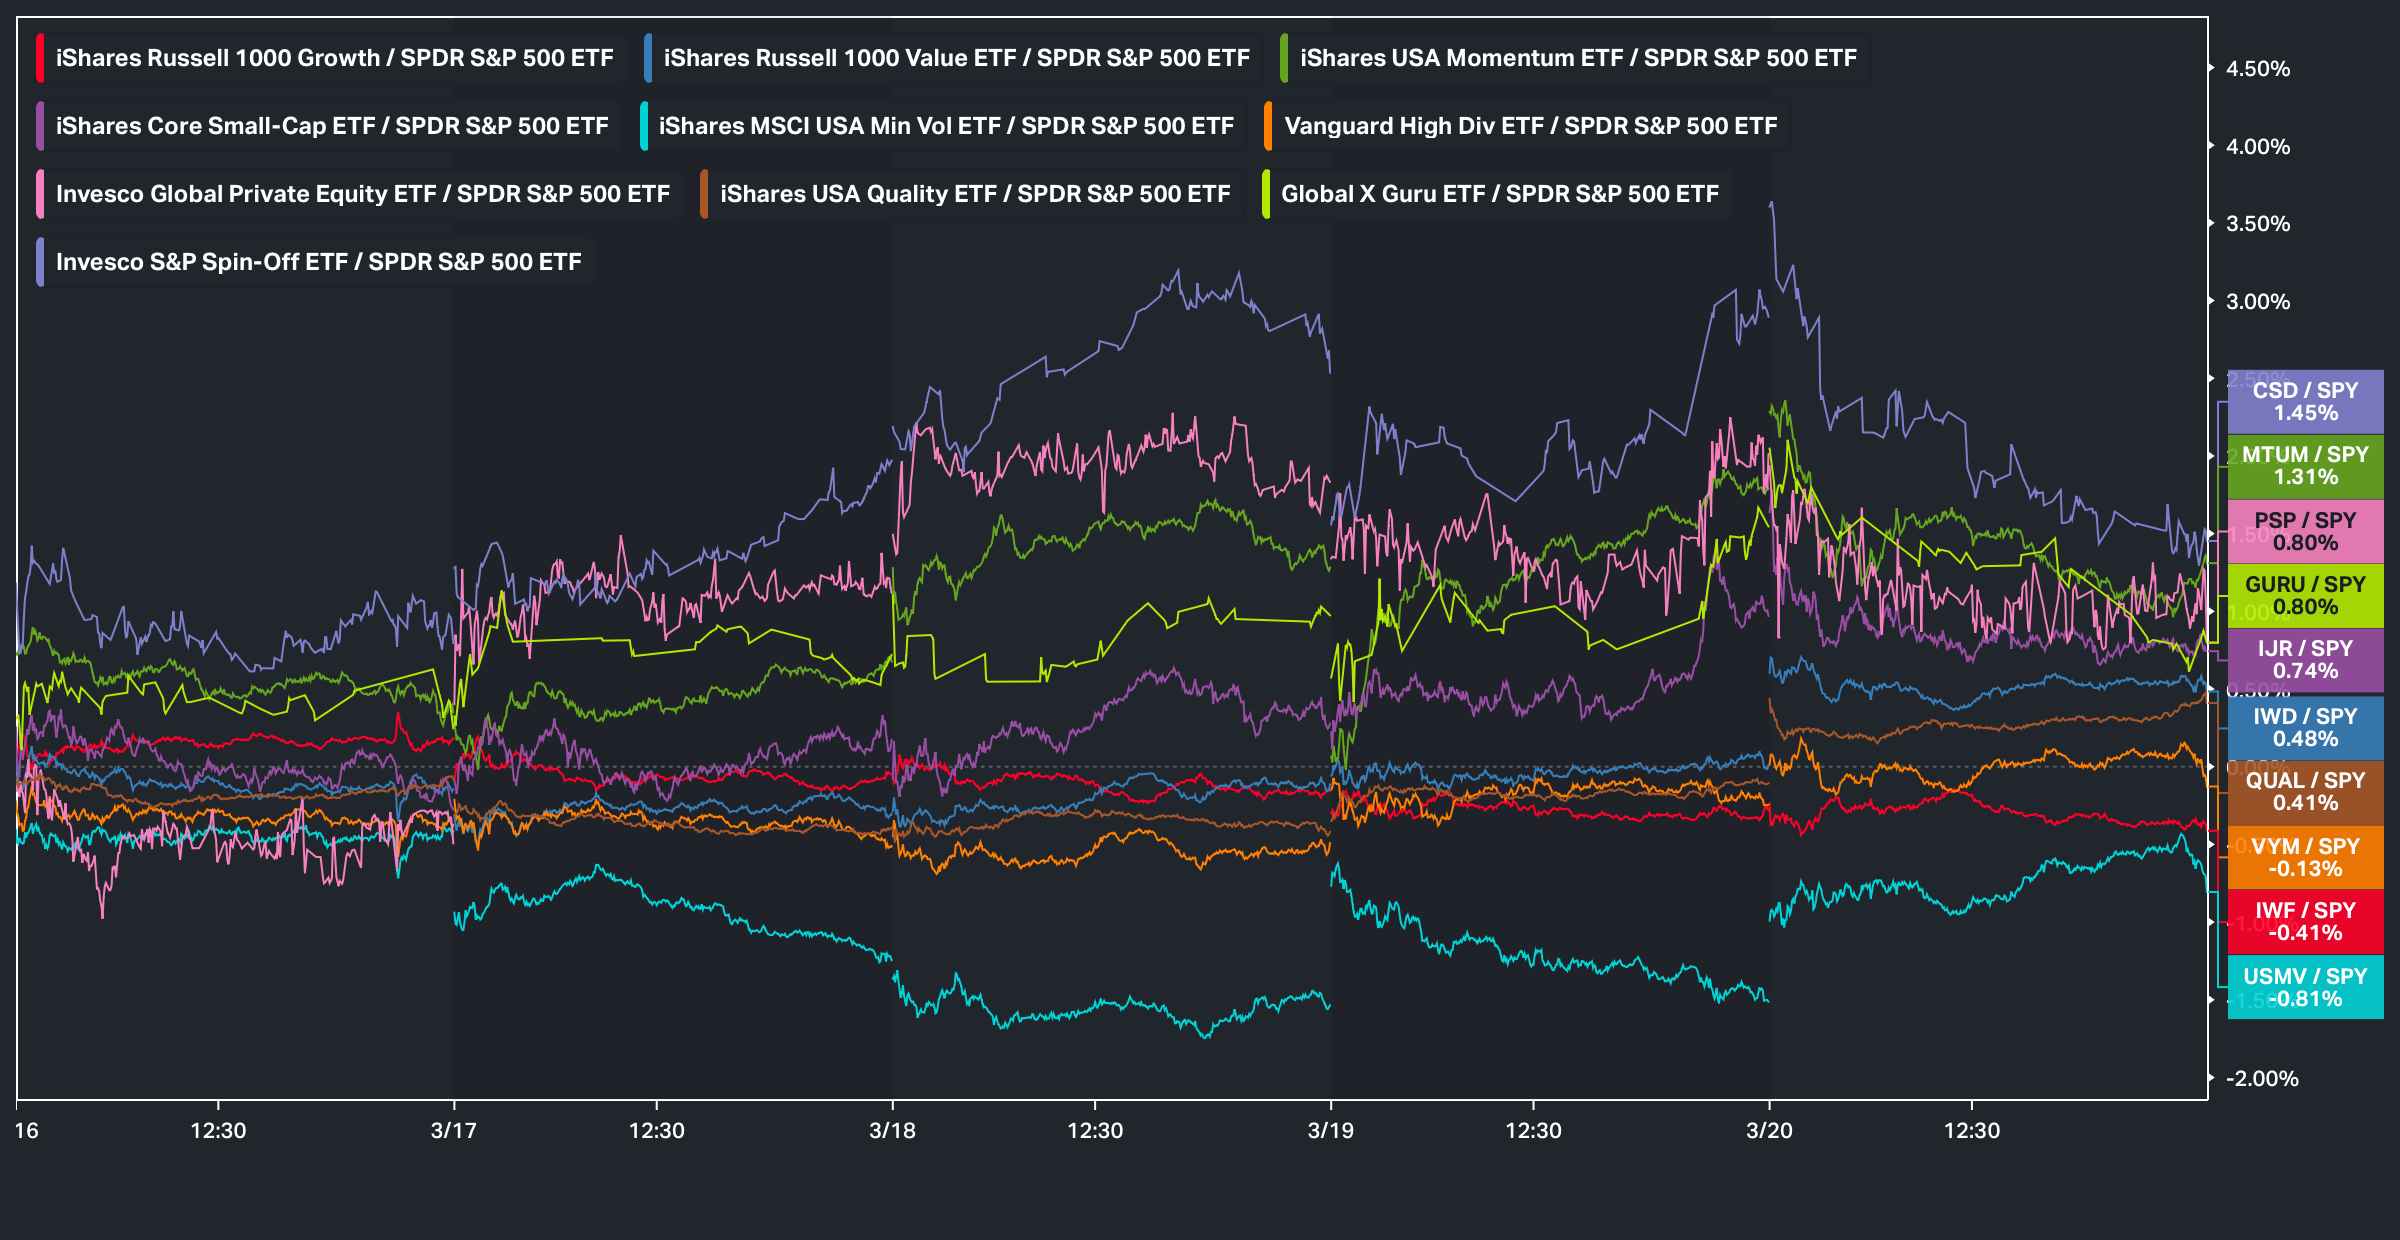
Before we jump into the week ahead, looking back at this past week, in regard to factor performance, spin-offs along with momentum were among the best performing groups, whereas interestingly enough, low-volatility was the worst performing factor on the week, followed by growth as the second worst performing factor:
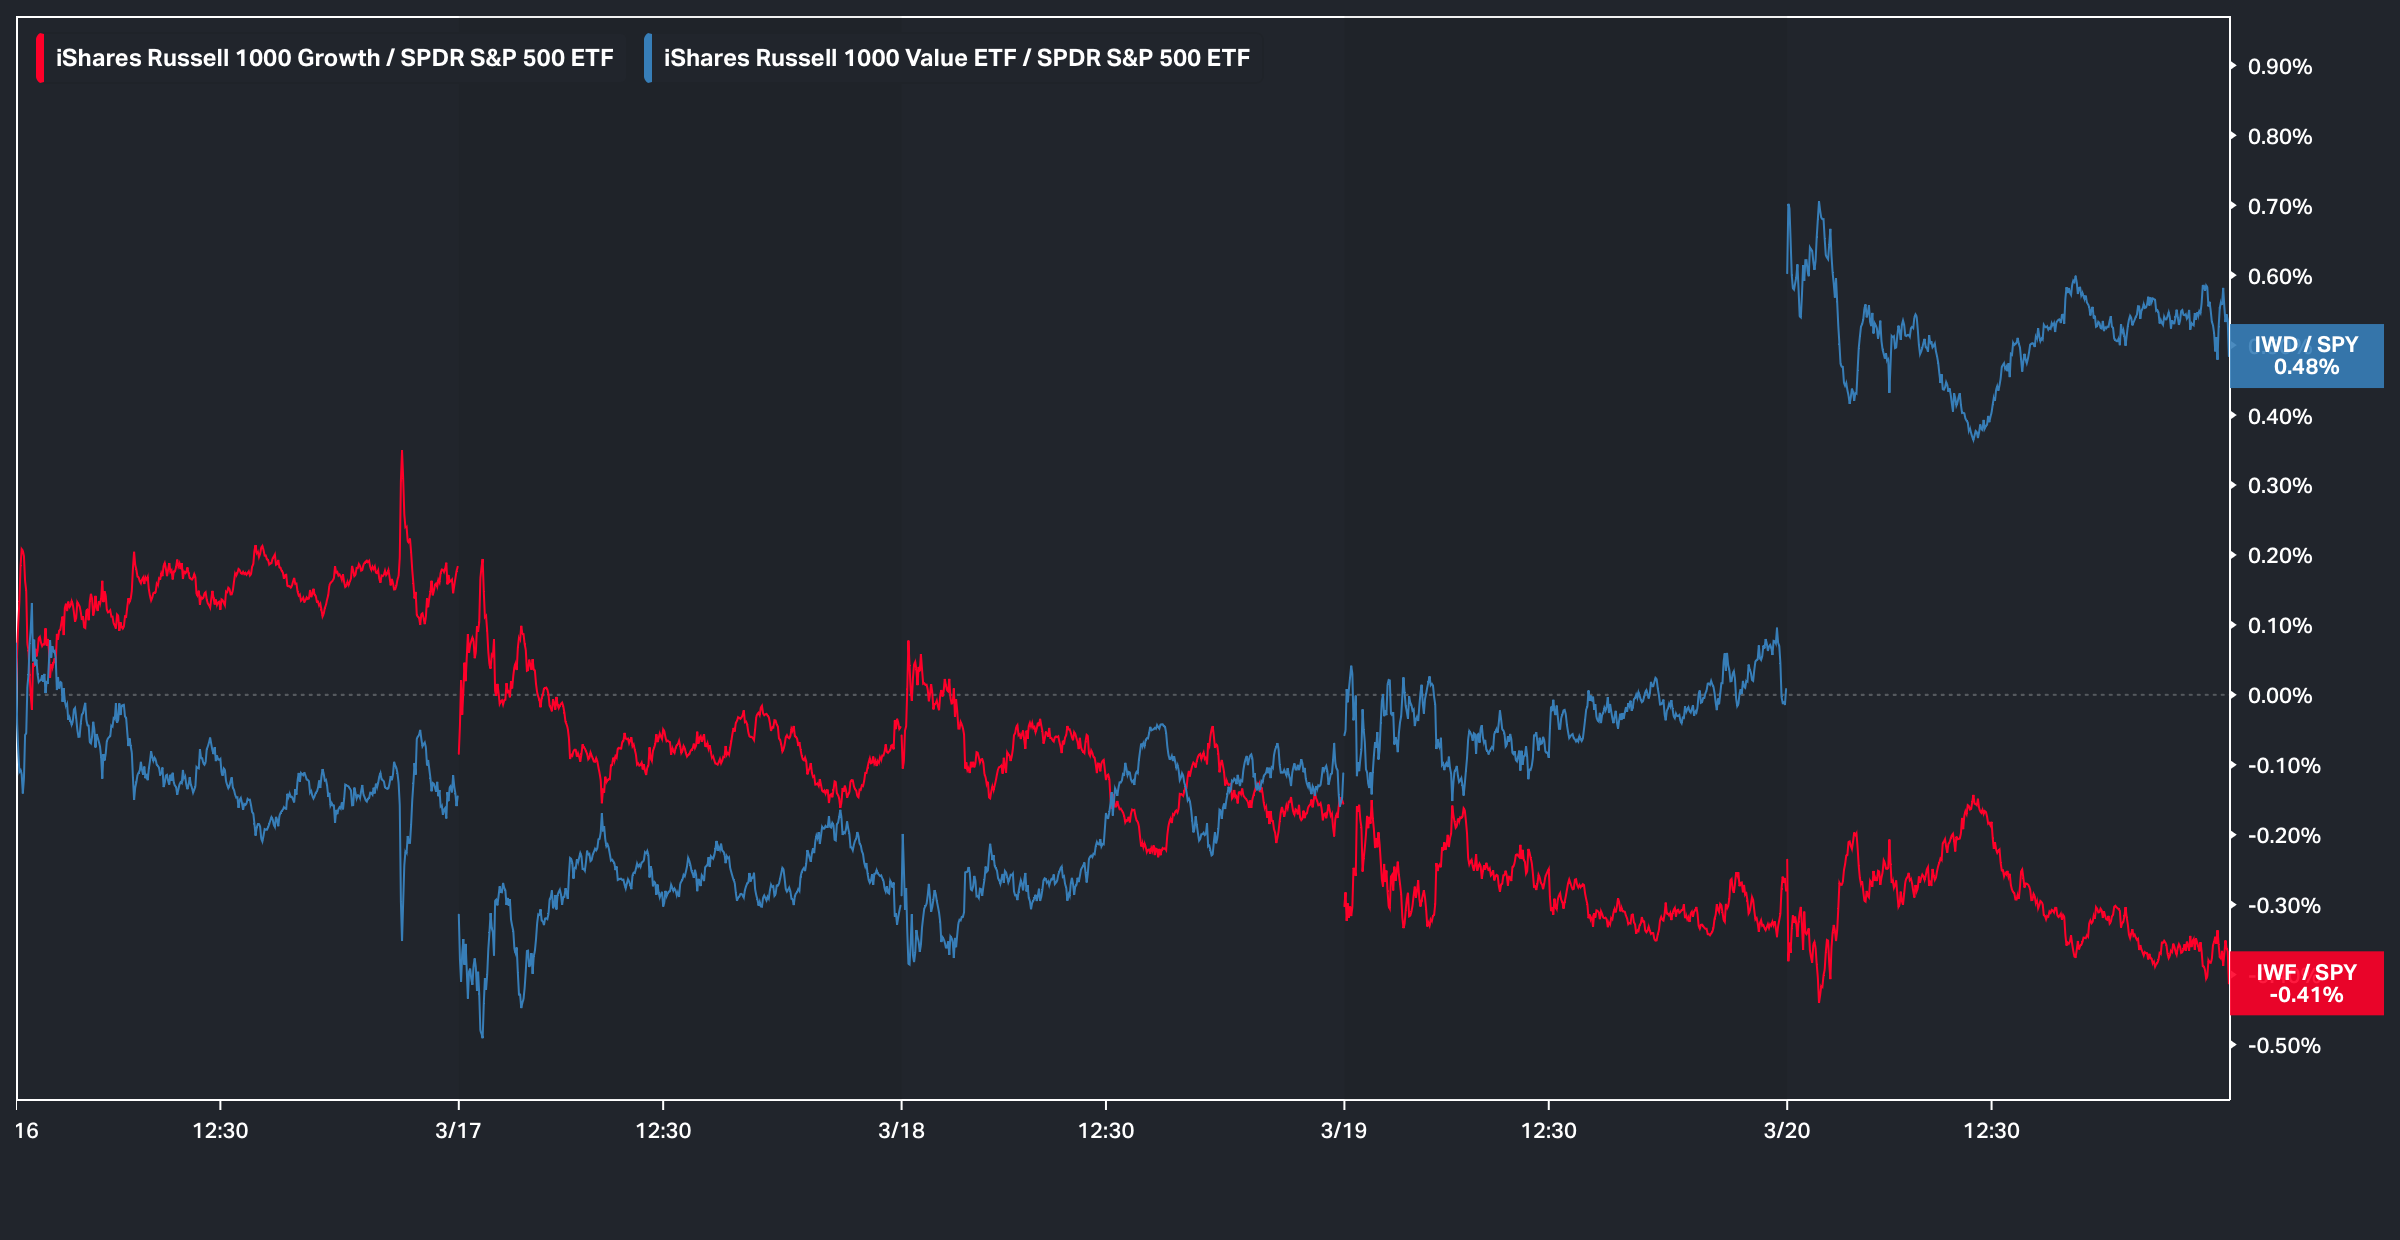
And on the week, with the relative risk-off action aside from the initial rally earlier in the week following Trump’s announcement of the U.S. looking to secure Hormuz by forming a coalition, value ended up outperforming growth, with the spread closing just under 90bps between the two groups:
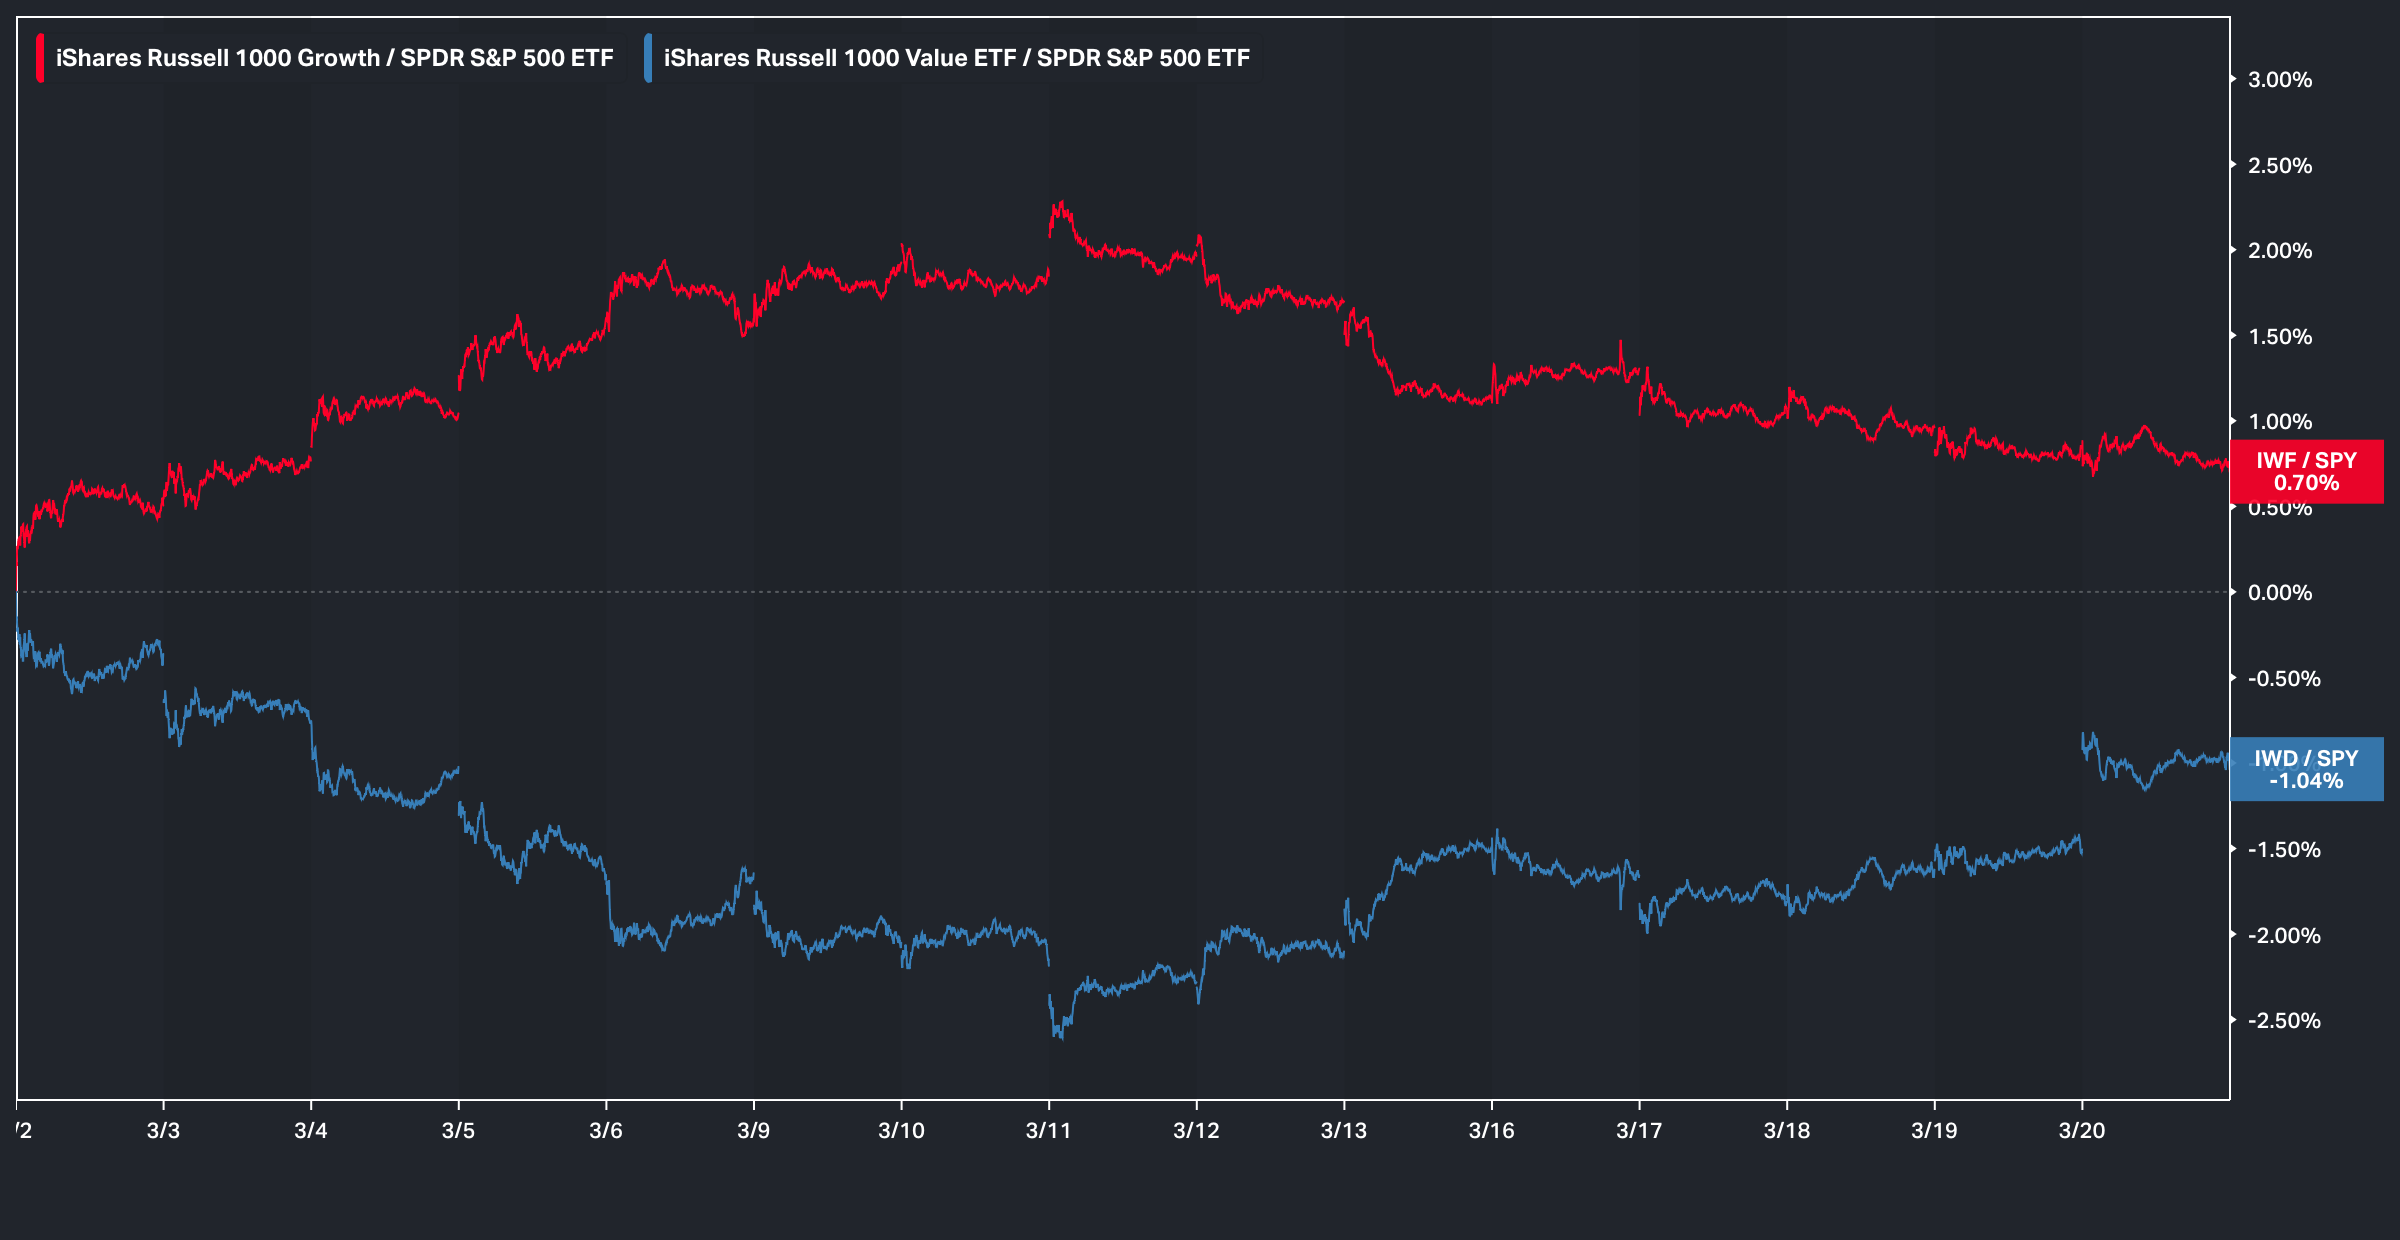
That said, since the war first started, surprisingly enough growth is outperforming value by quite the margin, although the spread has certainly narrowed from the initial peak of 450bps and now sits just over 170bps between the two groups:
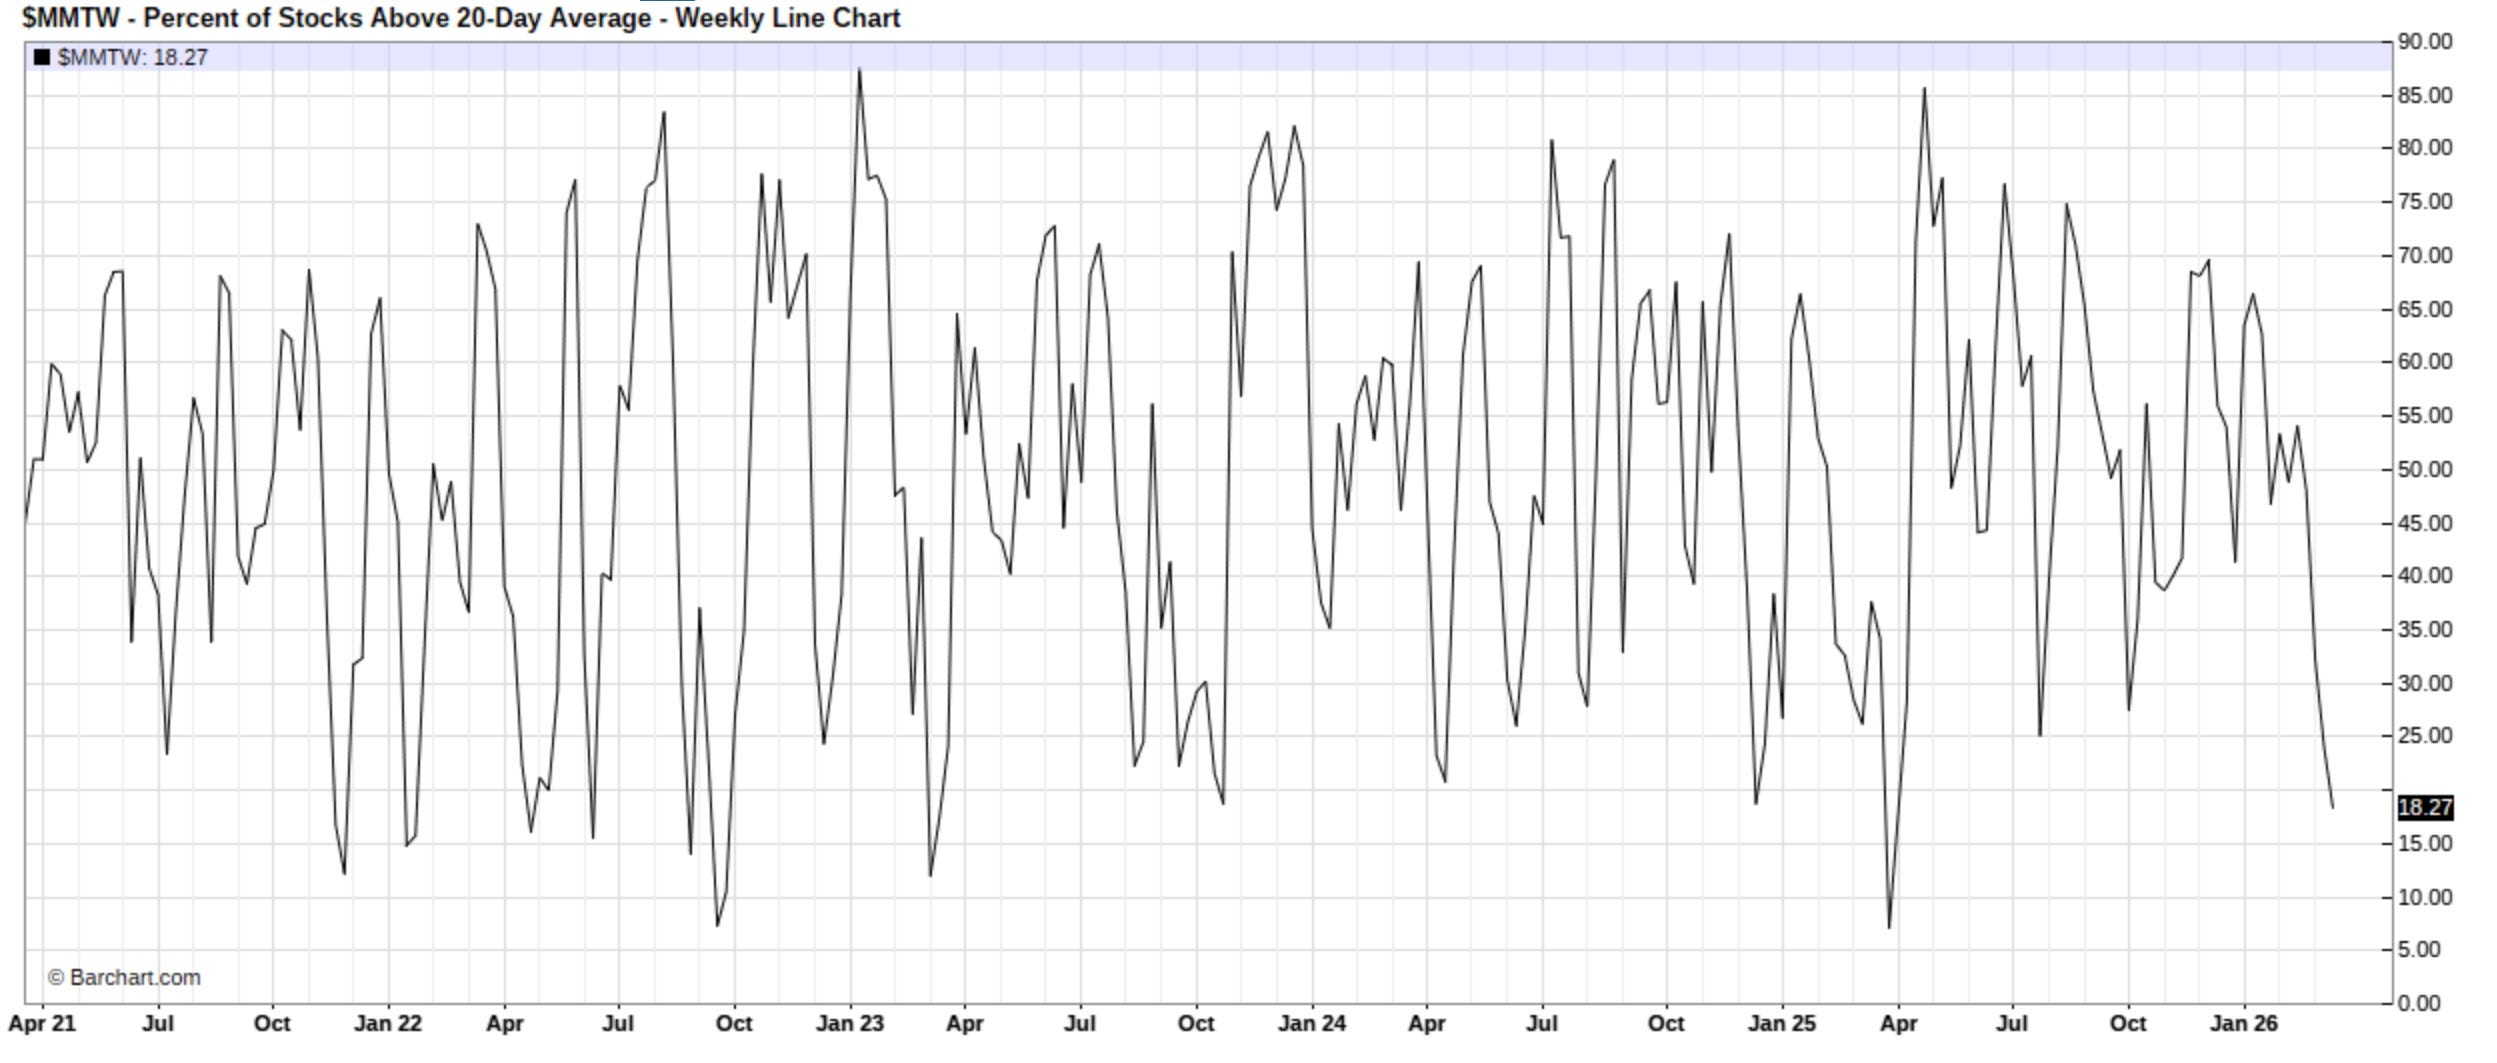
Moving along, with the risk-off action throughout the latter part of this past week and the indices well into corrective territory, just 18% of stocks are currently sitting above the 20D, putting us firmly into oversold territory and starting to encroach on ‘washout’ levels (For example, the % of stocks above the 20D during the Liberation Day selloff bottomed in the single-digits, so we’re getting close).
And a similar point can be made on a broader timeframe, as roughly 22% of stocks remain above the 50D, which again emphasizes that the market is firmly within oversold territory, and while conditions are not yet at complete ‘washout’ levels, we’re certainly getting close (Major bottoms over the last five years occurred at 12.5% in October ‘22, 15% in November ‘23, and 10% in April ‘25)
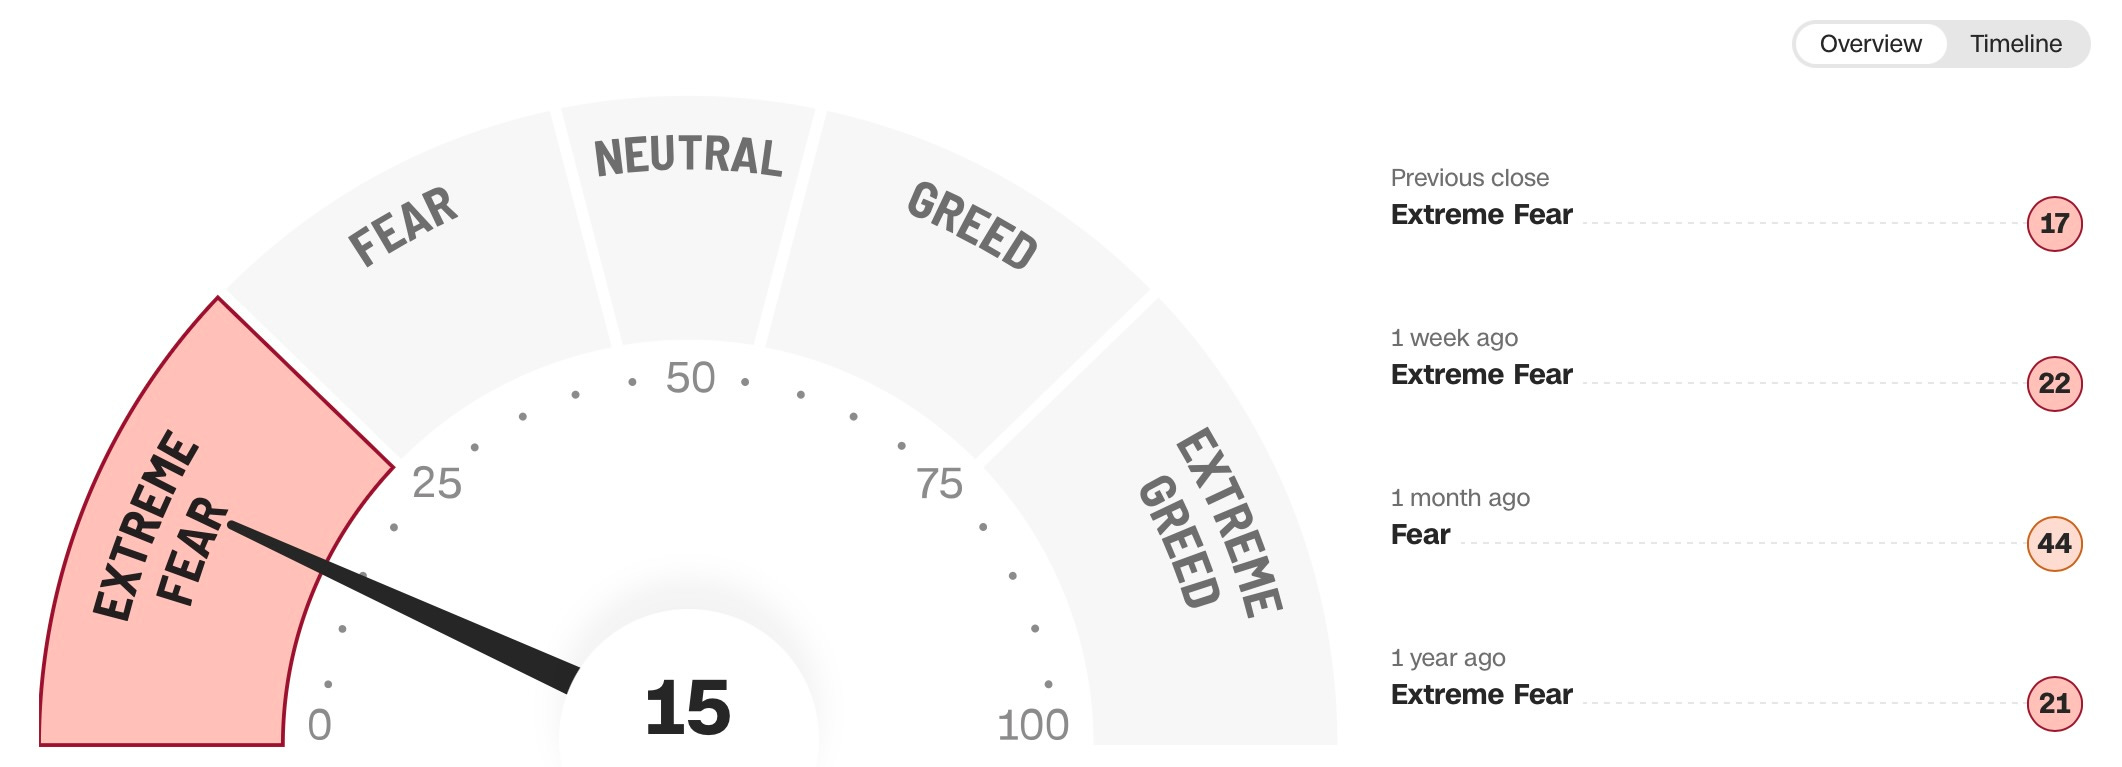
And continuing on that note, with the indices all firmly within corrective territory and Spooz itself sitting 7% off all-time highs, we’re now well into ‘extreme fear’ territory, although for a complete washout in sentiment, we’ve typically seen single-digit readings within that range, so not quite there yet but certainly deep into oversold territory:
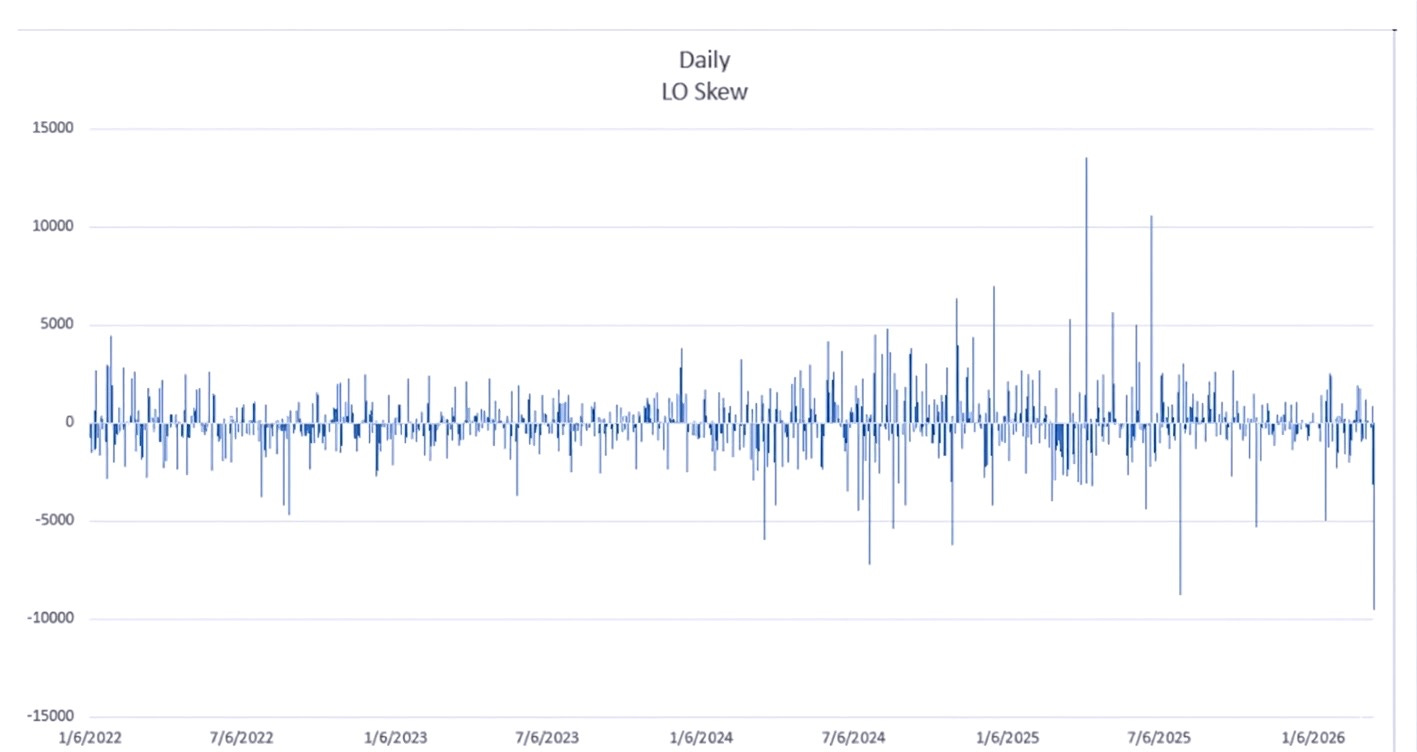
Moving to the indices, Goldman noted that long-only funds net sold -$9.6bn across their floor on Thursday, running a 50% sell skew. This marked the largest day of net selling in their dataset going back to ‘22 and a 5-sigma event, surpassing the previous record of -$8.7bn on July 31, ‘25. And notably, the supply was broad-based and spread across all sectors.
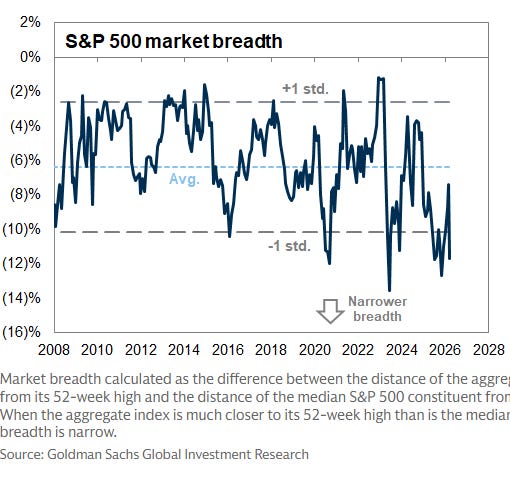
Another interesting datapoint is that S&P 500 52-week market breadth has sharply declined, reflecting a growing disconnect between the aggregate index and the median stock, with fewer names driving the upside and breadth narrowing toward levels typically associated with weaker market internals. Looking back historically, excluding the current episode, there have only been around three prior instances where breadth reached similarly extreme levels:
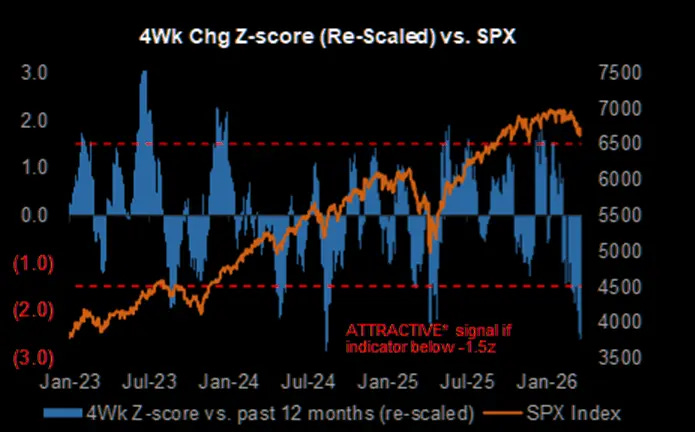
And on the note of positioning, JPM noted that their U.S. Tactical Positioning Monitor’s 4-week change has fallen to -2.6z, making it one of the most bearish readings seen over the past few years:
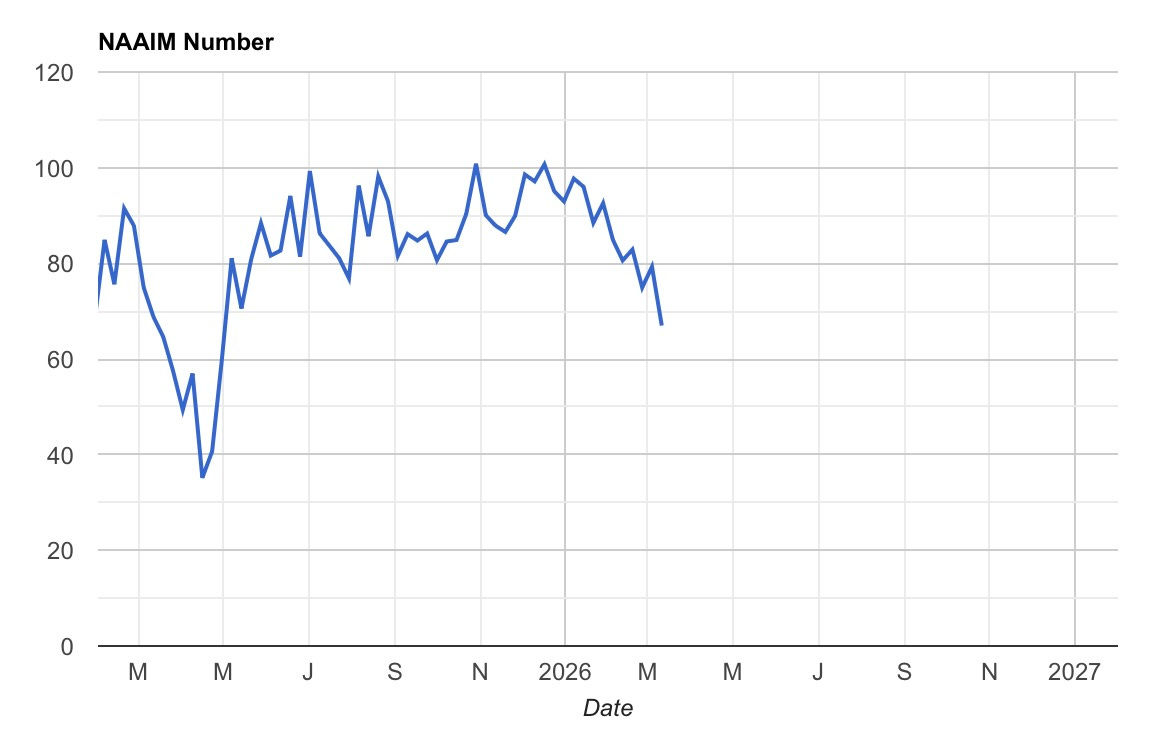
And finally, one other point worth highlighting is the sharp drop in NAAIM, which further underscores the recent de-grossing we’ve seen across equities, with equity exposure now back to levels not seen since Q1 ‘25 and not far off the Liberation Day lows: