The Week Ahead 3/29/26

Hello All,
I hope you’re all enjoying the weekend and getting some time away from the screens & wishing you all a successful remainder of ‘26.
This past week was yet another eventful one geopolitically. As the week kicked off, indices initially moved higher following an announcement by Trump that the U.S. was in talks with Iran and negotiating, alongside a suspension of attacks on energy infrastructure to help facilitate a deal. However, as the week progressed, that optimism faded amid Iran’s more hardline rhetoric and a lack of visible progress between the two sides.
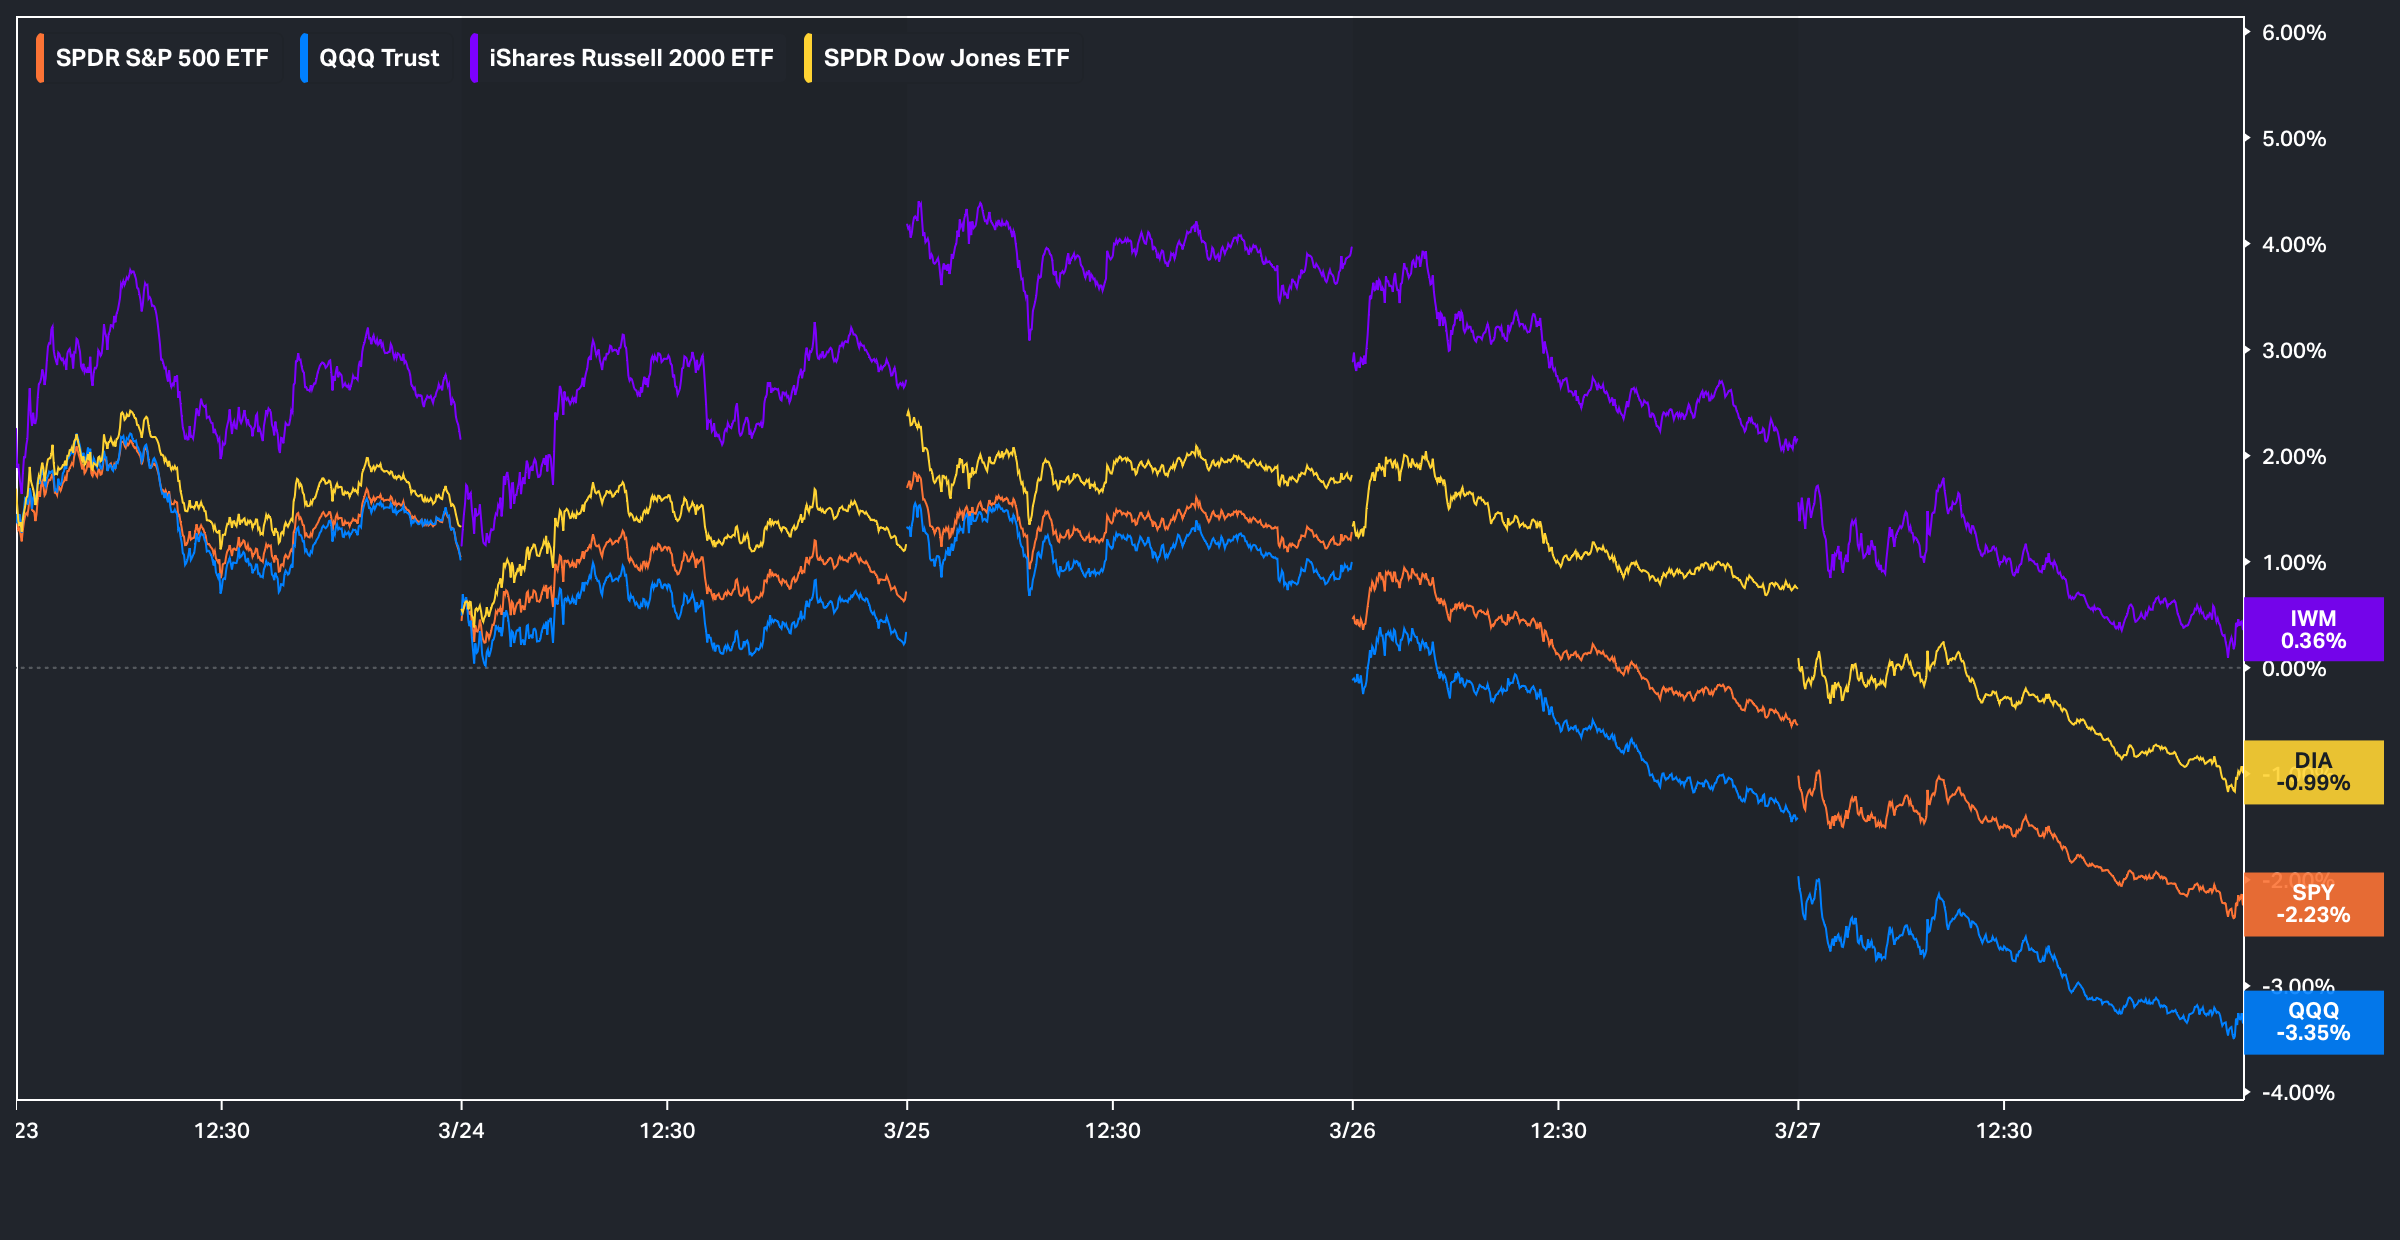
On the week, Small-caps ended up being the best performing of the indices, having closed higher by just over 30bps, whereas the Qs were the worst performer, finishing lower by just over 300bps.
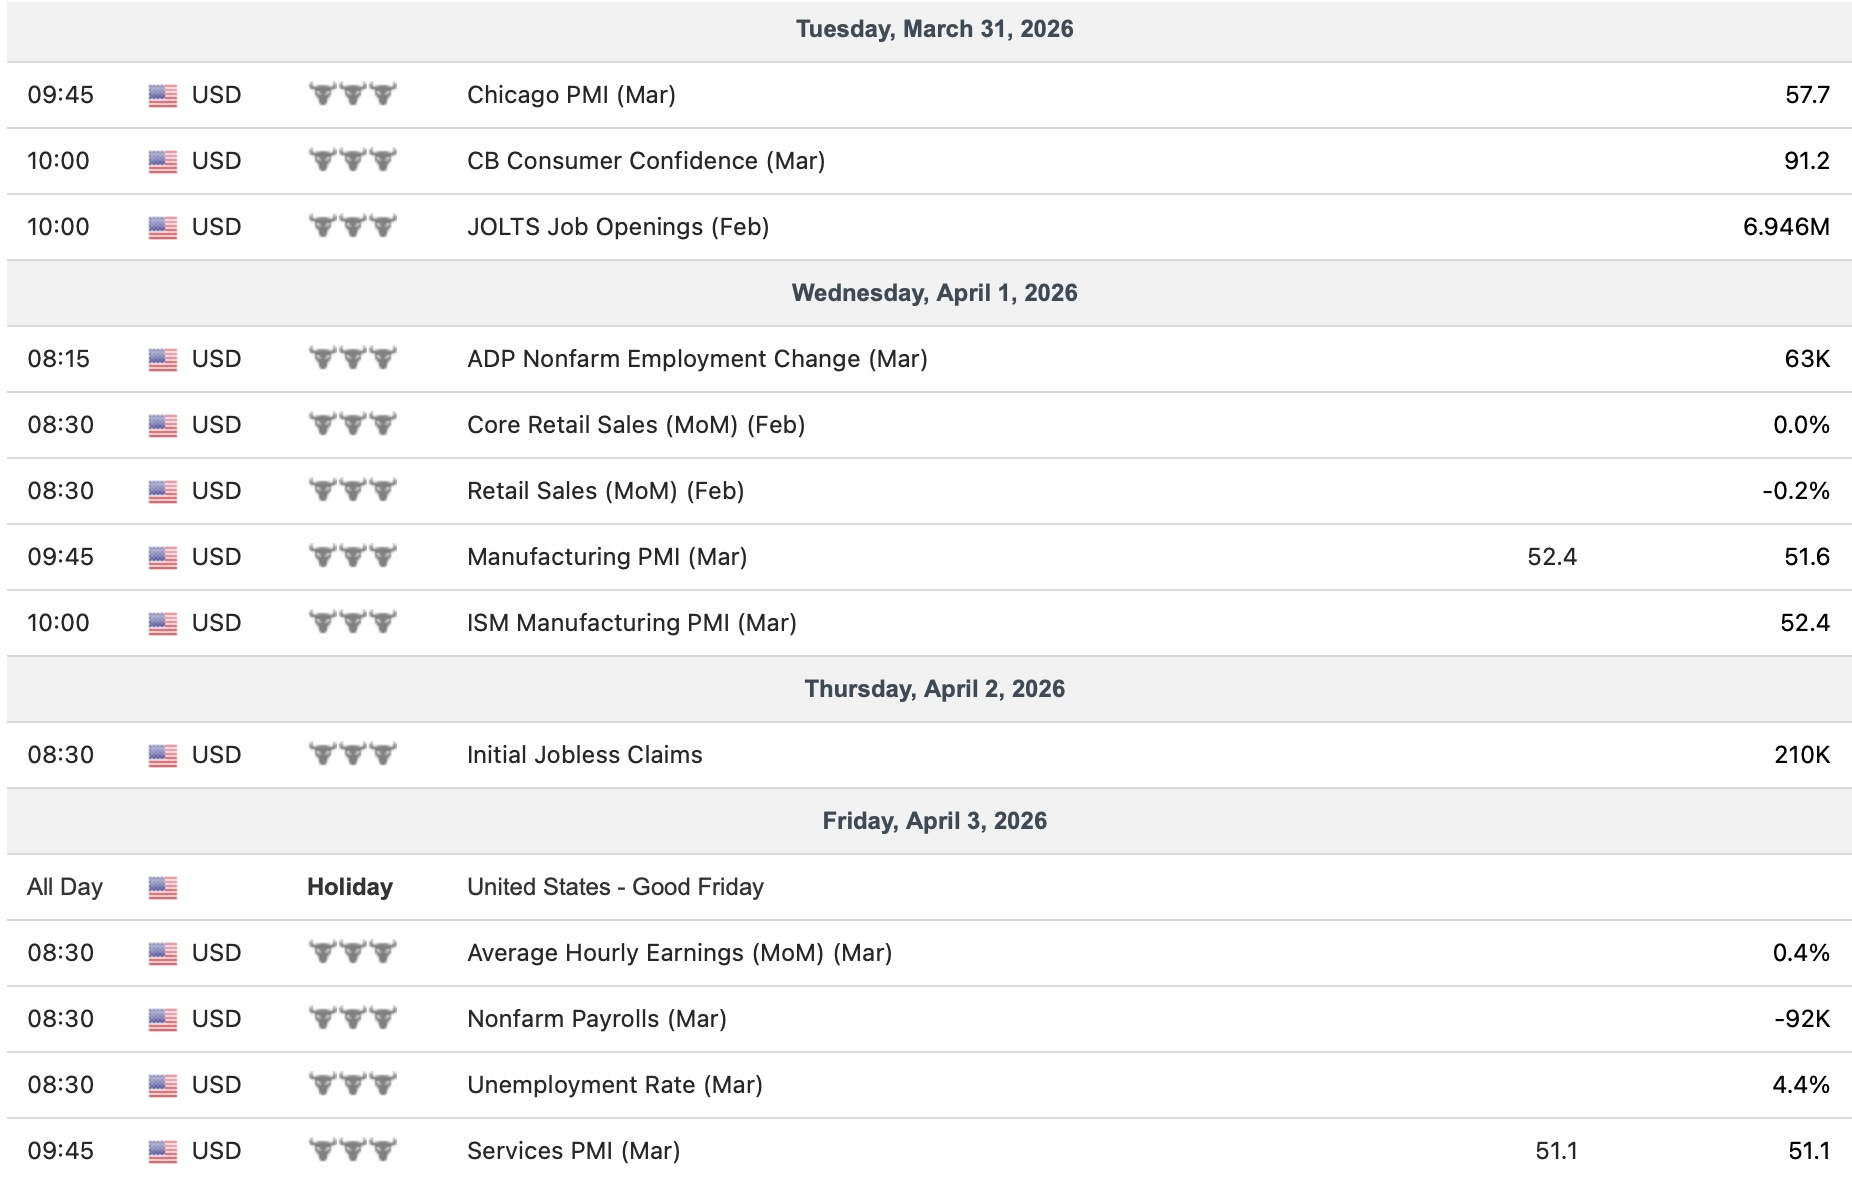
- Economic Data for the Coming Week:
In regard to economic data into the upcoming week, it will be a shortened one due to the Friday holiday, but outside of geopolitics, there is still a solid slate of data ahead. The most important release will be the March payrolls report, which is set for Friday & as a reminder, the February report showed a sizable loss of jobs (Although there were several caveats that distorted the headline figure) & in addition, we’ll get a mix of other labor & economic data points scattered throughout the week as well.
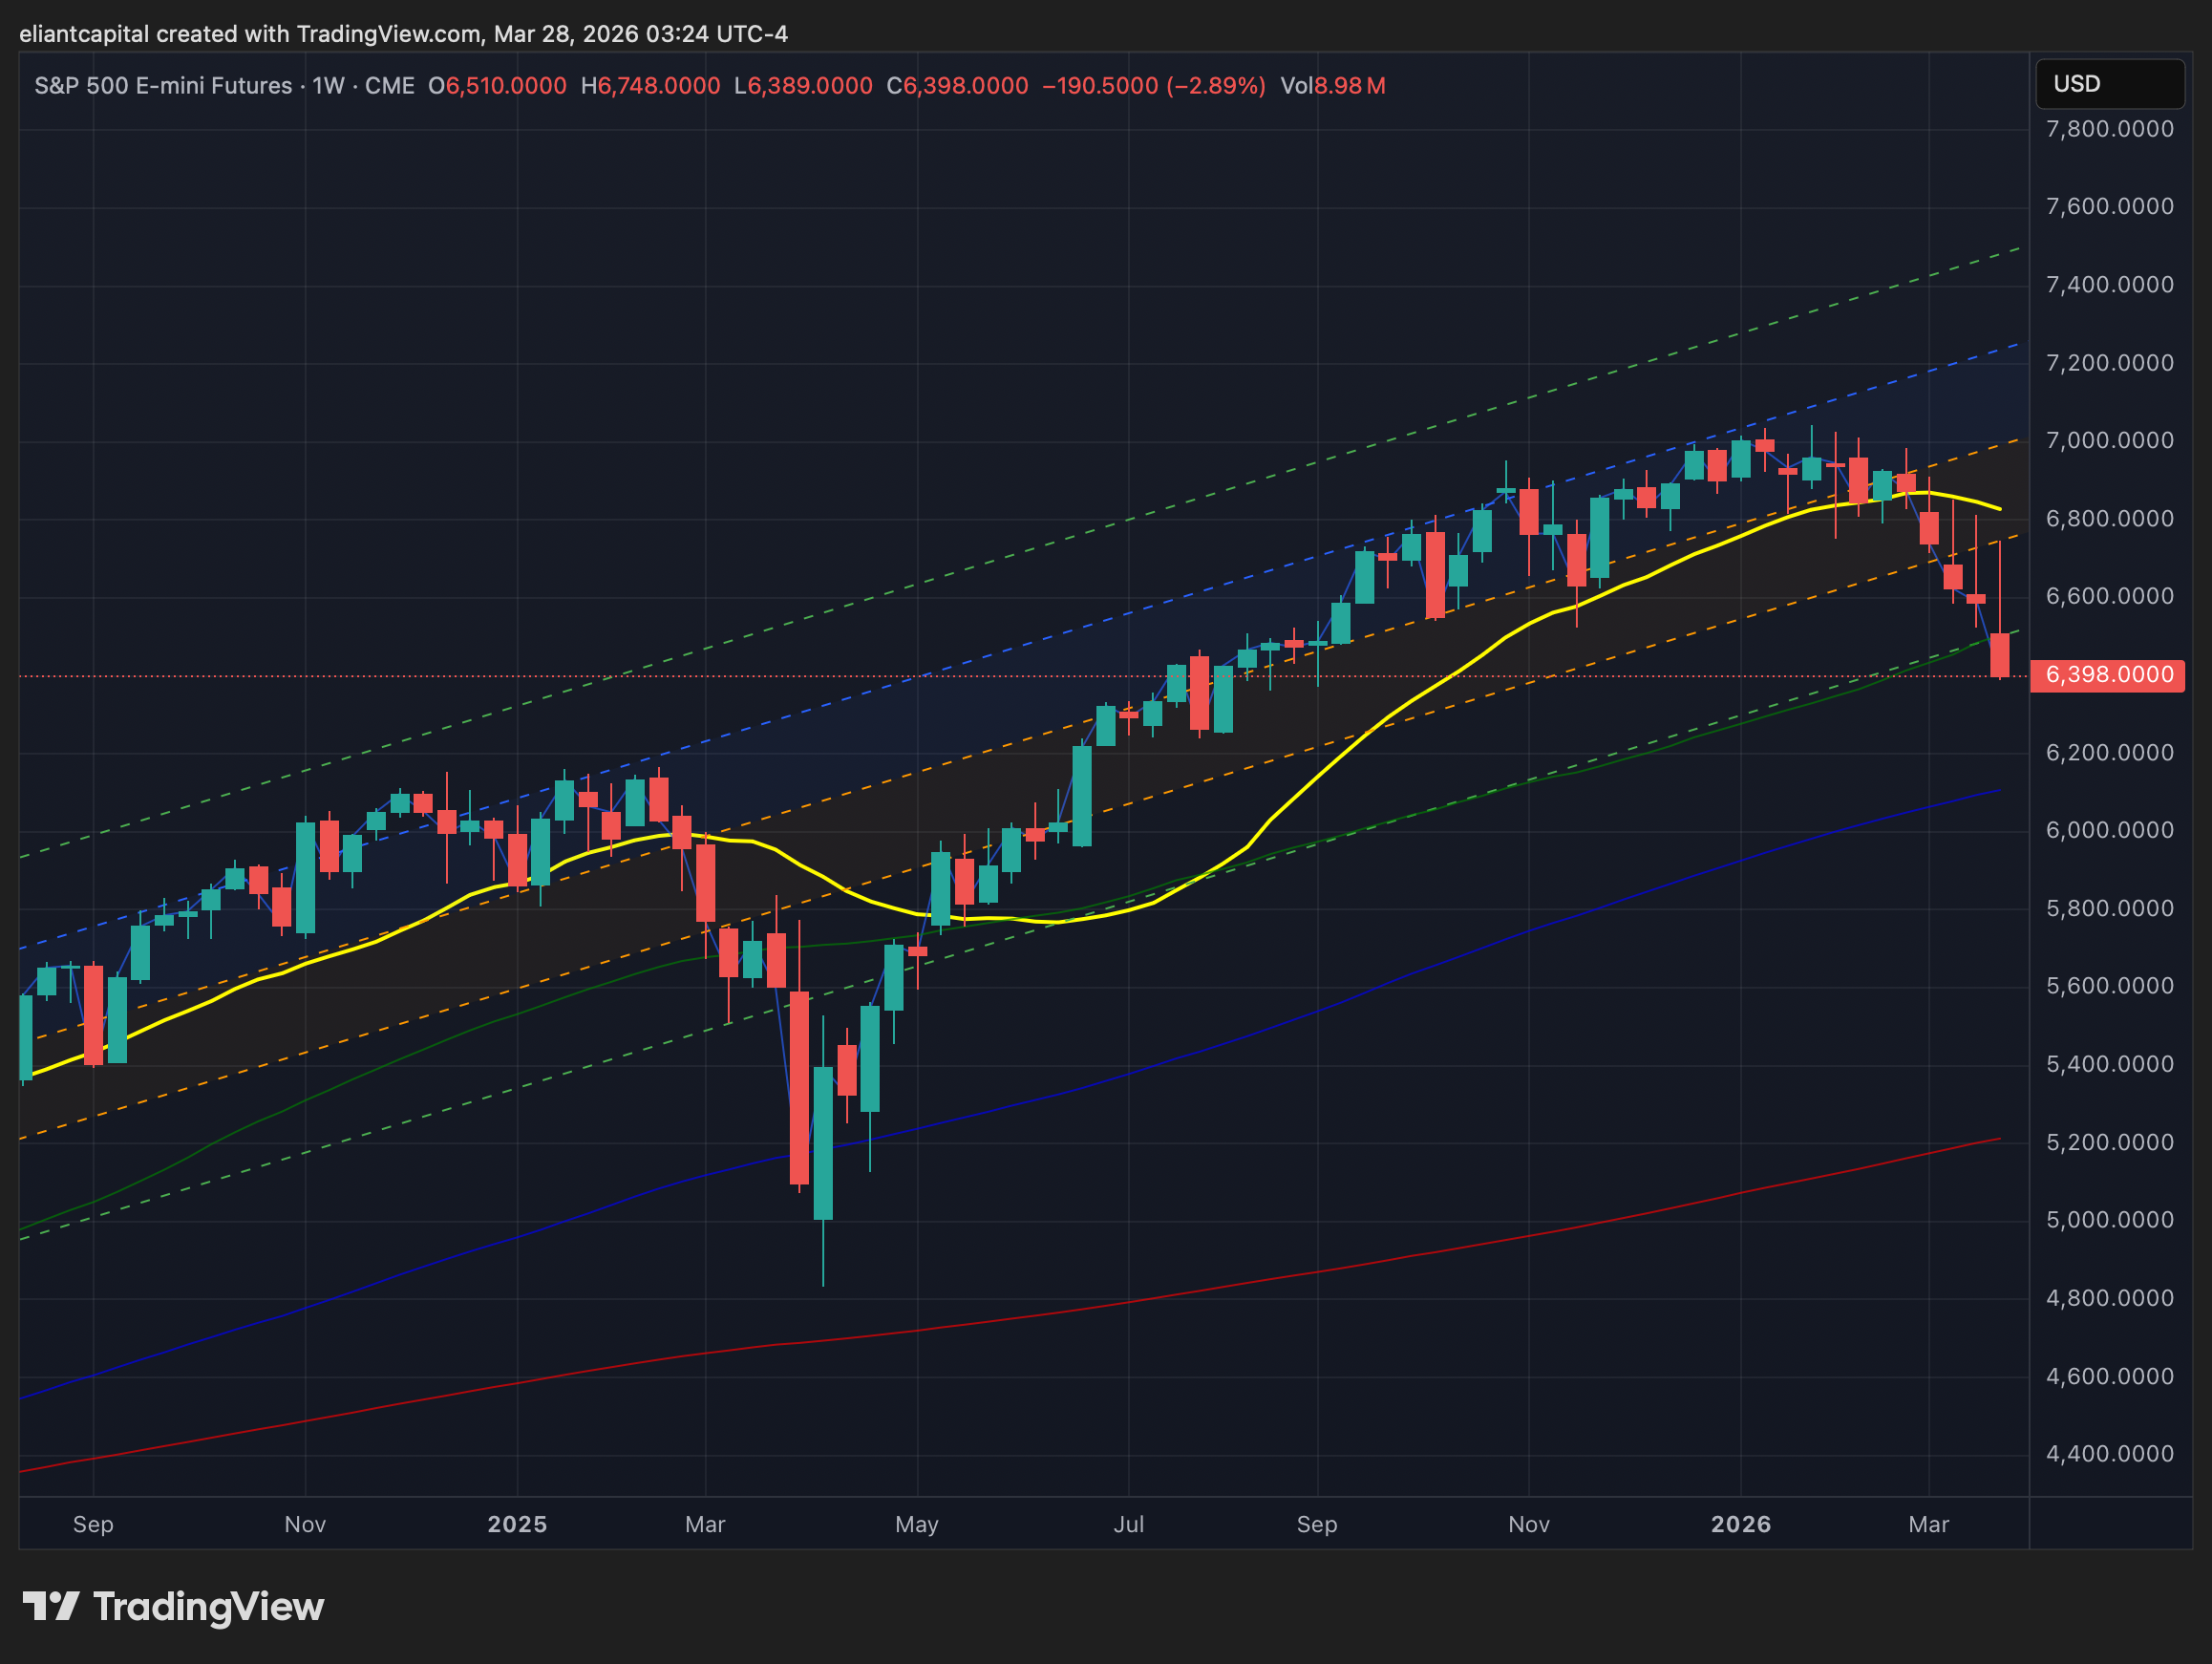
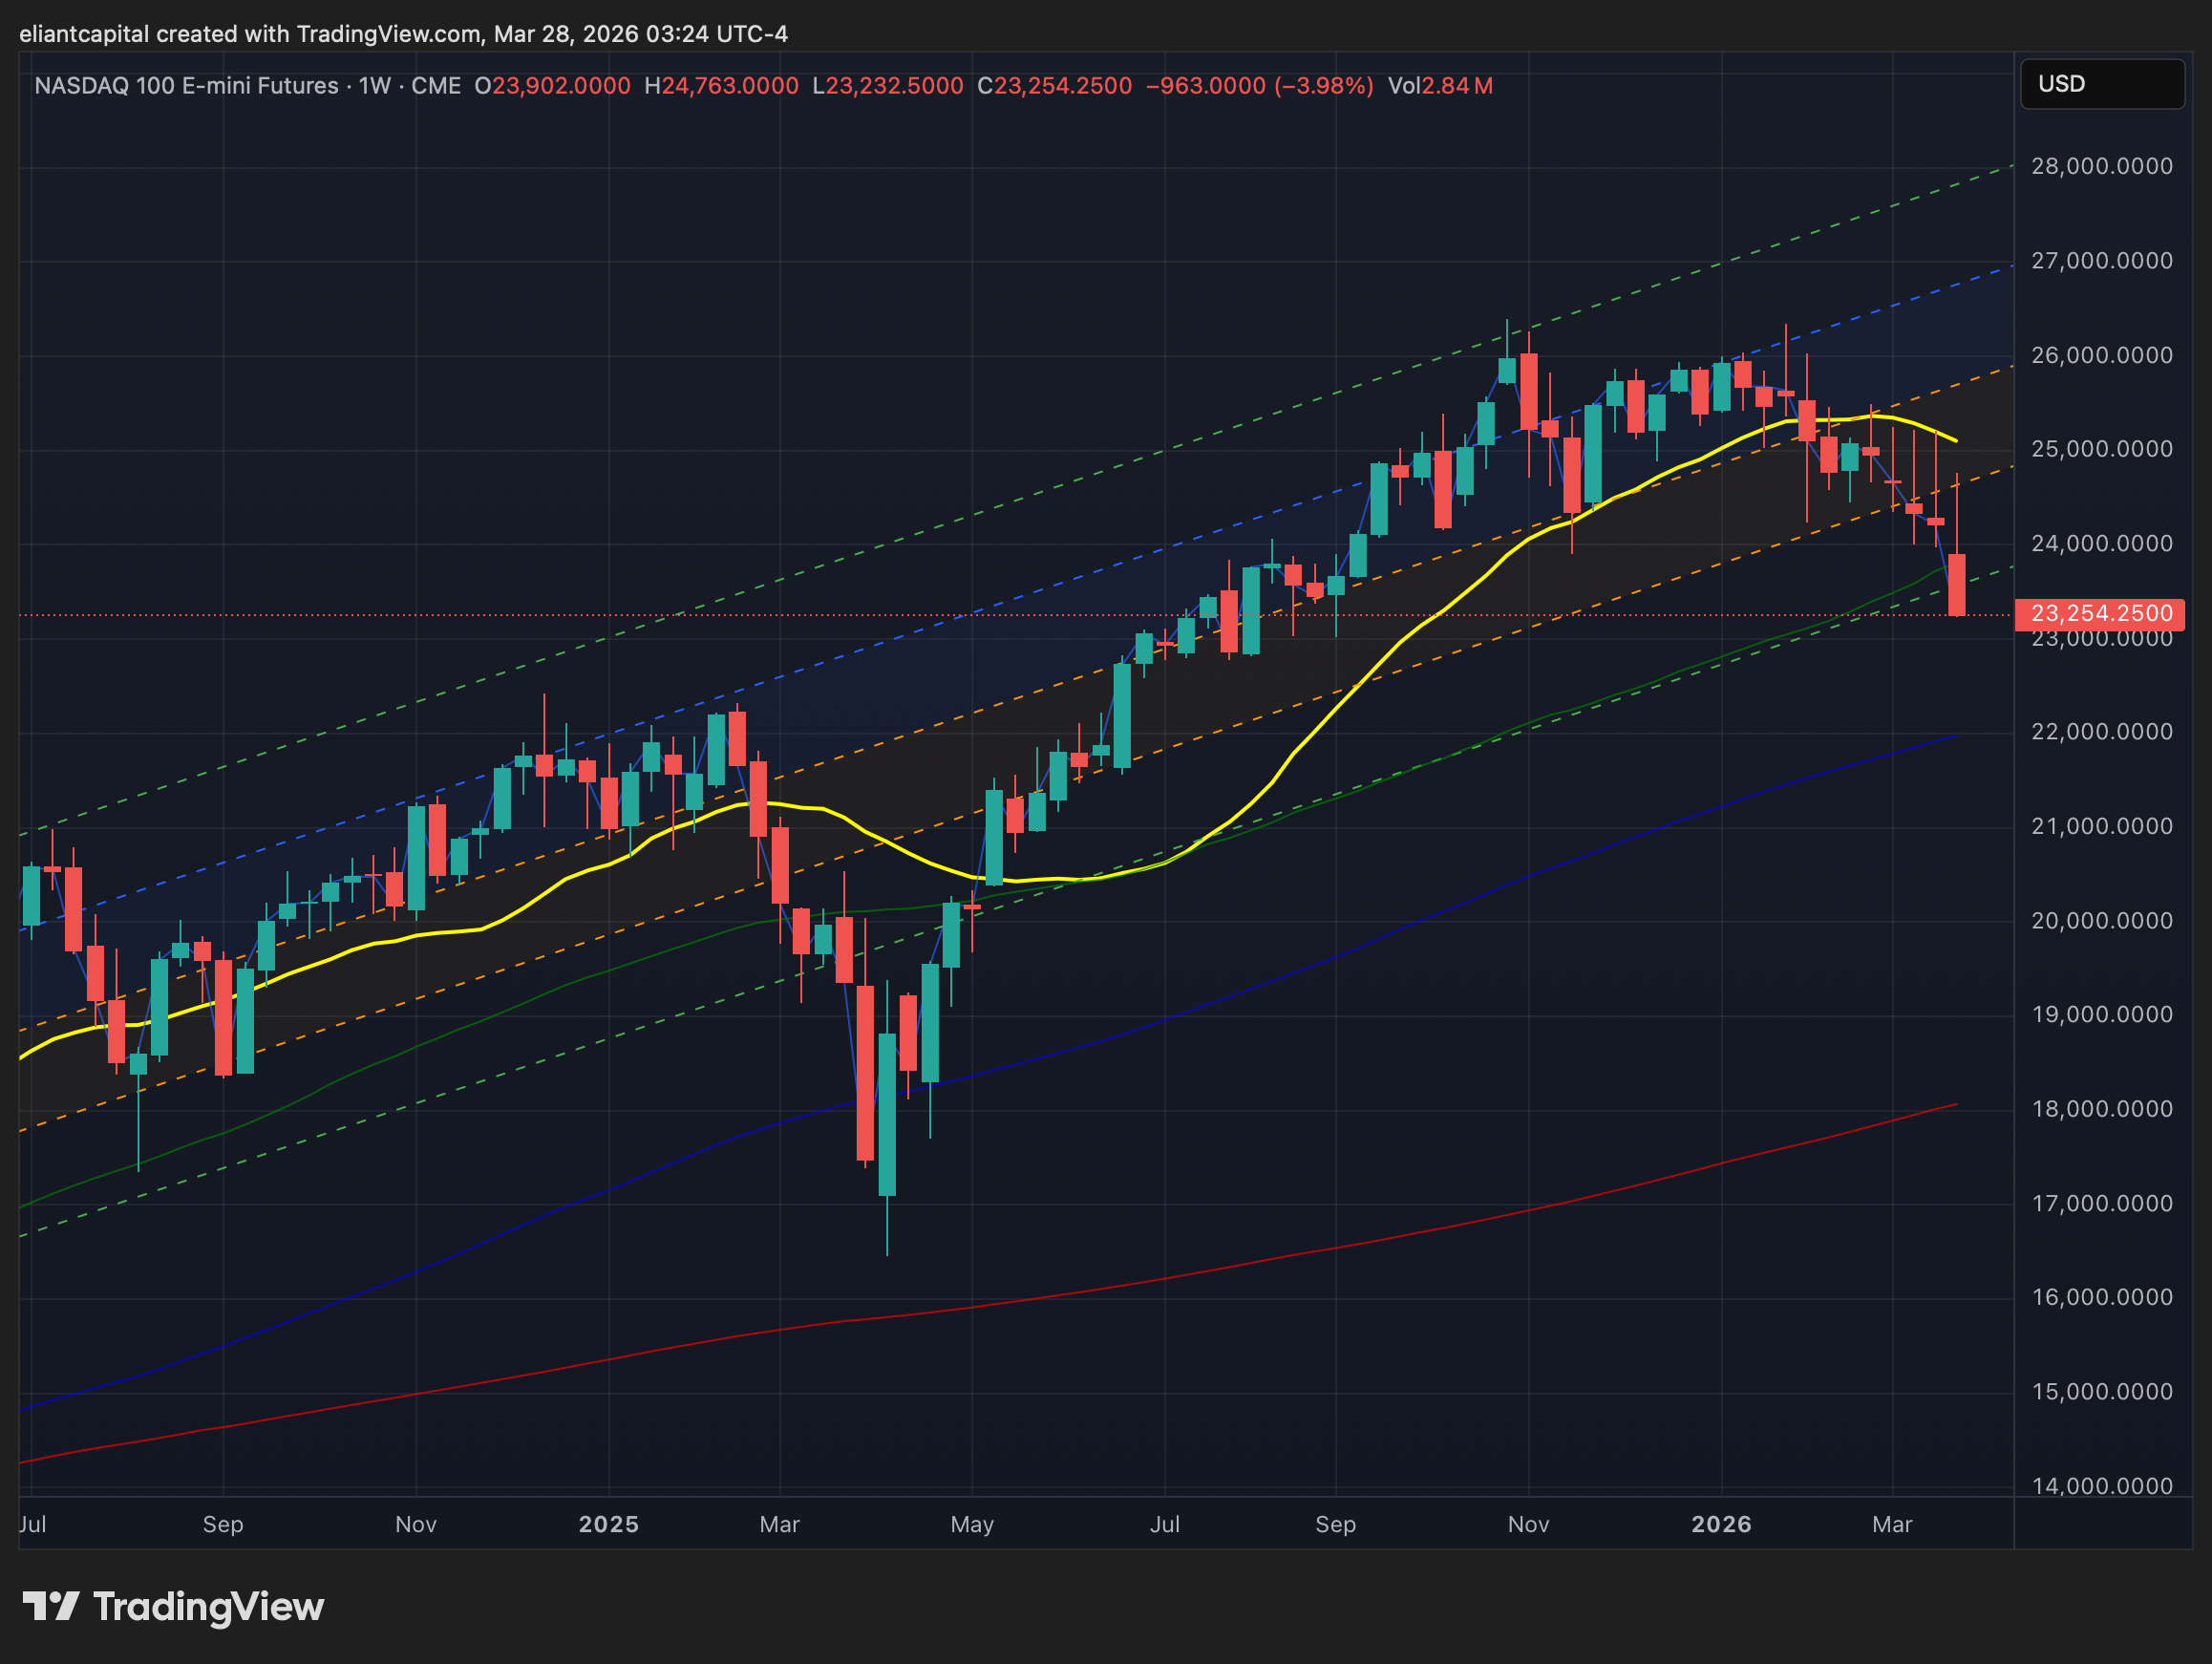
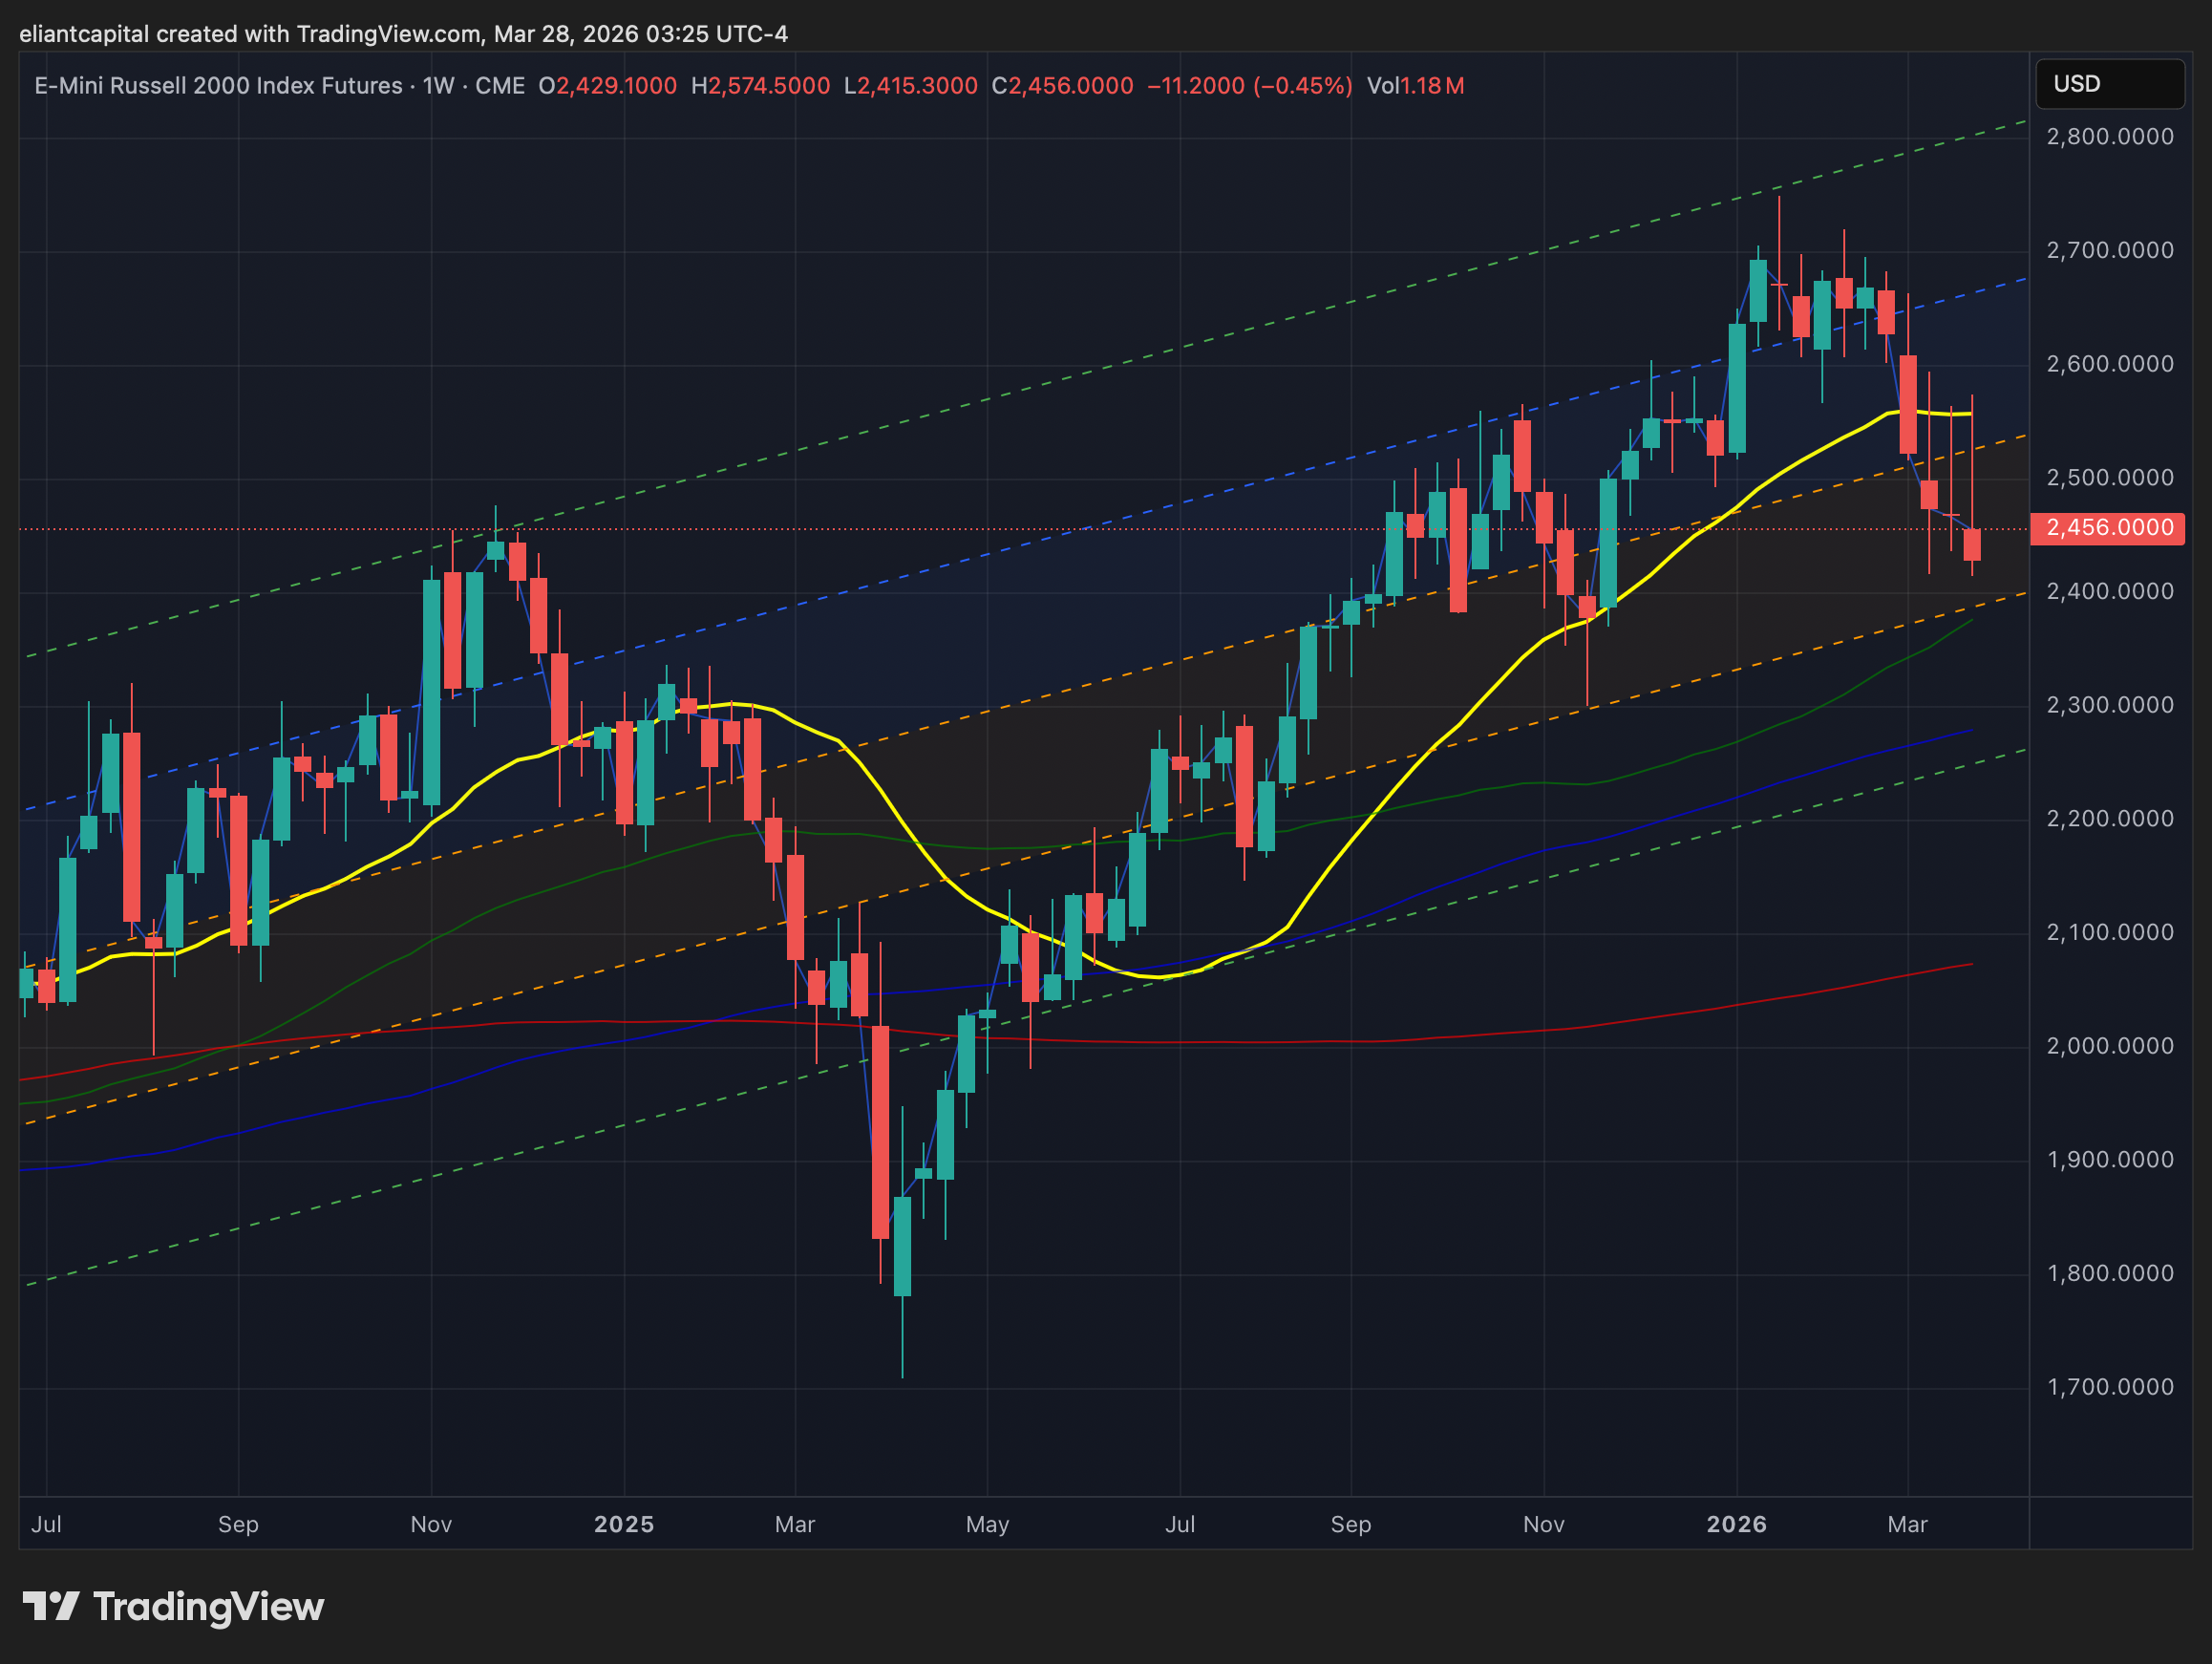
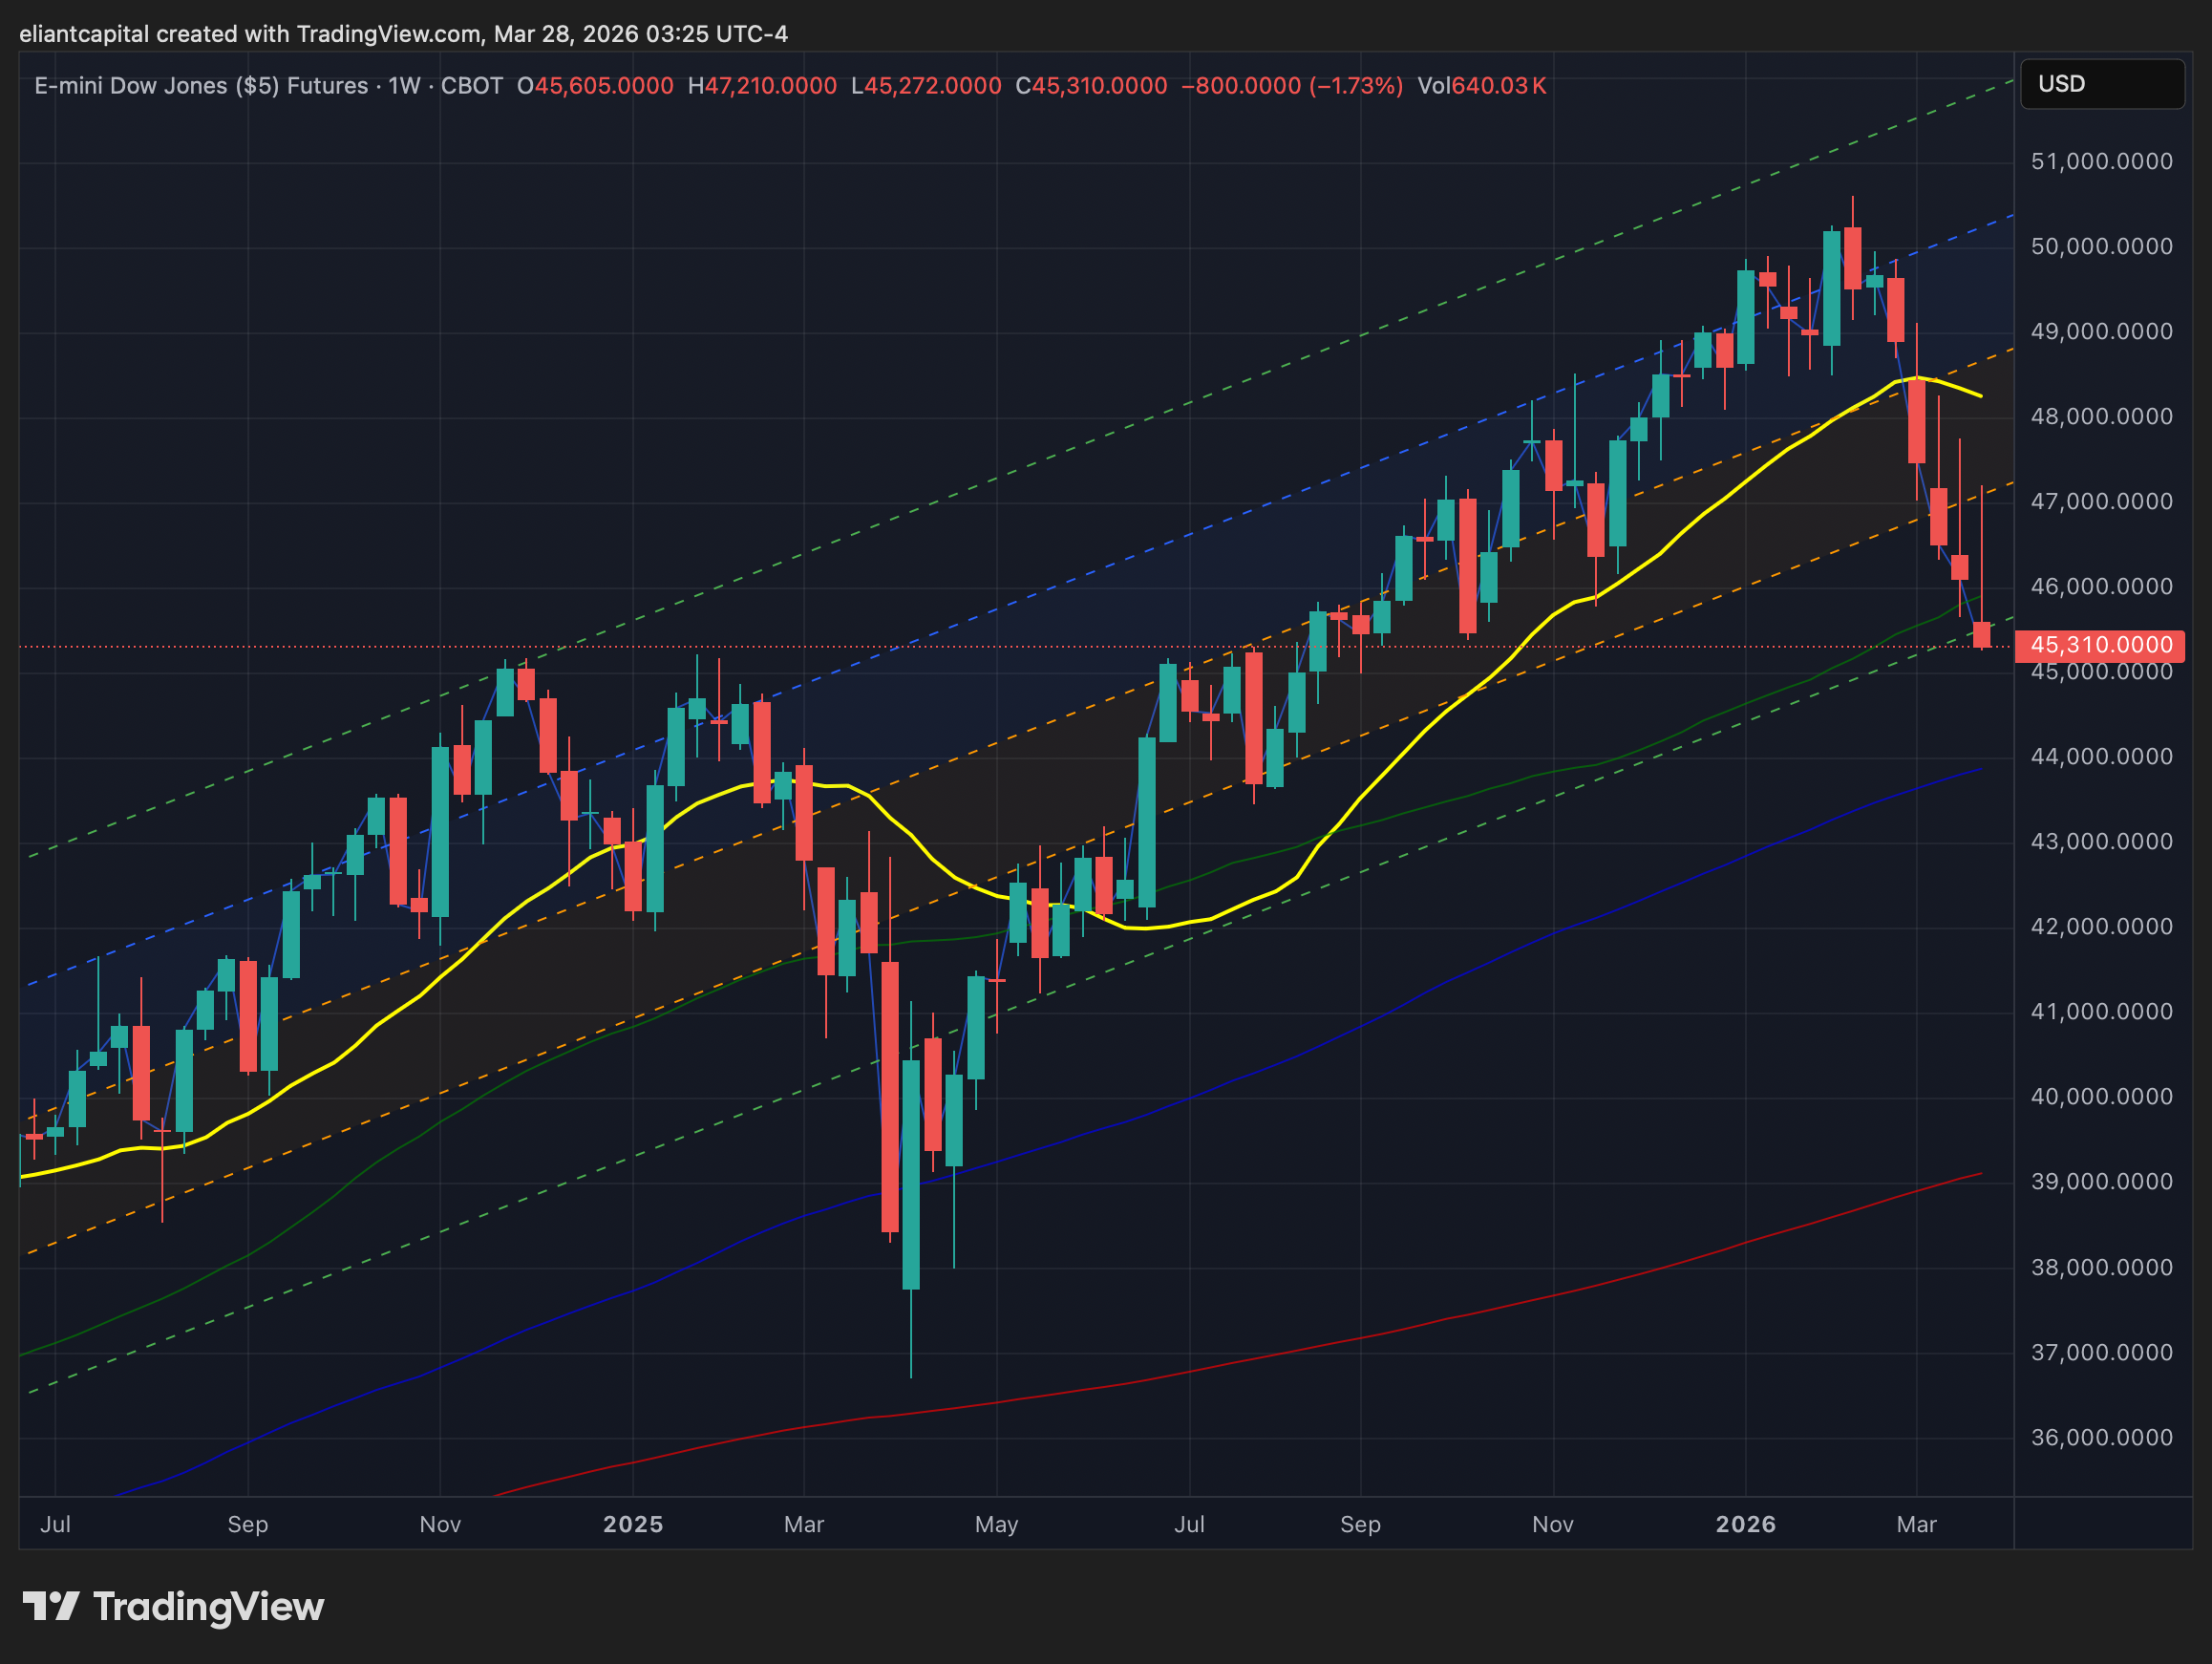
- STD Channels on Indices for Perspective: Weekly TF
- SPY
- QQQ
- IWM
- DJIA
Since starting this Substack back in June of ‘23, between individual names / tactical trades / baskets, we have netted a 167.76% return whilst in the same period, the Q’s have returned 59.86% / Spooz has returned 52.16% / Dow has returned 40.17% & Small-caps have returned 39.01%, so nice outperformance against all the indices whilst having a 81.8% win rate, averaging a 28.14% return on realized gains / winners & a 15.49% loss on realized losses / losers.
Looking forward to the future & continued success through ‘26.
And for anyone who wants to follow an actively managed portfolio in real time:
I’ve joined Plutus as the cleanest, day-to-day way to track an actively managed portfolio in real time. It’s a live dashboard that’s broader, more diversified, actively managed by me, & updated continuously.
The Eliant Flagship is published on RunPlutus.
Once your Plutus account is approved, you’ll have the option to allocate right away. If you do, it’s straightforward: create an account, link your brokerage (Available only for IBKR at this time), & select the Eliant Flagship (or any of the baskets I’ve built). Your money stays in your account, and trades, position changes, and rebalances are replicated automatically so there’s nothing manual to manage. The idea is to make it easier to access an actively managed portfolio run by me without the overhead of traditional fund structures or high minimums, whilst you keep full custody of your assets & I stay focused on research, positioning, and portfolio construction.
And just to be clear, NOTHING is changing with Substack. It’ll stay exactly what it’s always been since we originally launched in the Summer of ‘23: where I share the thinking, research, & select trades behind my personal PA, along with ongoing commentary across all markets.
For those who may have missed, we published our ‘2026 Outlook’ which has a plethora of coverage on a wide range of topics / themes as ‘26 kicks off after coming off a strong ‘25 & for those whom would like to go back & read the report, I included it just below:

Earlier in 2024, we launched a series titled Educational Pieces, covering a wide range of topics, many of which were suggested directly by you all (4-Part Series).
For those who may have missed the first installment, it covered topics including:
General background / knowledge on all option strategies
In-depth talk on risk / reversals & how to go about expressing / utilizing them
Options Structuring
When to used naked calls / puts vs. spreads
Choosing expiration dates
Identifying key pivots / supports / resistance zones
General briefing on stock gaps
What to look for in regards to fundamentals
Implementing fundamental / macro / technicals into a trade
Hedging
Creating risk/reward setups
Taking profits / managing losses
Overall Process
Book recommendations
A link to the original Educational Piece can be found here .
Given the positive feedback and how useful many of you found the first installment, we followed up with Educational Piece: Part Deux earlier in 2025 & for those who may have missed, a link to the piece can be found here & we then went on to release Educational Piece: Part Trois which can be found here.
And finally, the most recent installment, Educational Piece: Part Quatre, can be found here.
‘Risk management is the silent prerequisite for compounding & true wealth is built not by chasing the highest returns but by ensuring the survival necessary to realize them.’
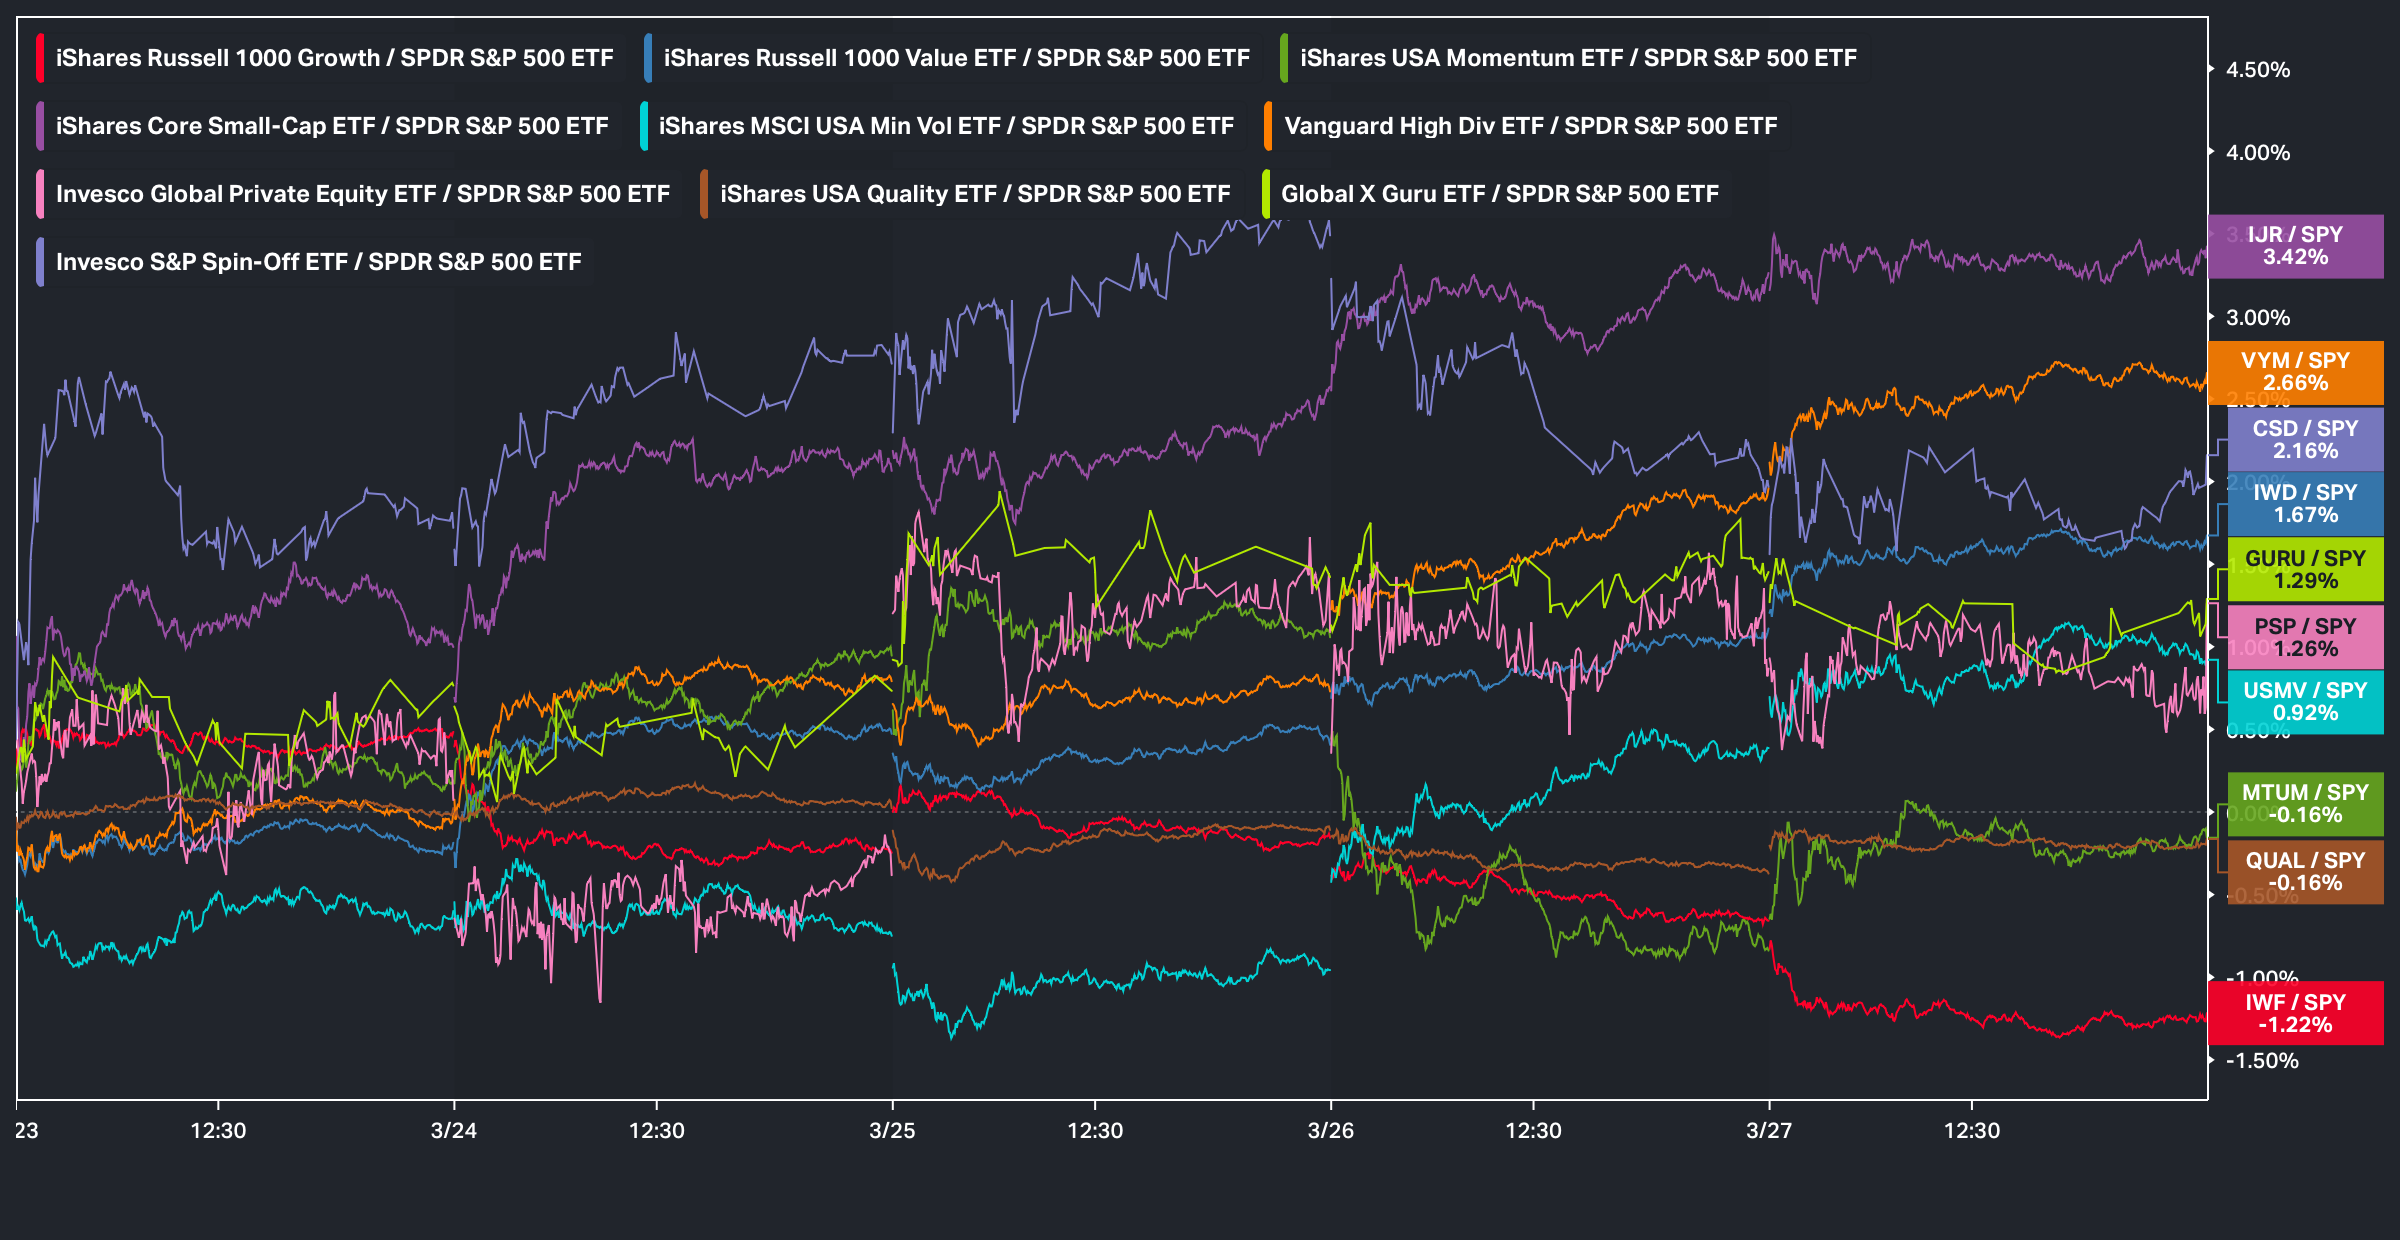
Before jumping into the week ahead, looking back at this past week, in terms of factor performance, Small-cap Value along with High Dividend Yield were among the best-performing groups, whereas Growth was the worst performing factor, followed by Quality as the second worst performer:
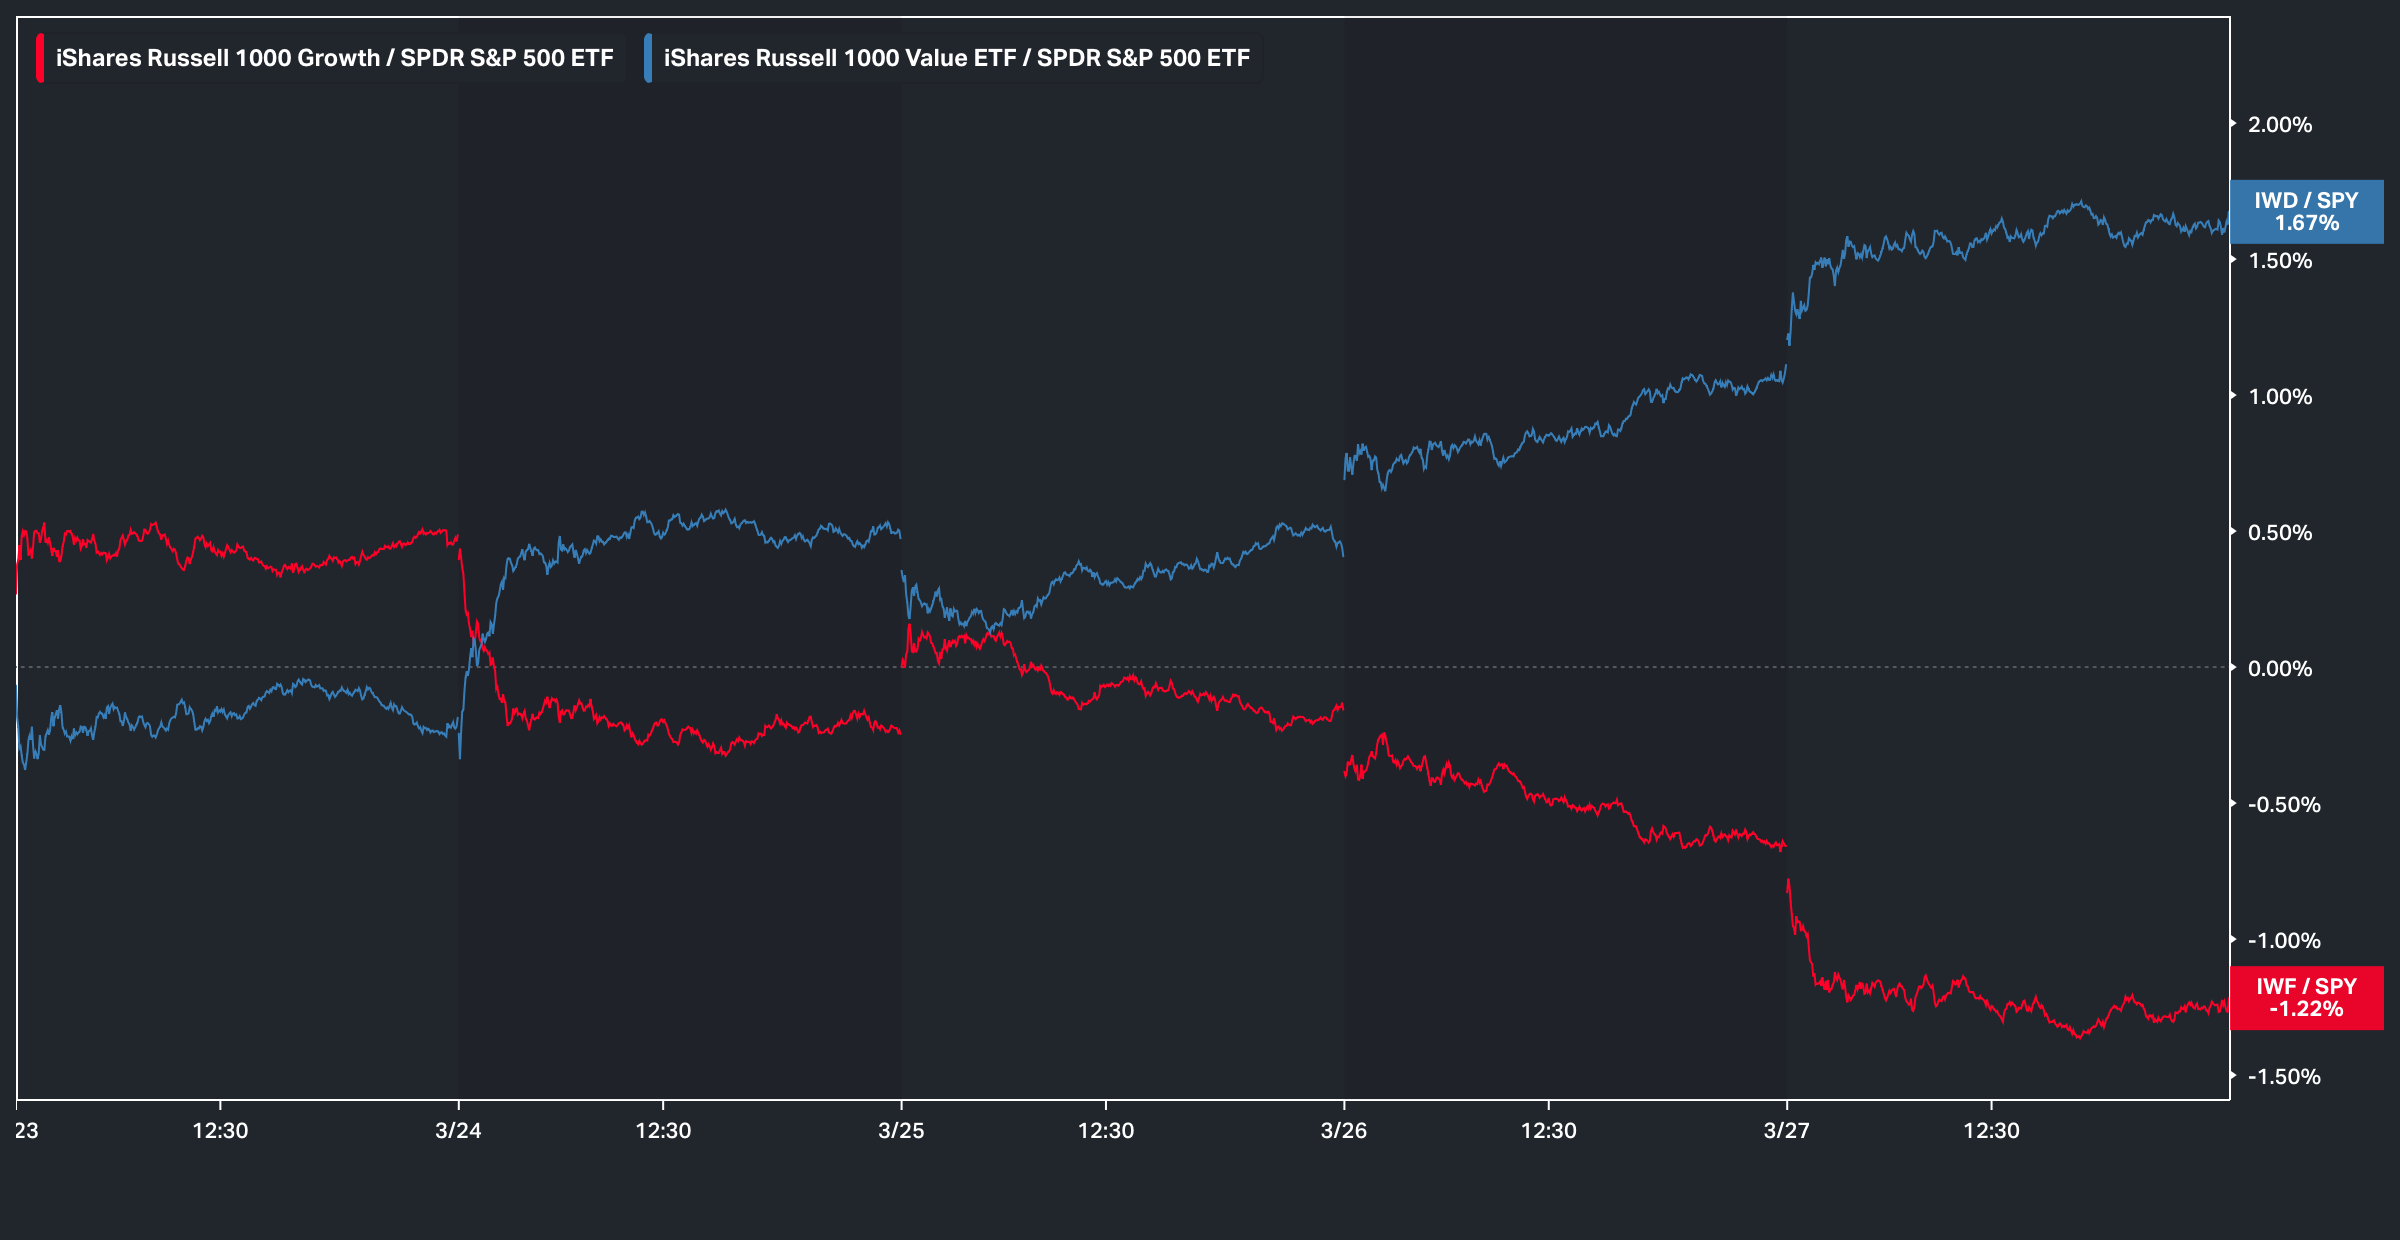
And on the week, despite the brief rally earlier on, the overall tone skewed more risk-off, with Value ultimately outperforming Growth, as the spread between the two groups closed at just under 300bps:
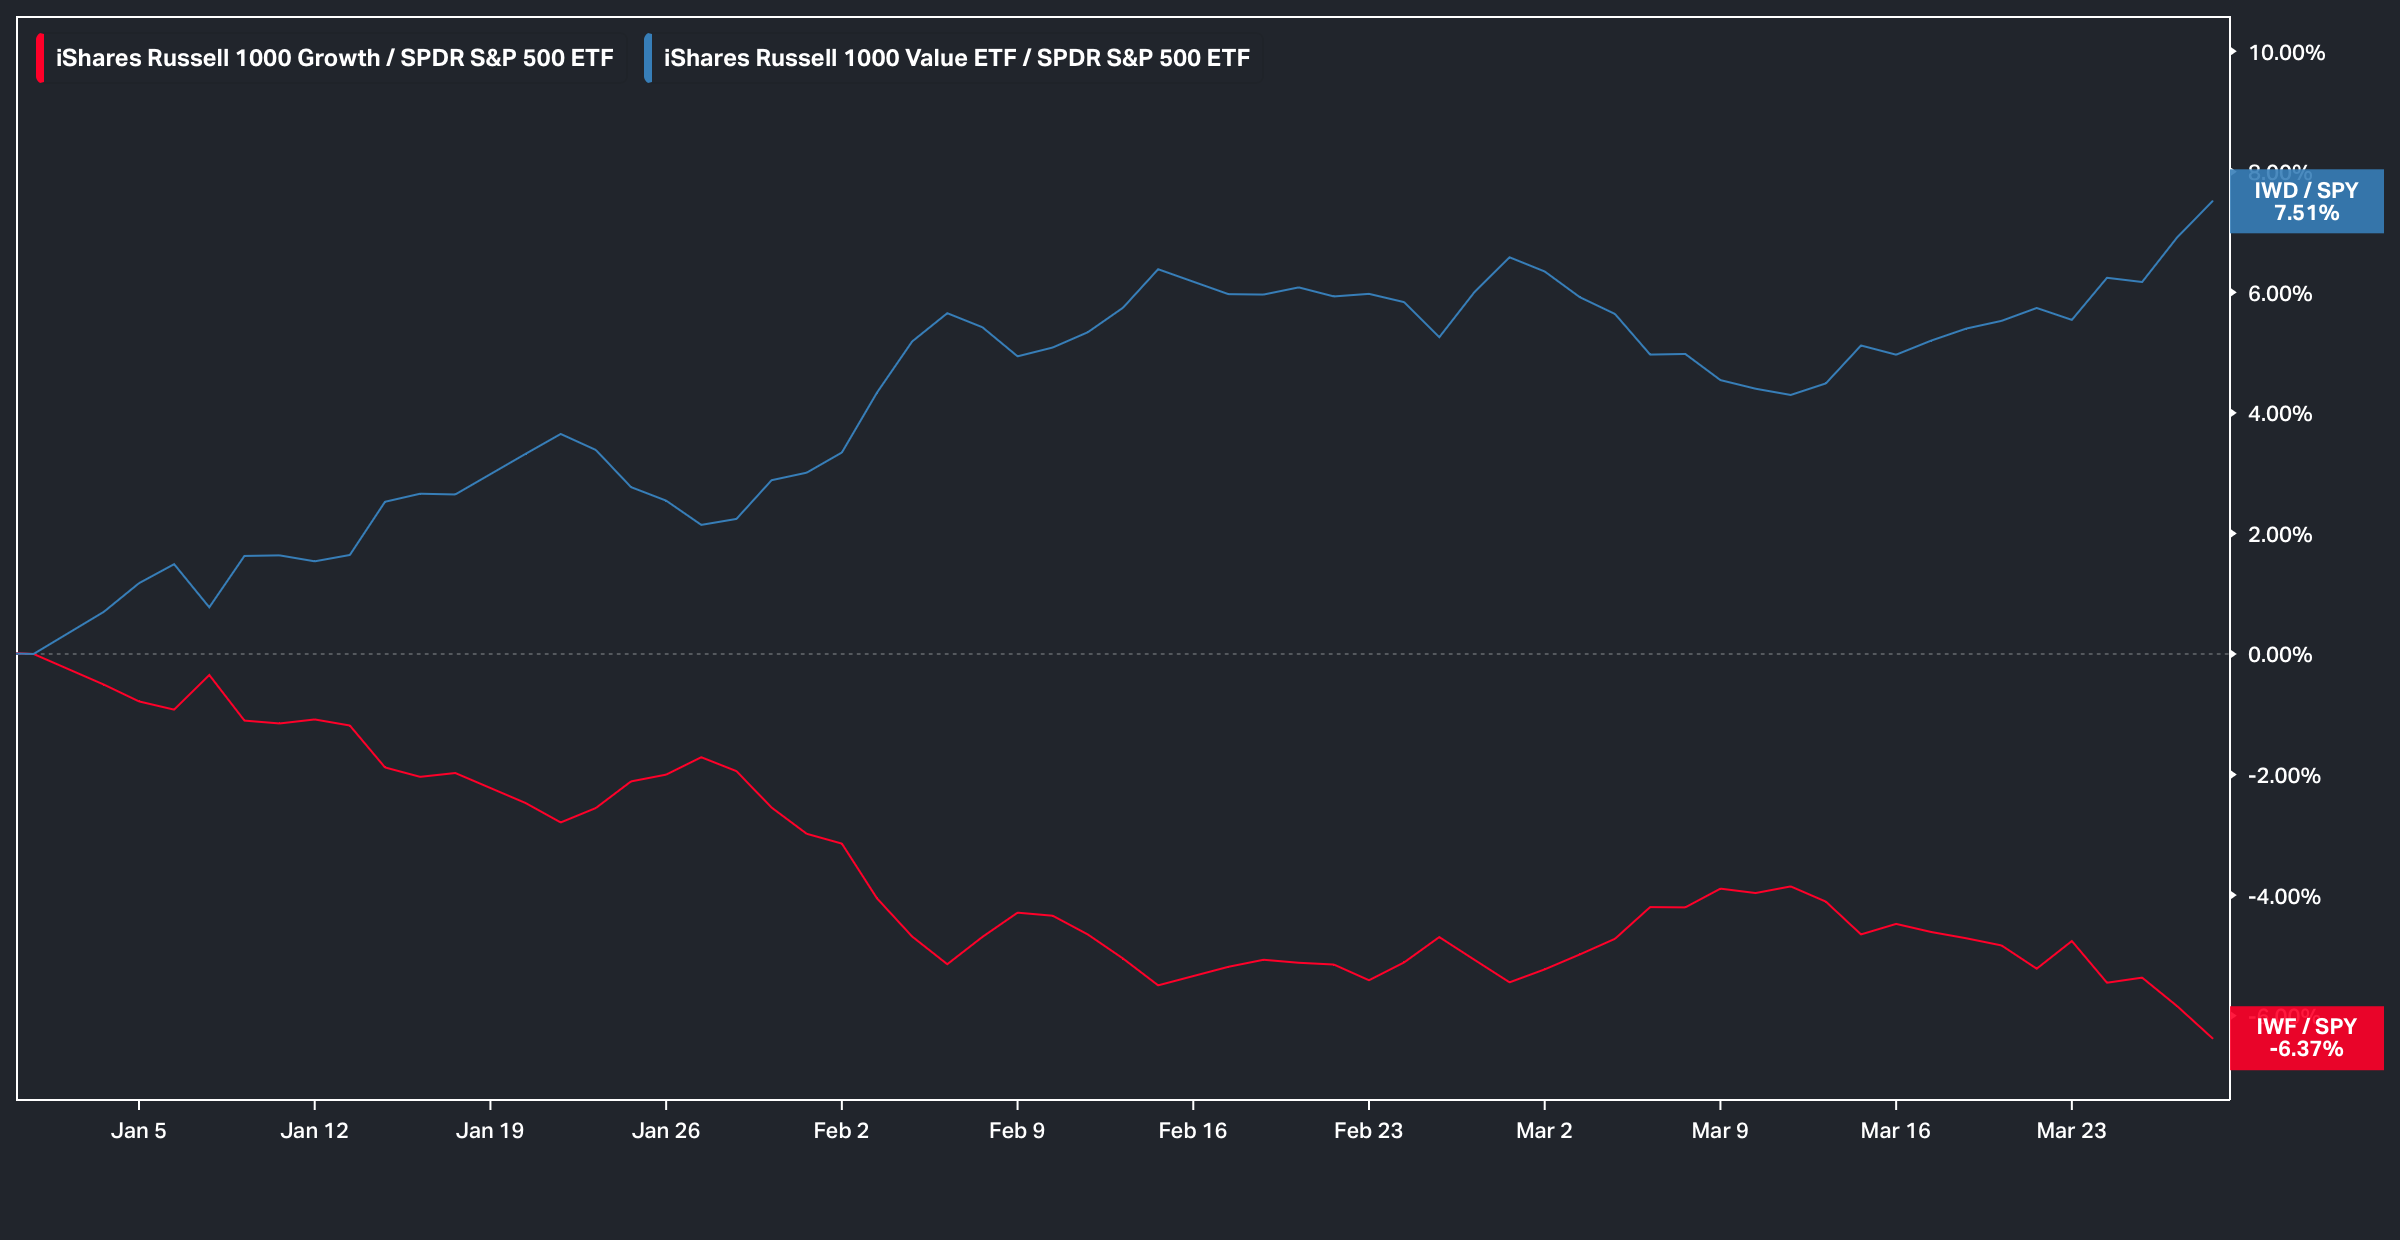
And on the year, the spread between Value and Growth has pushed to new highs after initially narrowing through February and early March, with the spread now sitting at just under 14% between the two groups:
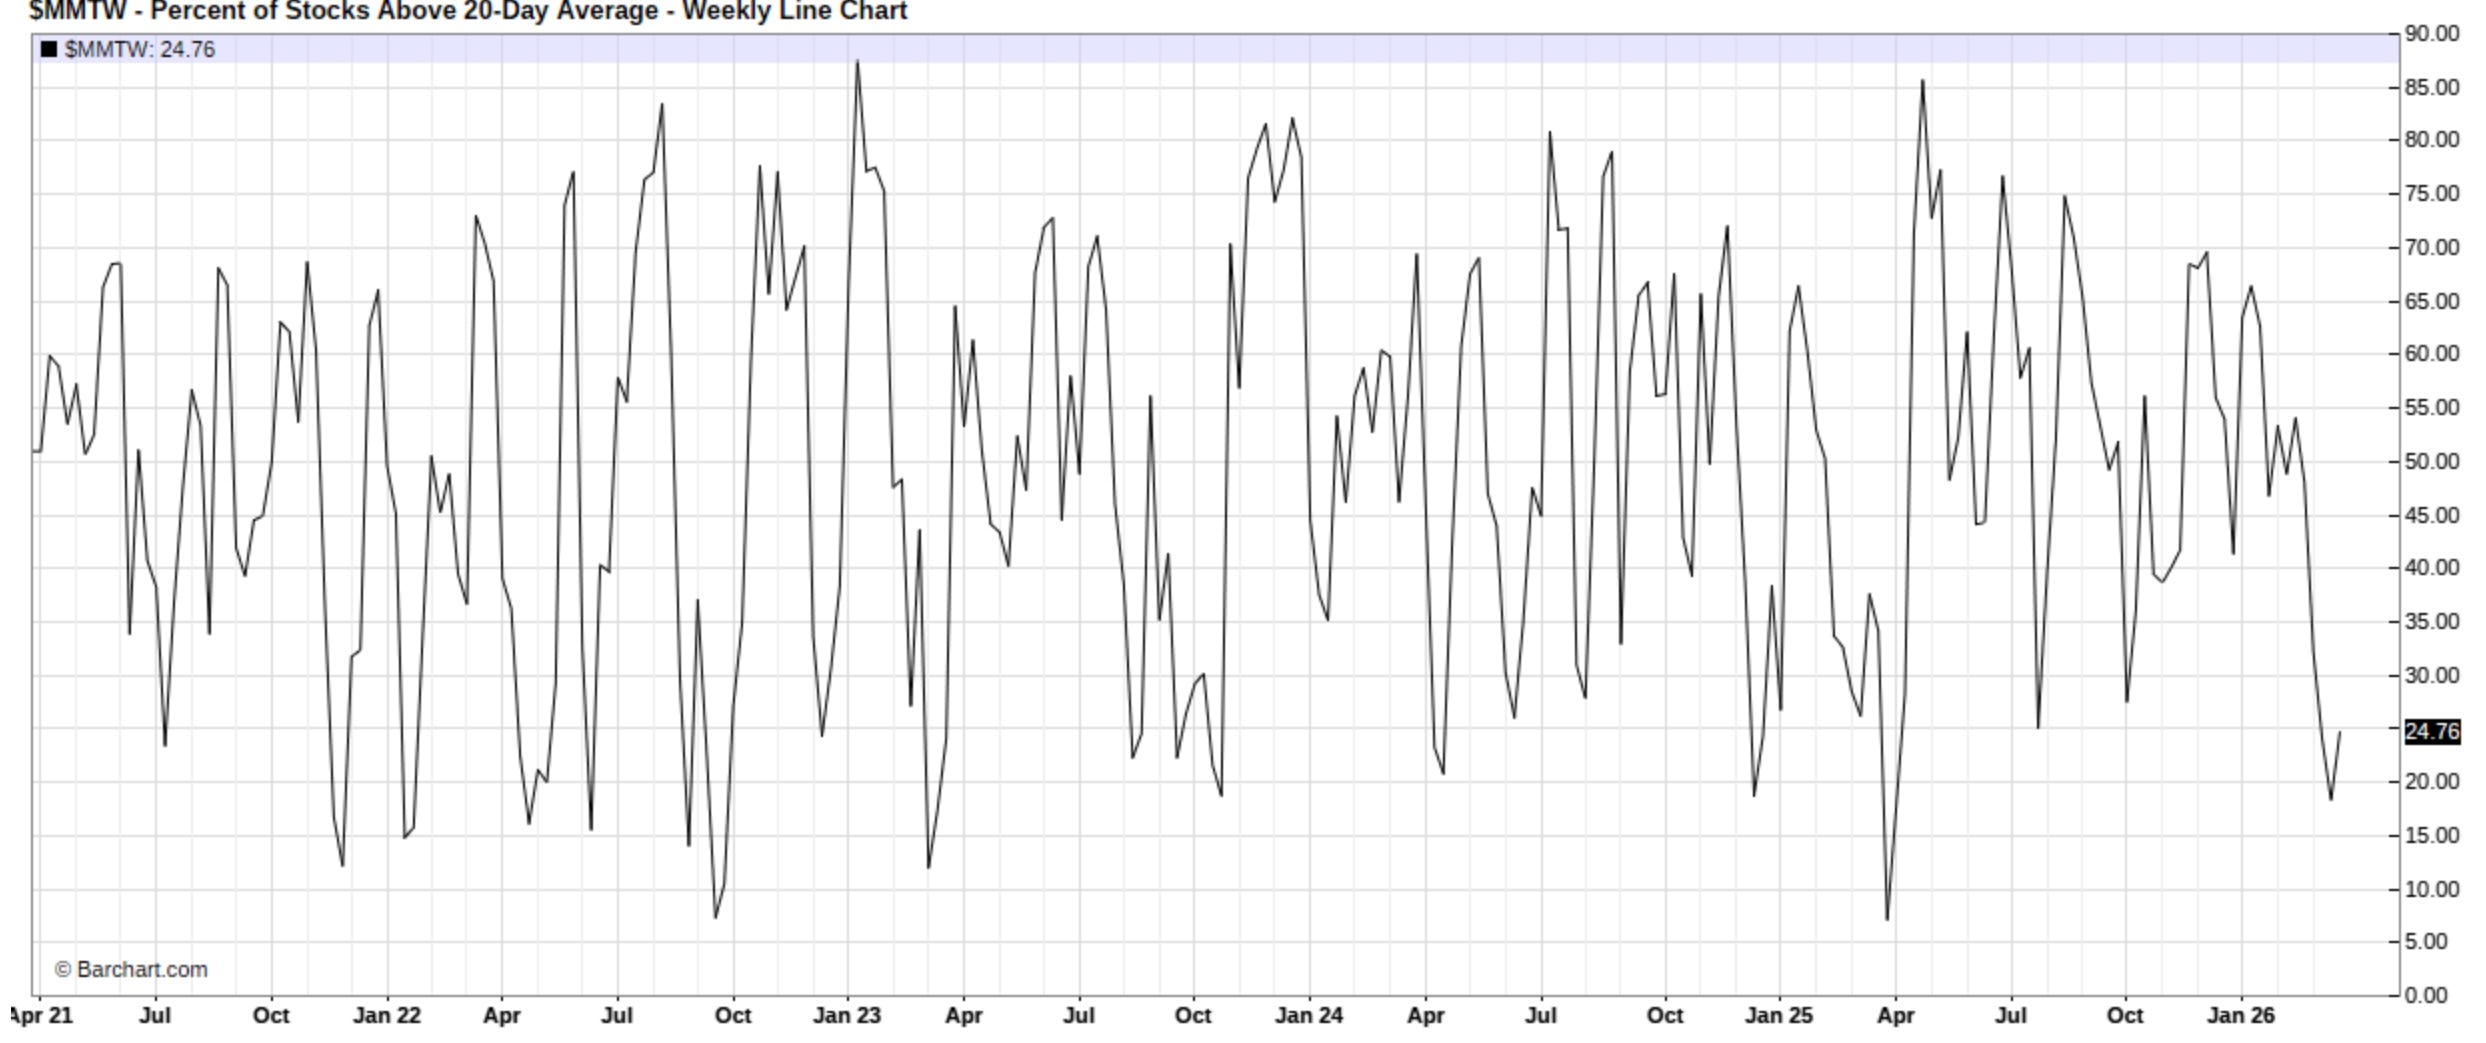
Moving along, following the risk-off action throughout the latter part of this past week and the indices well into corrective territory, just 24% of stocks are currently sitting above the 20D thus putting us firmly into oversold territory although not quite necessarily ‘washout’ territory (Prior ‘washout’ periods tend to bottom in the single-digits).
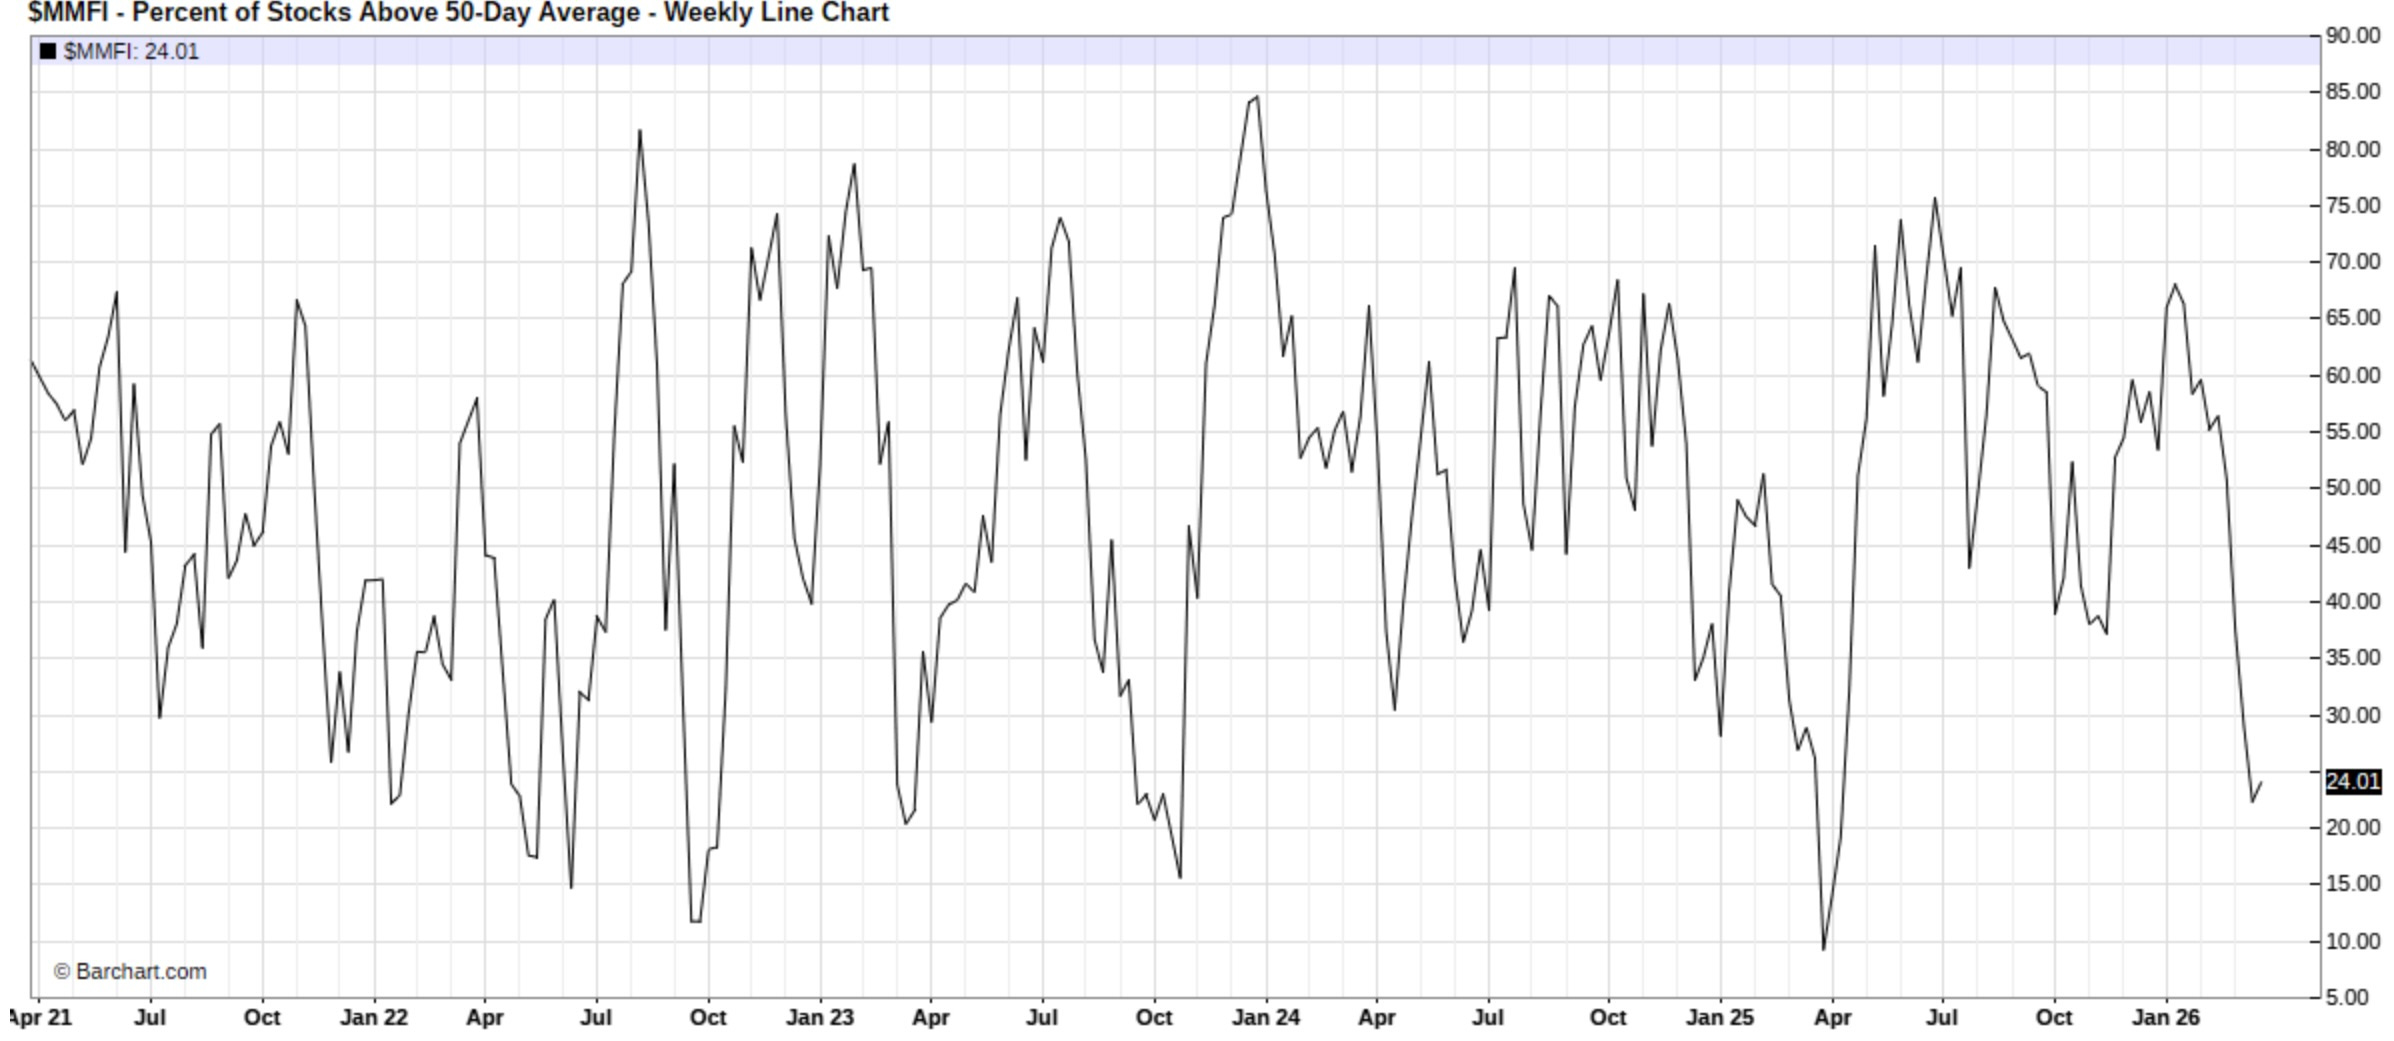
And a similar point can be made on a broader timeframe, as roughly 24% of stocks remain above the 50D, which again emphasizes that the market is firmly within oversold territory, and while conditions are not yet at complete ‘washout’ levels, we’re certainly getting close (Major bottoms over the last five years occurred at 12.5% in October ‘22, 15% in November ‘23, and 10% in April ‘25).
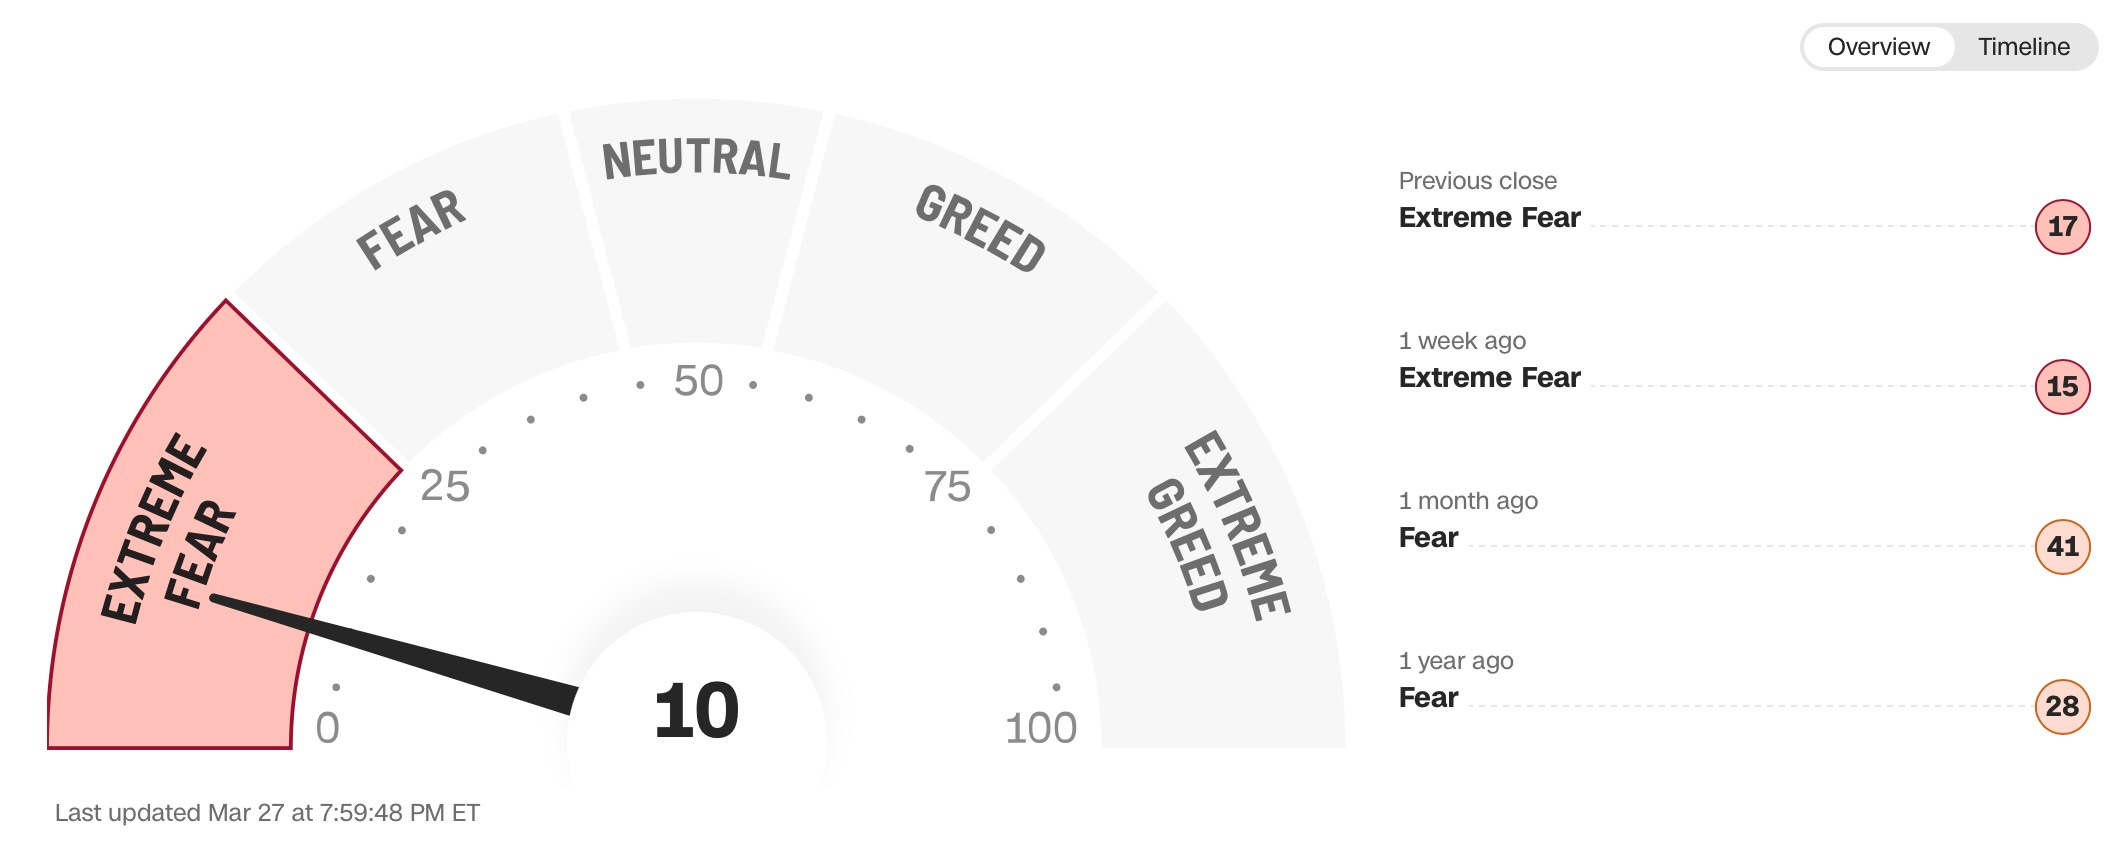
And continuing on that note, with the indices all firmly within corrective territory and Spooz itself sitting 9% off all-time highs, we’re now well into ‘extreme fear’ territory:
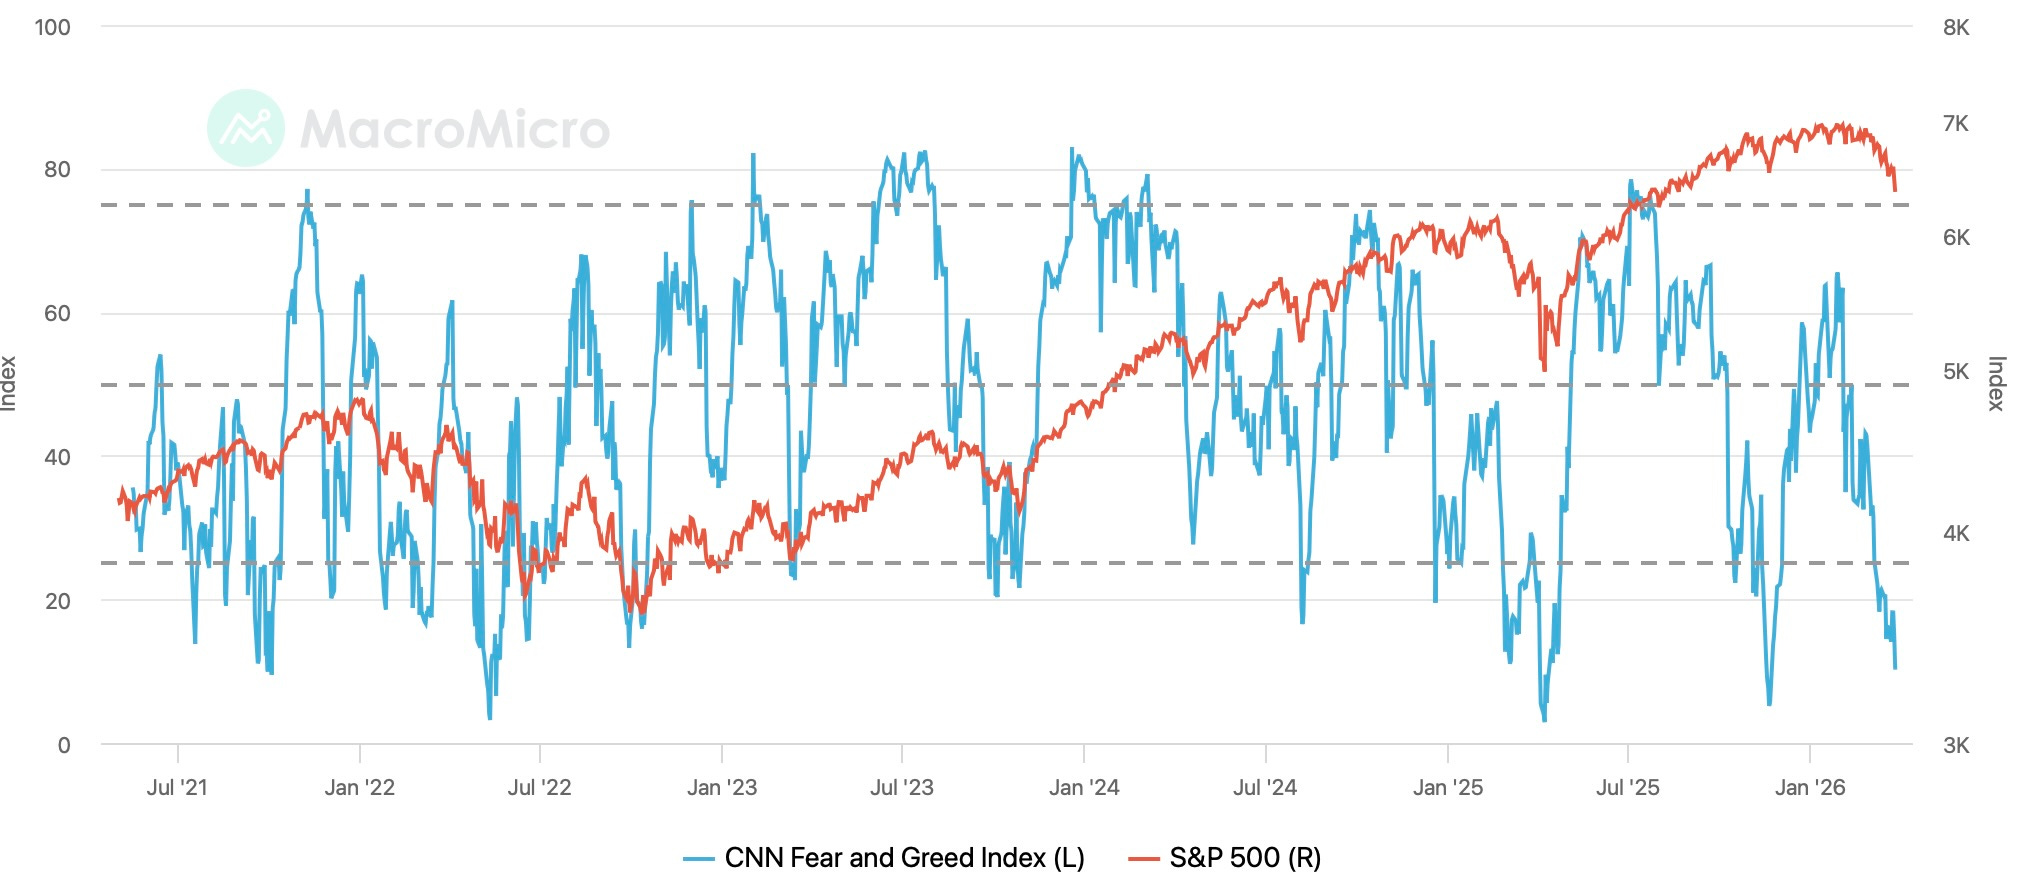
And just to add some historical context, here’s the Fear-Greed Index overlaid with Spooz:
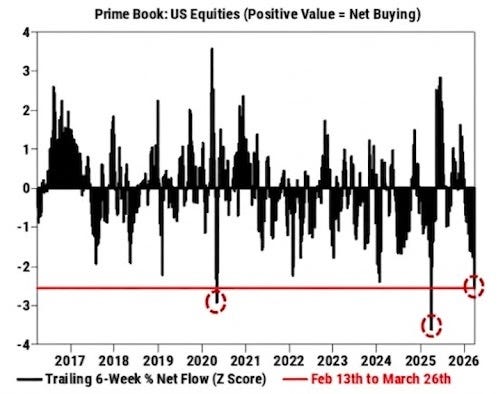
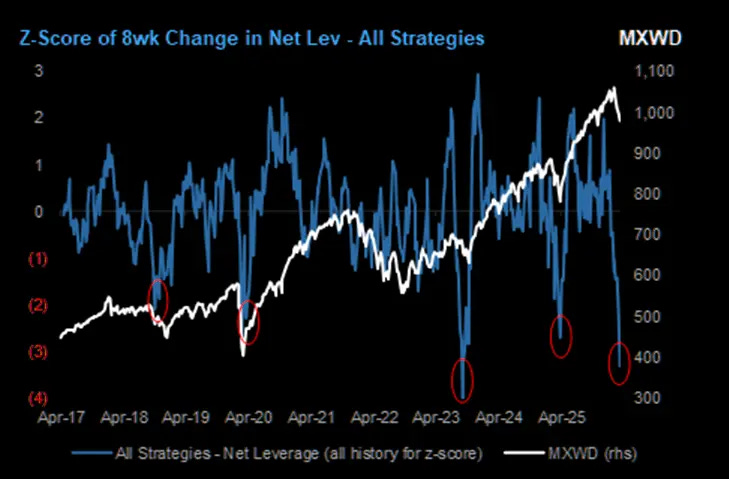
That being said, moving to the indices, positioning data is beginning to reflect a meaningful flush, with hedge funds rapidly de-risking in recent weeks, as the pace and scale of net selling now sit near the most extreme levels of the past decade, comparable to major unwind periods like the Covid shock in ‘20 and to a lesser degree, Liberation Day in early ‘25.
And per DB, equity positioning has continued to trend lower, with equity exposure now sitting well below average and drifting toward the lower end of its historical range, although not quite yet at true capitulation levels.
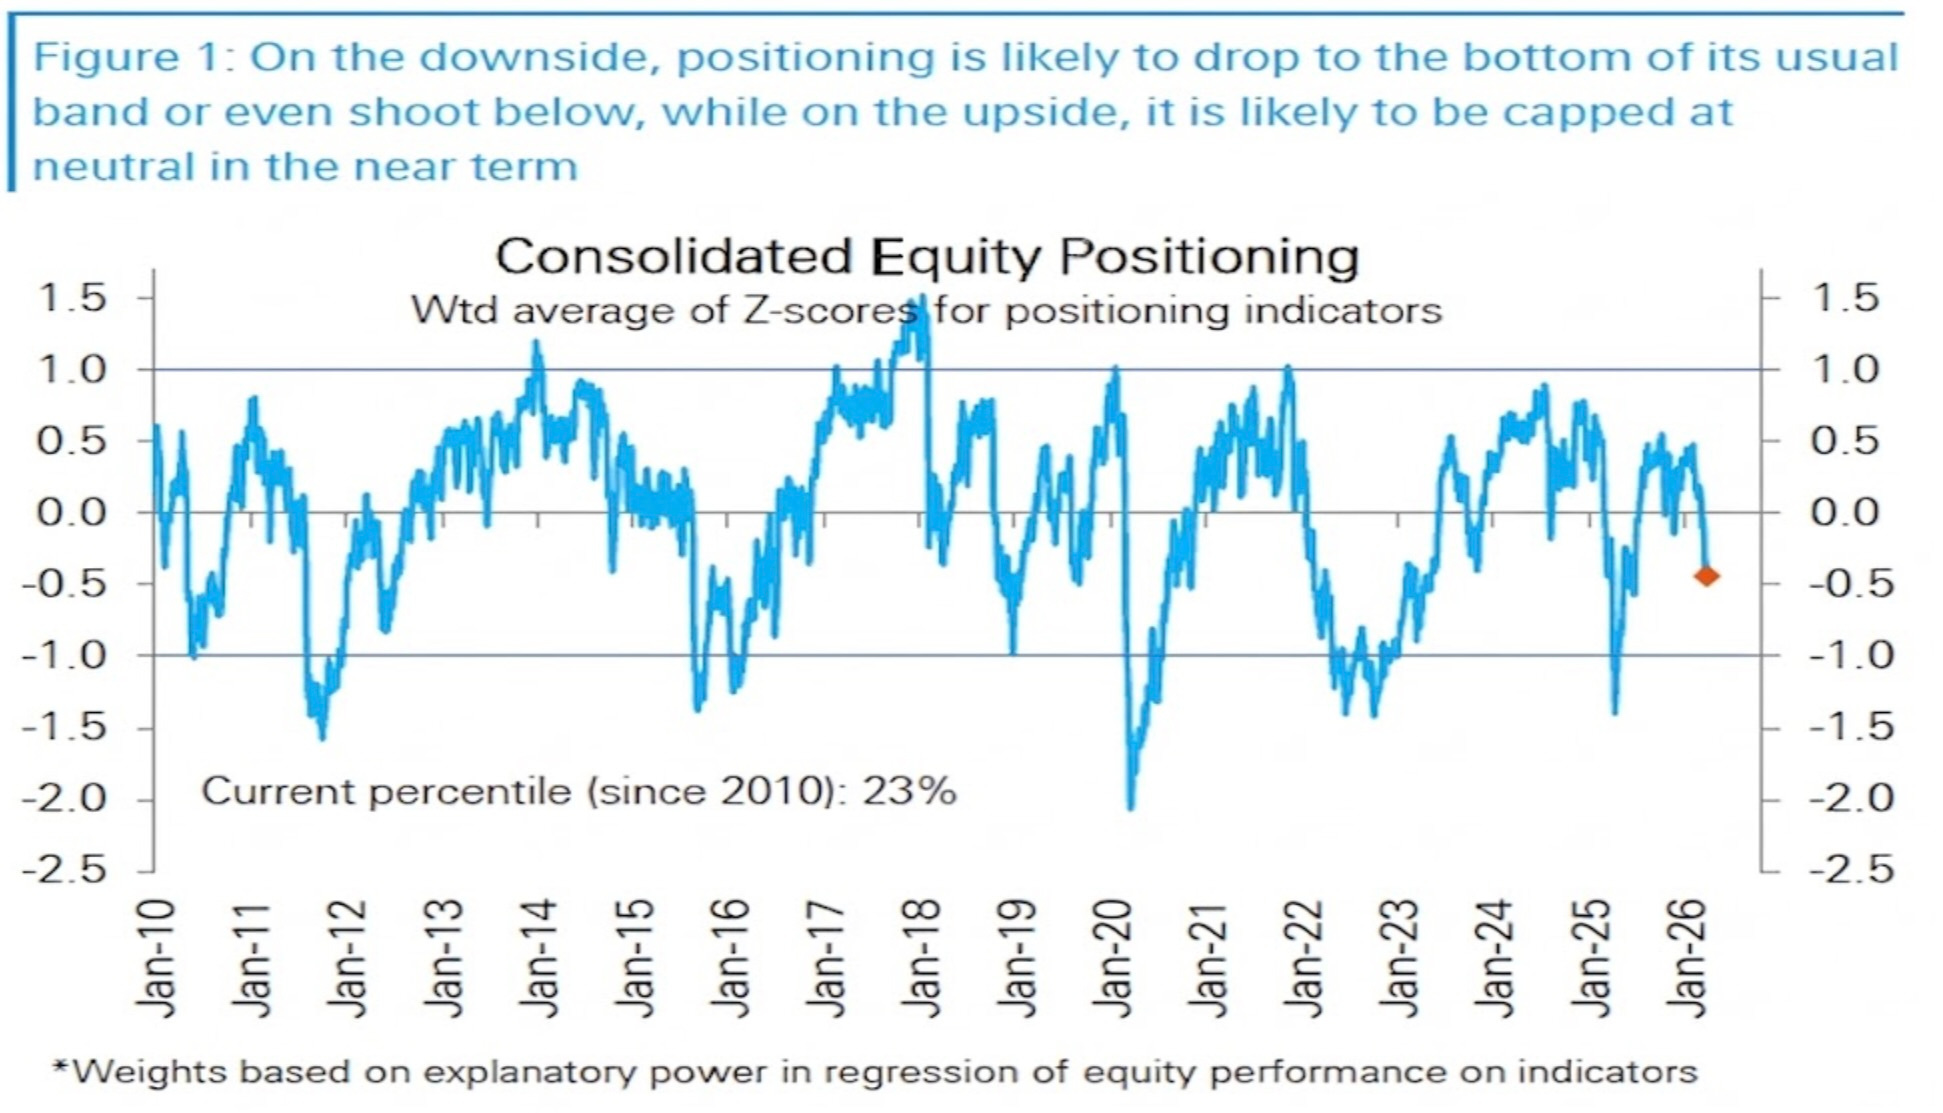
That said, overall positioning has continued to drift lower, now sitting around the lower quintile of its historical range and roughly back to where it was in mid-March ‘25, although still not as washed out as the extremes seen in early April.
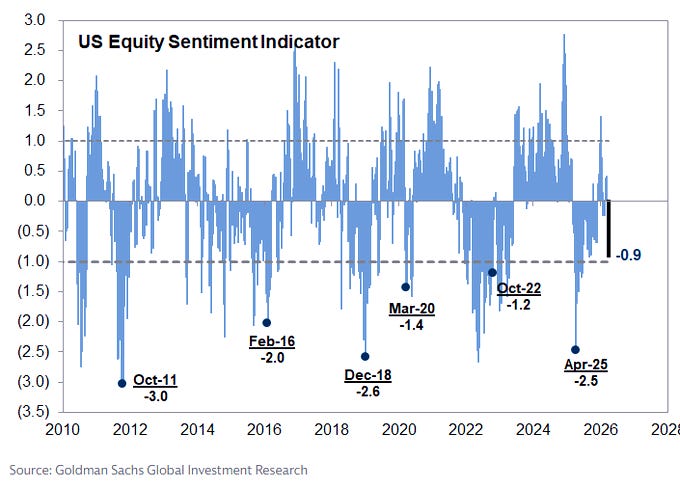
And finally, sentiment has continued to deteriorate, with GS’s U.S. Equity Sentiment Indicator now sitting around -0.9, reflecting a meaningful reduction in equity exposure. Historically, readings below -1 have tended to align with stronger forward equity returns, with the signal becoming more compelling as the indicator pushes further into more extreme territory, particularly below -1.5.