
The Week Ahead 6/14/26

Hello All,
I hope you’re all enjoying the weekend and getting some time away from the screens & wishing you all a successful remainder of ‘26.
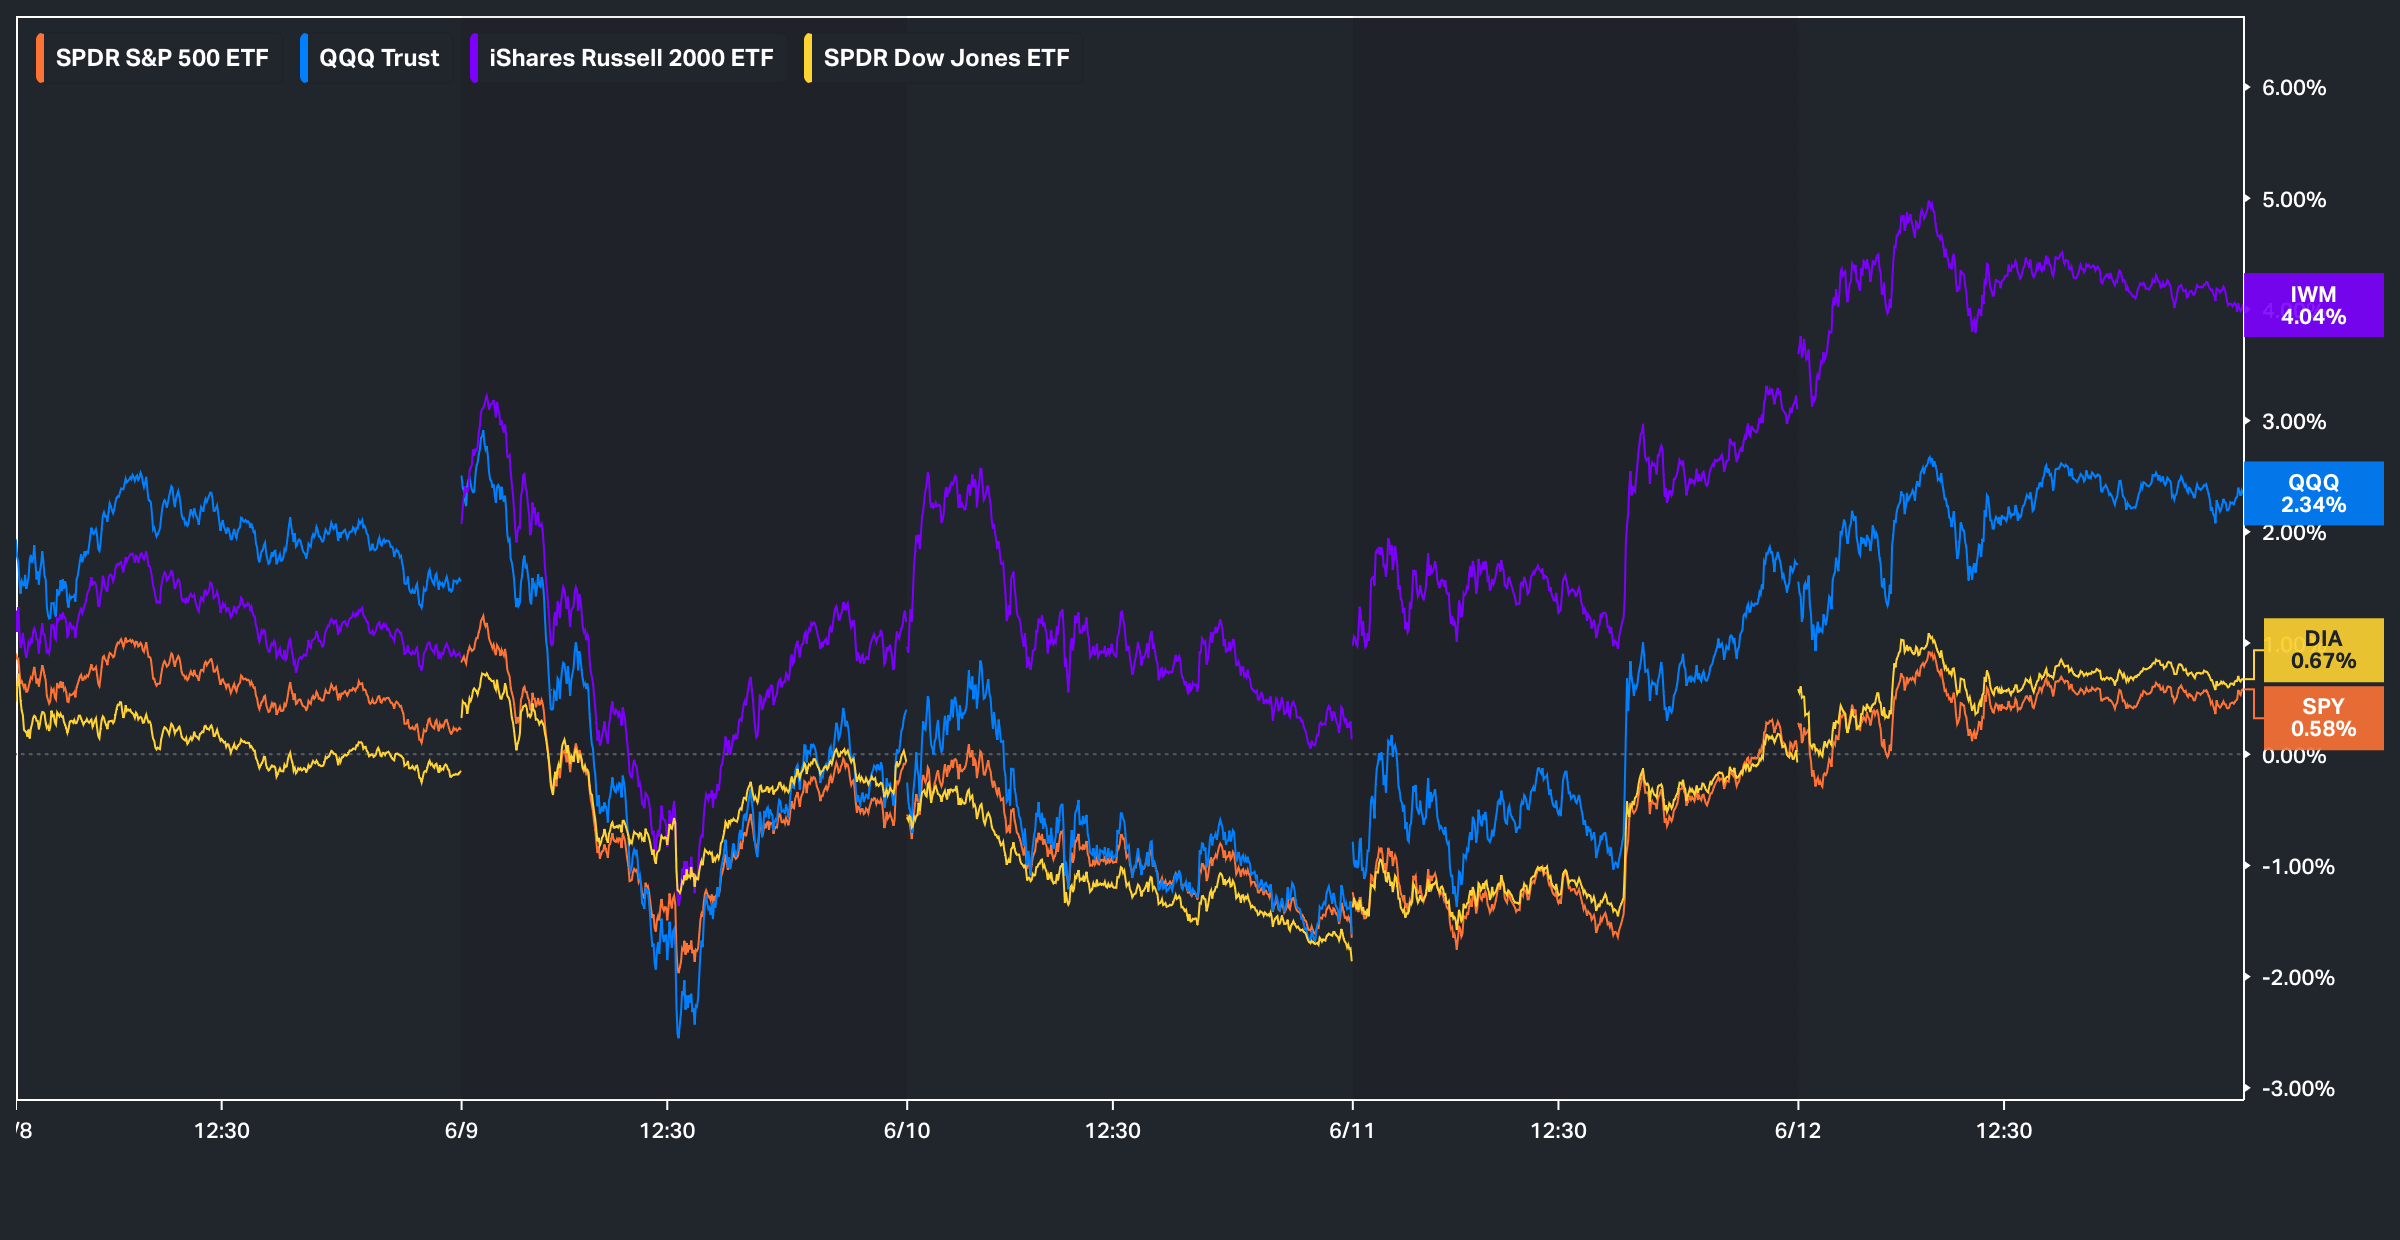
Jumping straight into it, on the economic data front, this past week ended up being a quieter one & initially earlier on into the week, it was mostly characterized by a followthrough of the prior week’s momentum unwind before the indices then ended up bottoming into the latter half of the week following the MOU reached between the U.S. & Iran instead of a resumption of war / significant escalation.
And on the week, by a long shot, Small Caps were the best performing of the indices, having closed higher by just over 400bps whereas Spooz was the ‘worst’ performing of the indices on the week, yet still closed higher by just under 60bps.
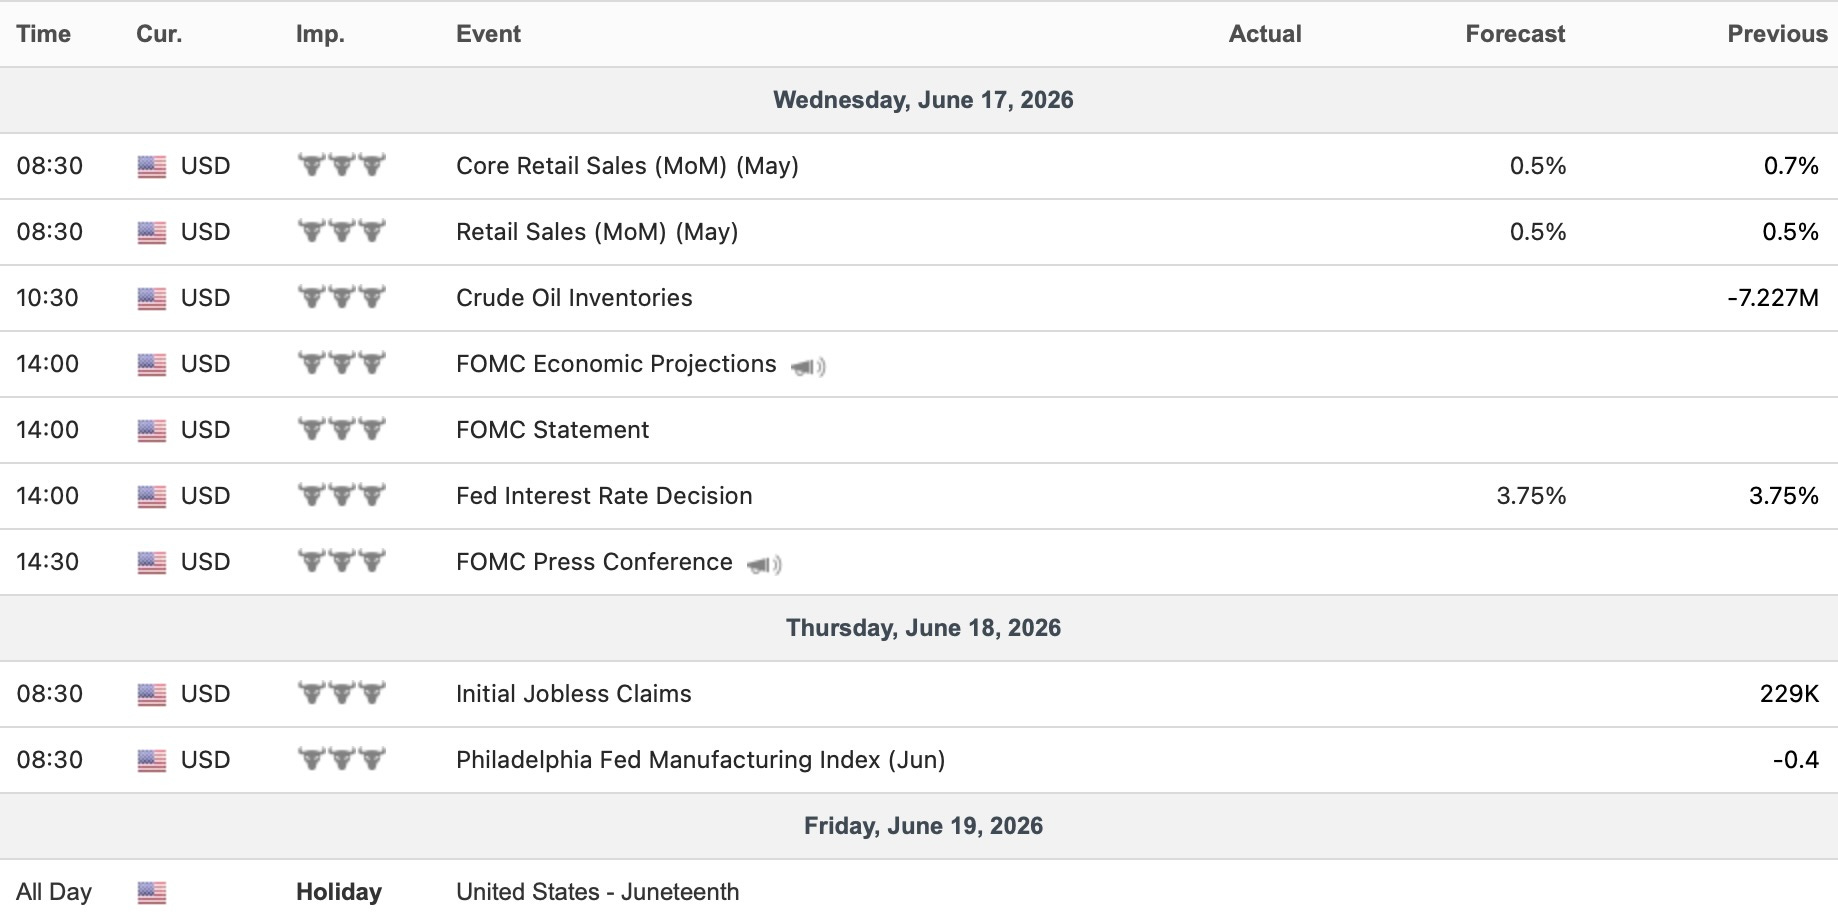
- Economic Data for the Coming Week:
In regard to economic data heading into the upcoming week, it’s somewhat of a quieter one with really the biggest event being FOMC on Wednesday along with Retail Sales in the morning, but otherwise, there isn’t necessarily too much else going on & it’s also a shortened week, with markets being closed on Friday for the holiday.
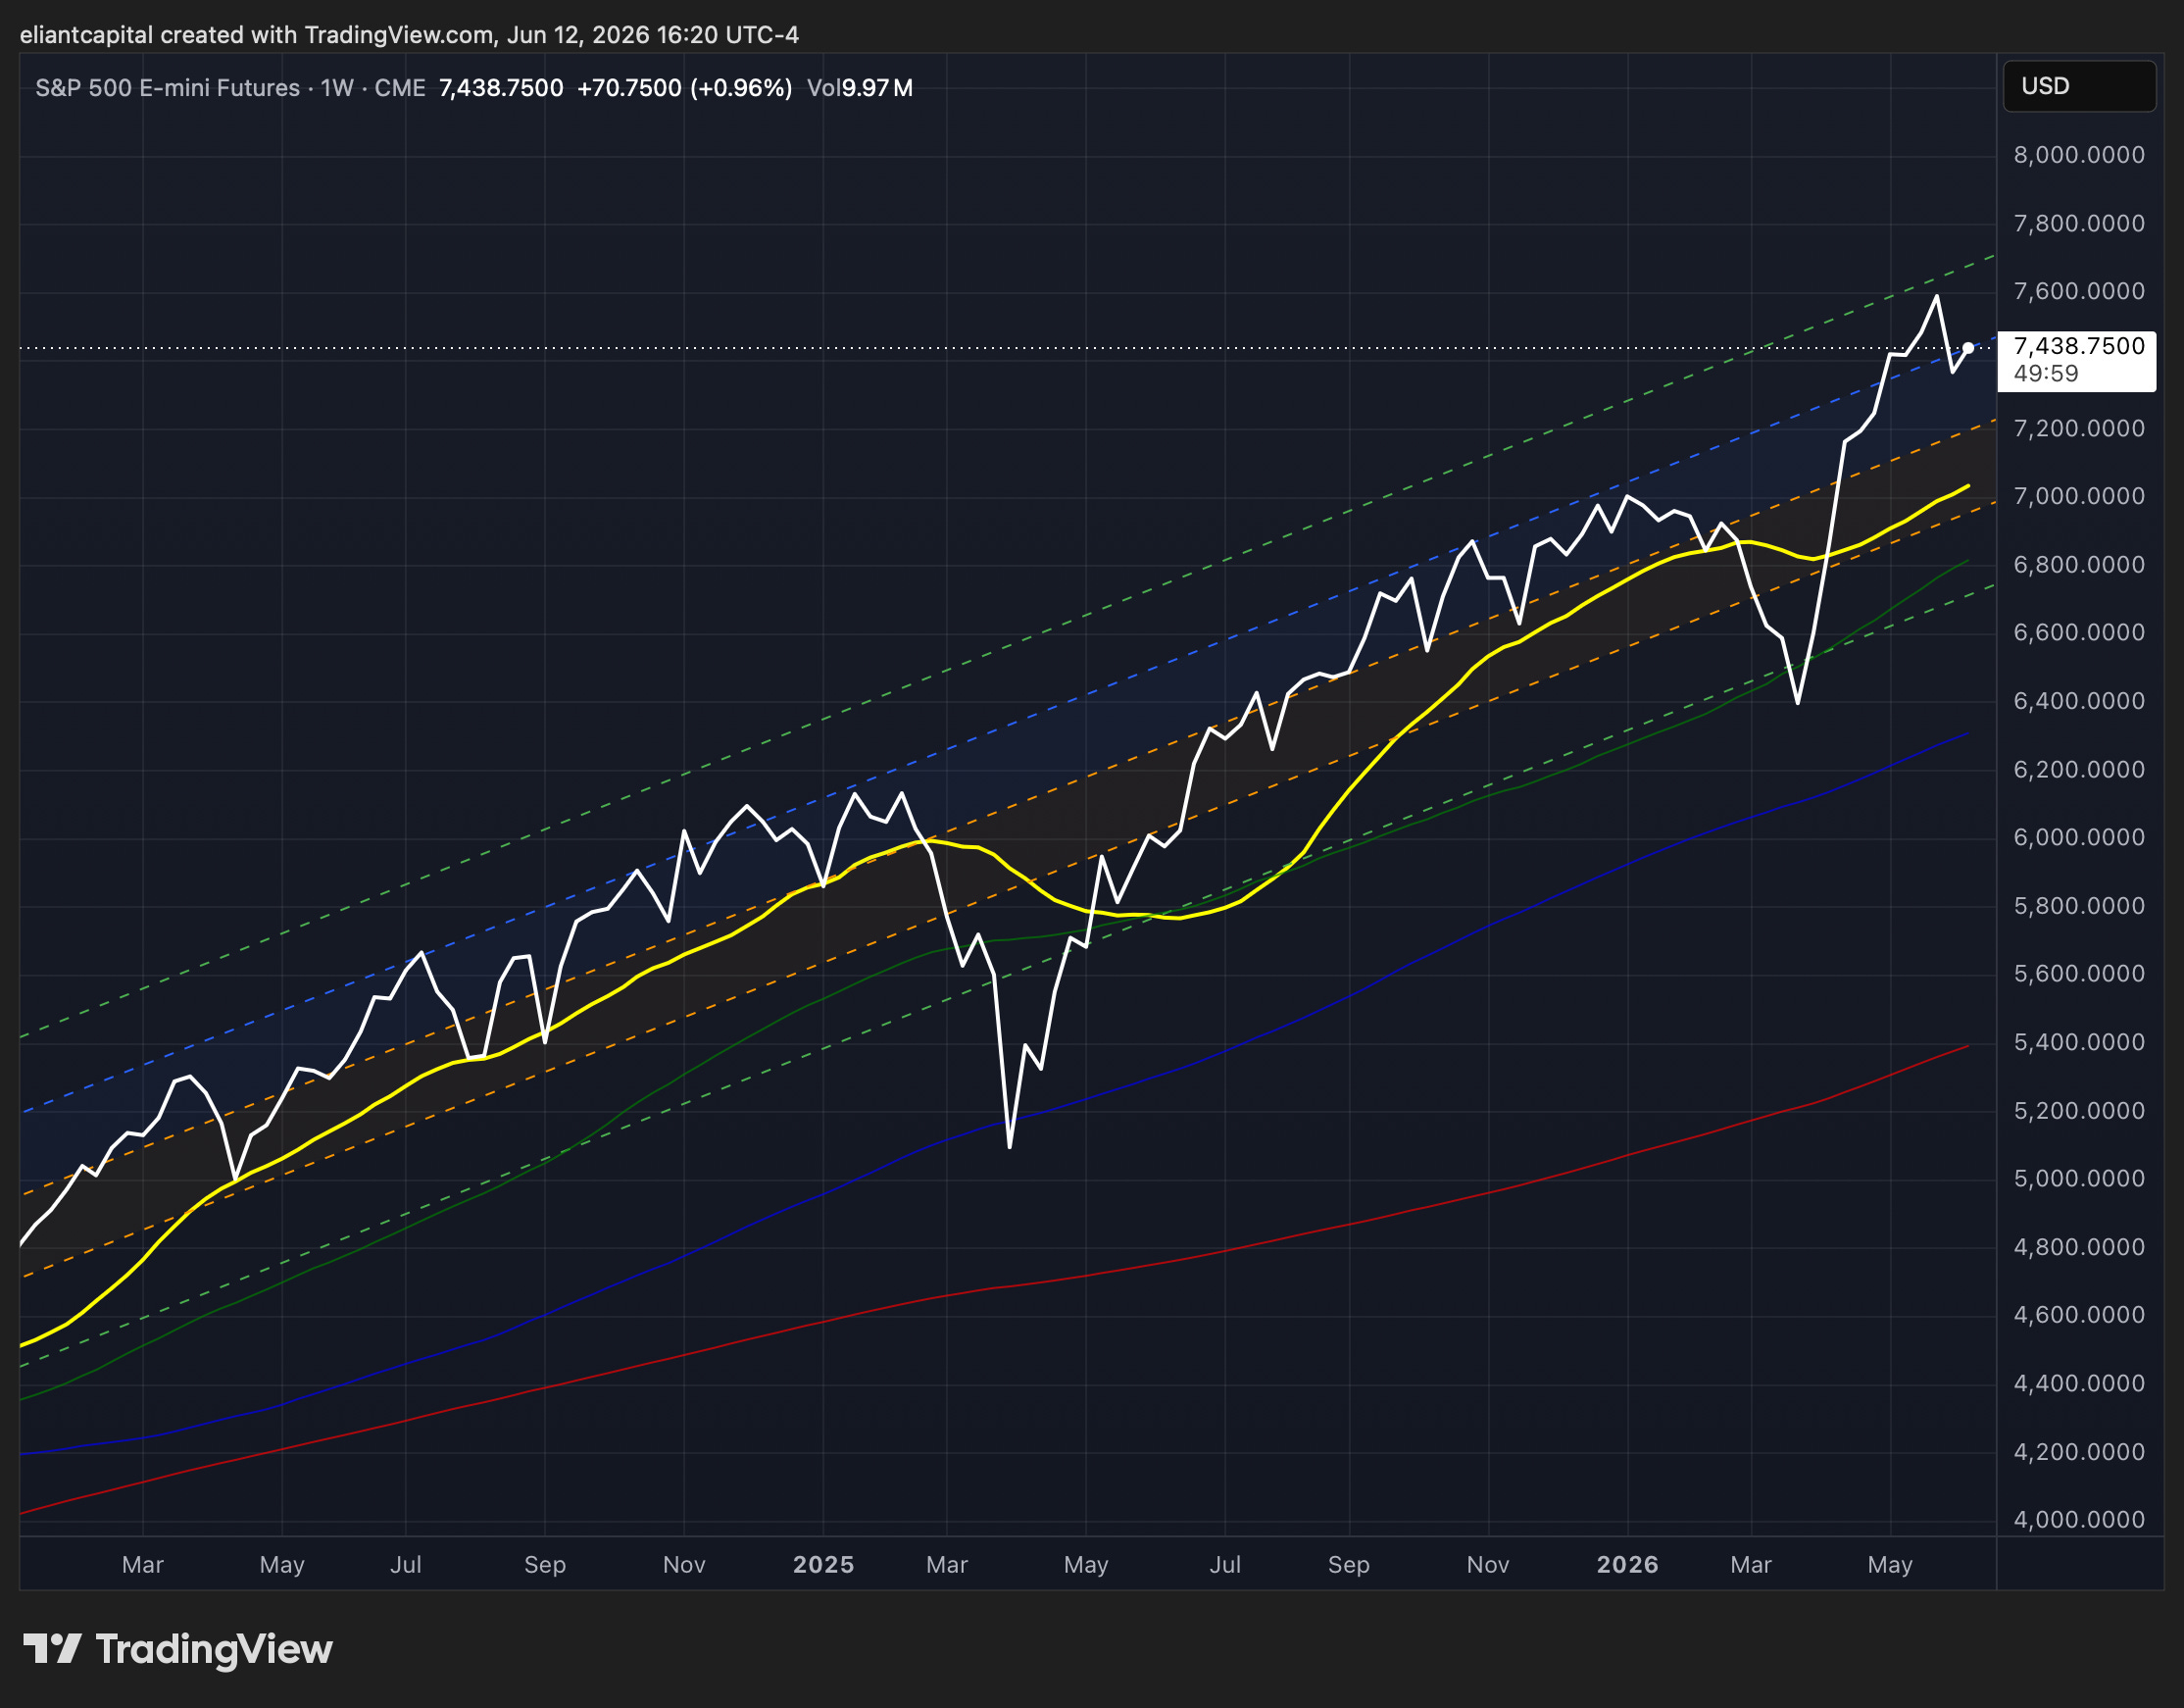
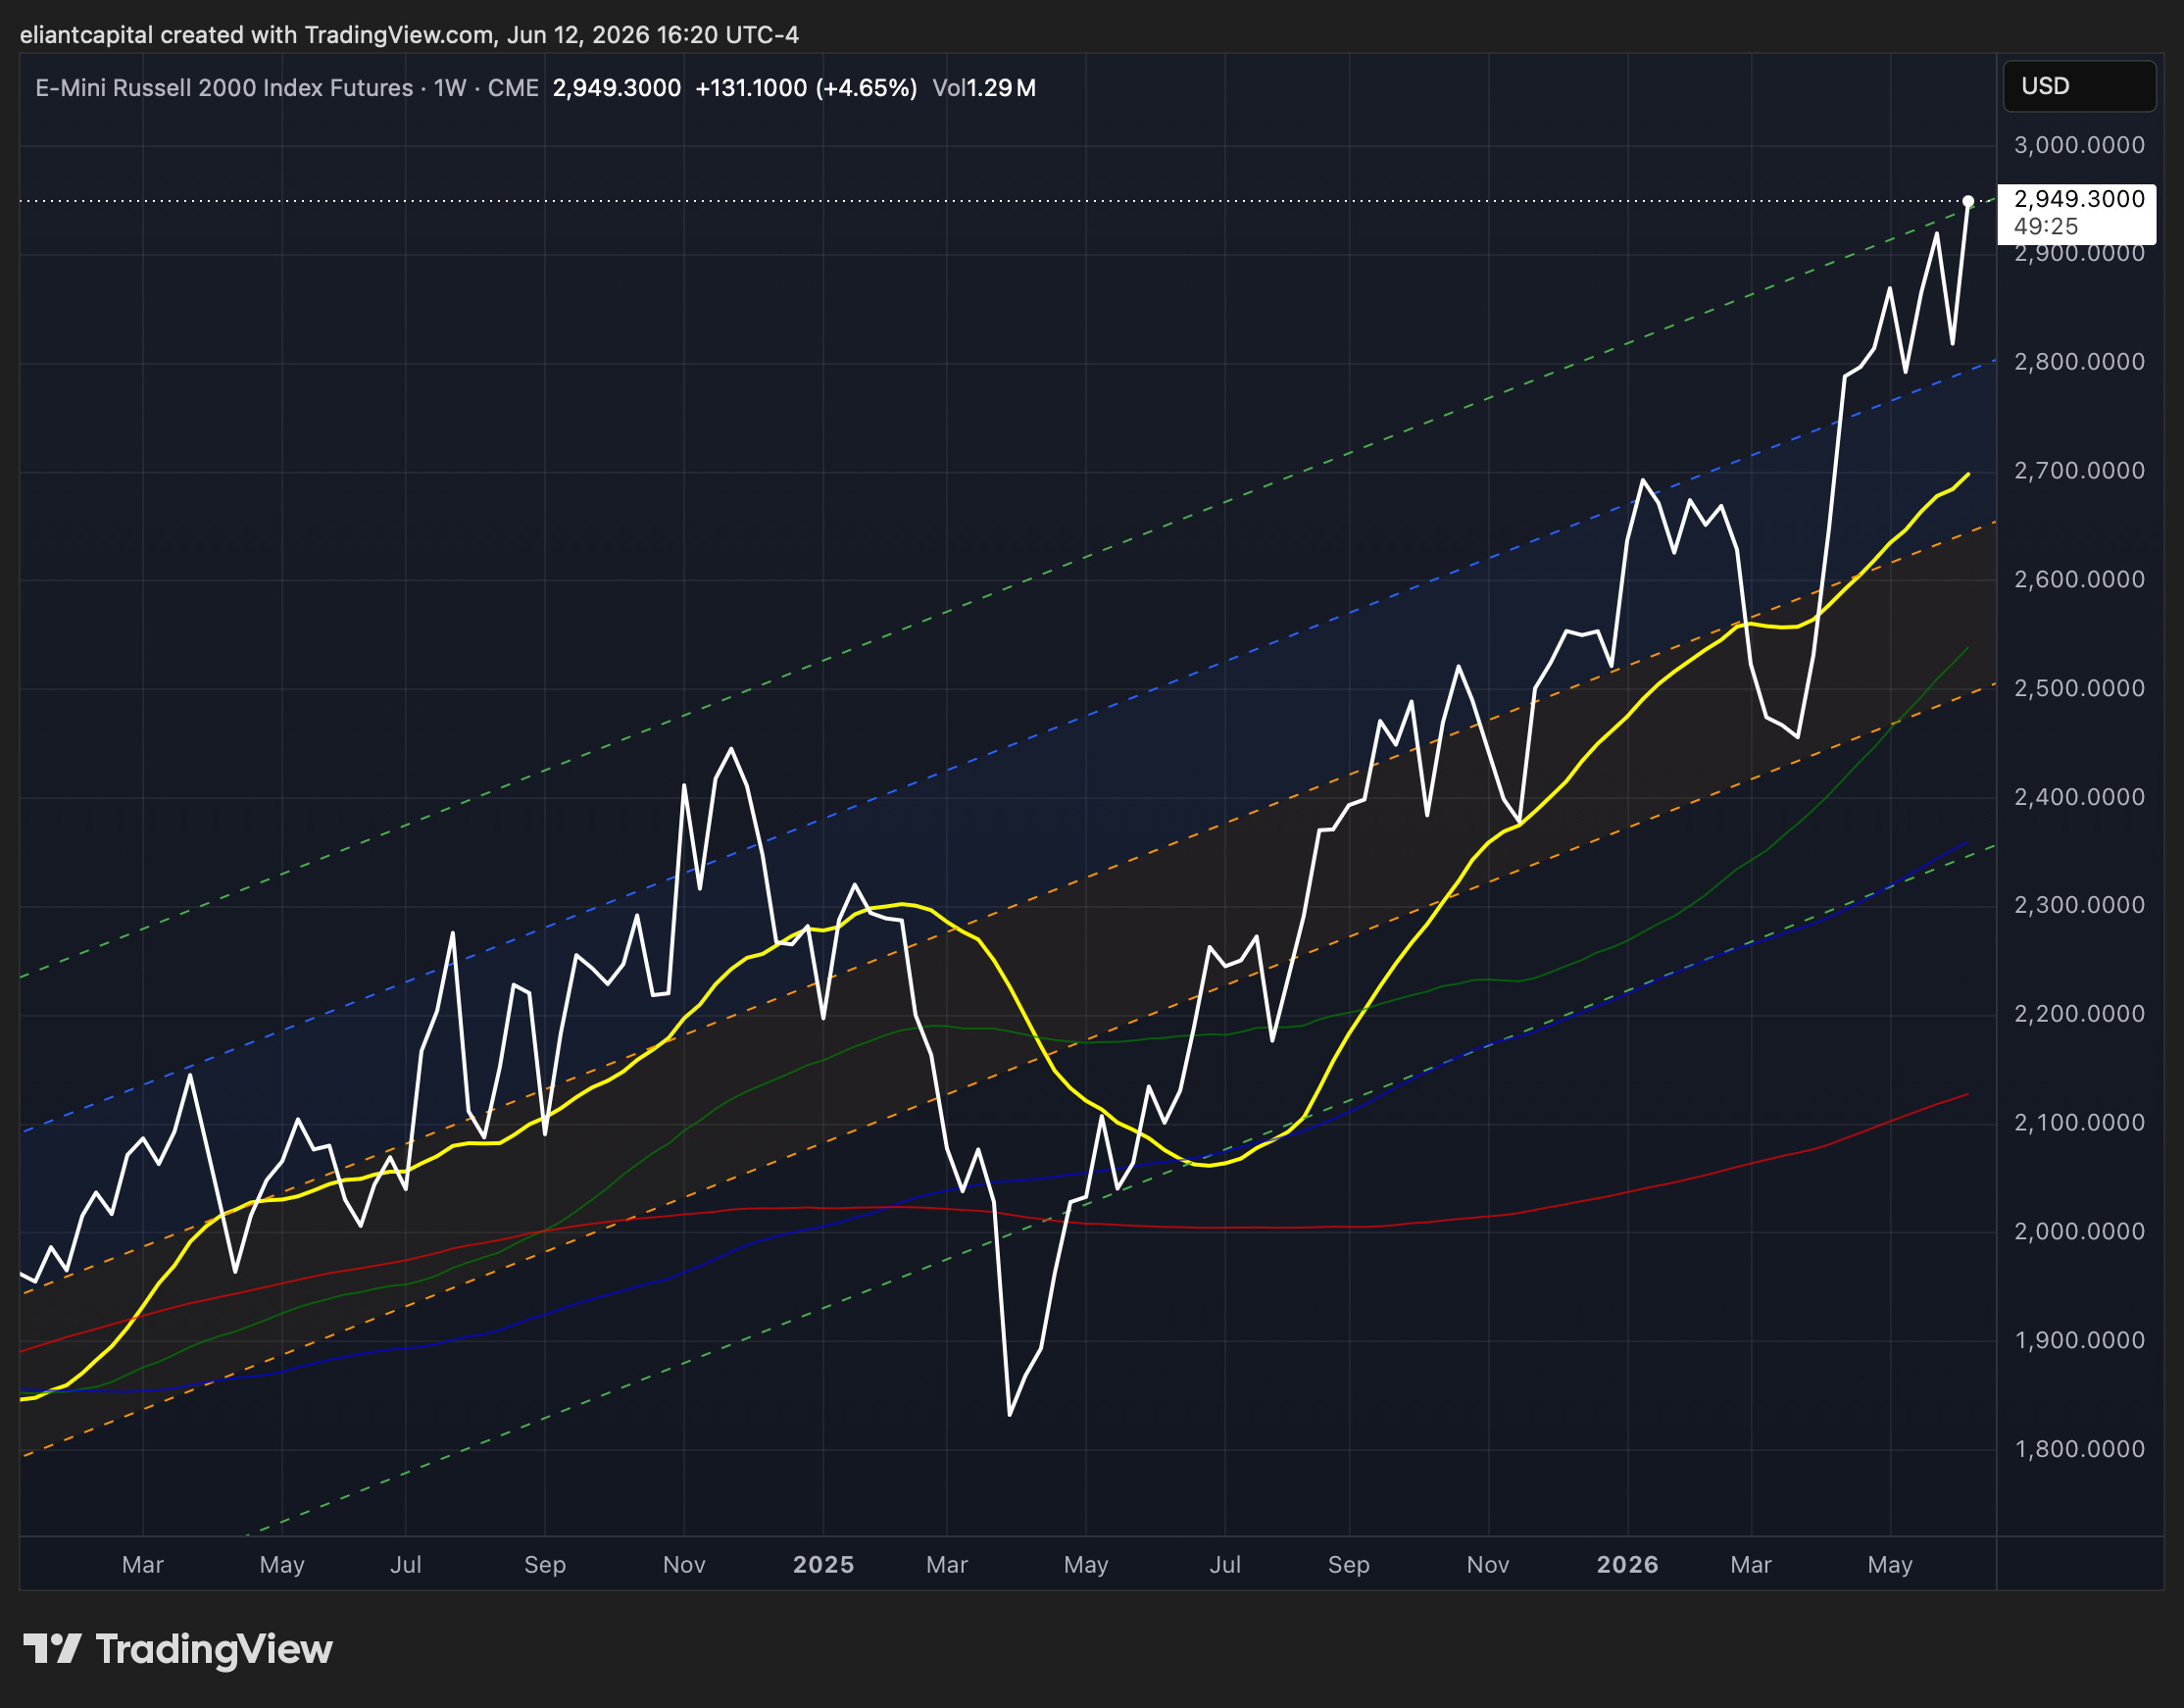
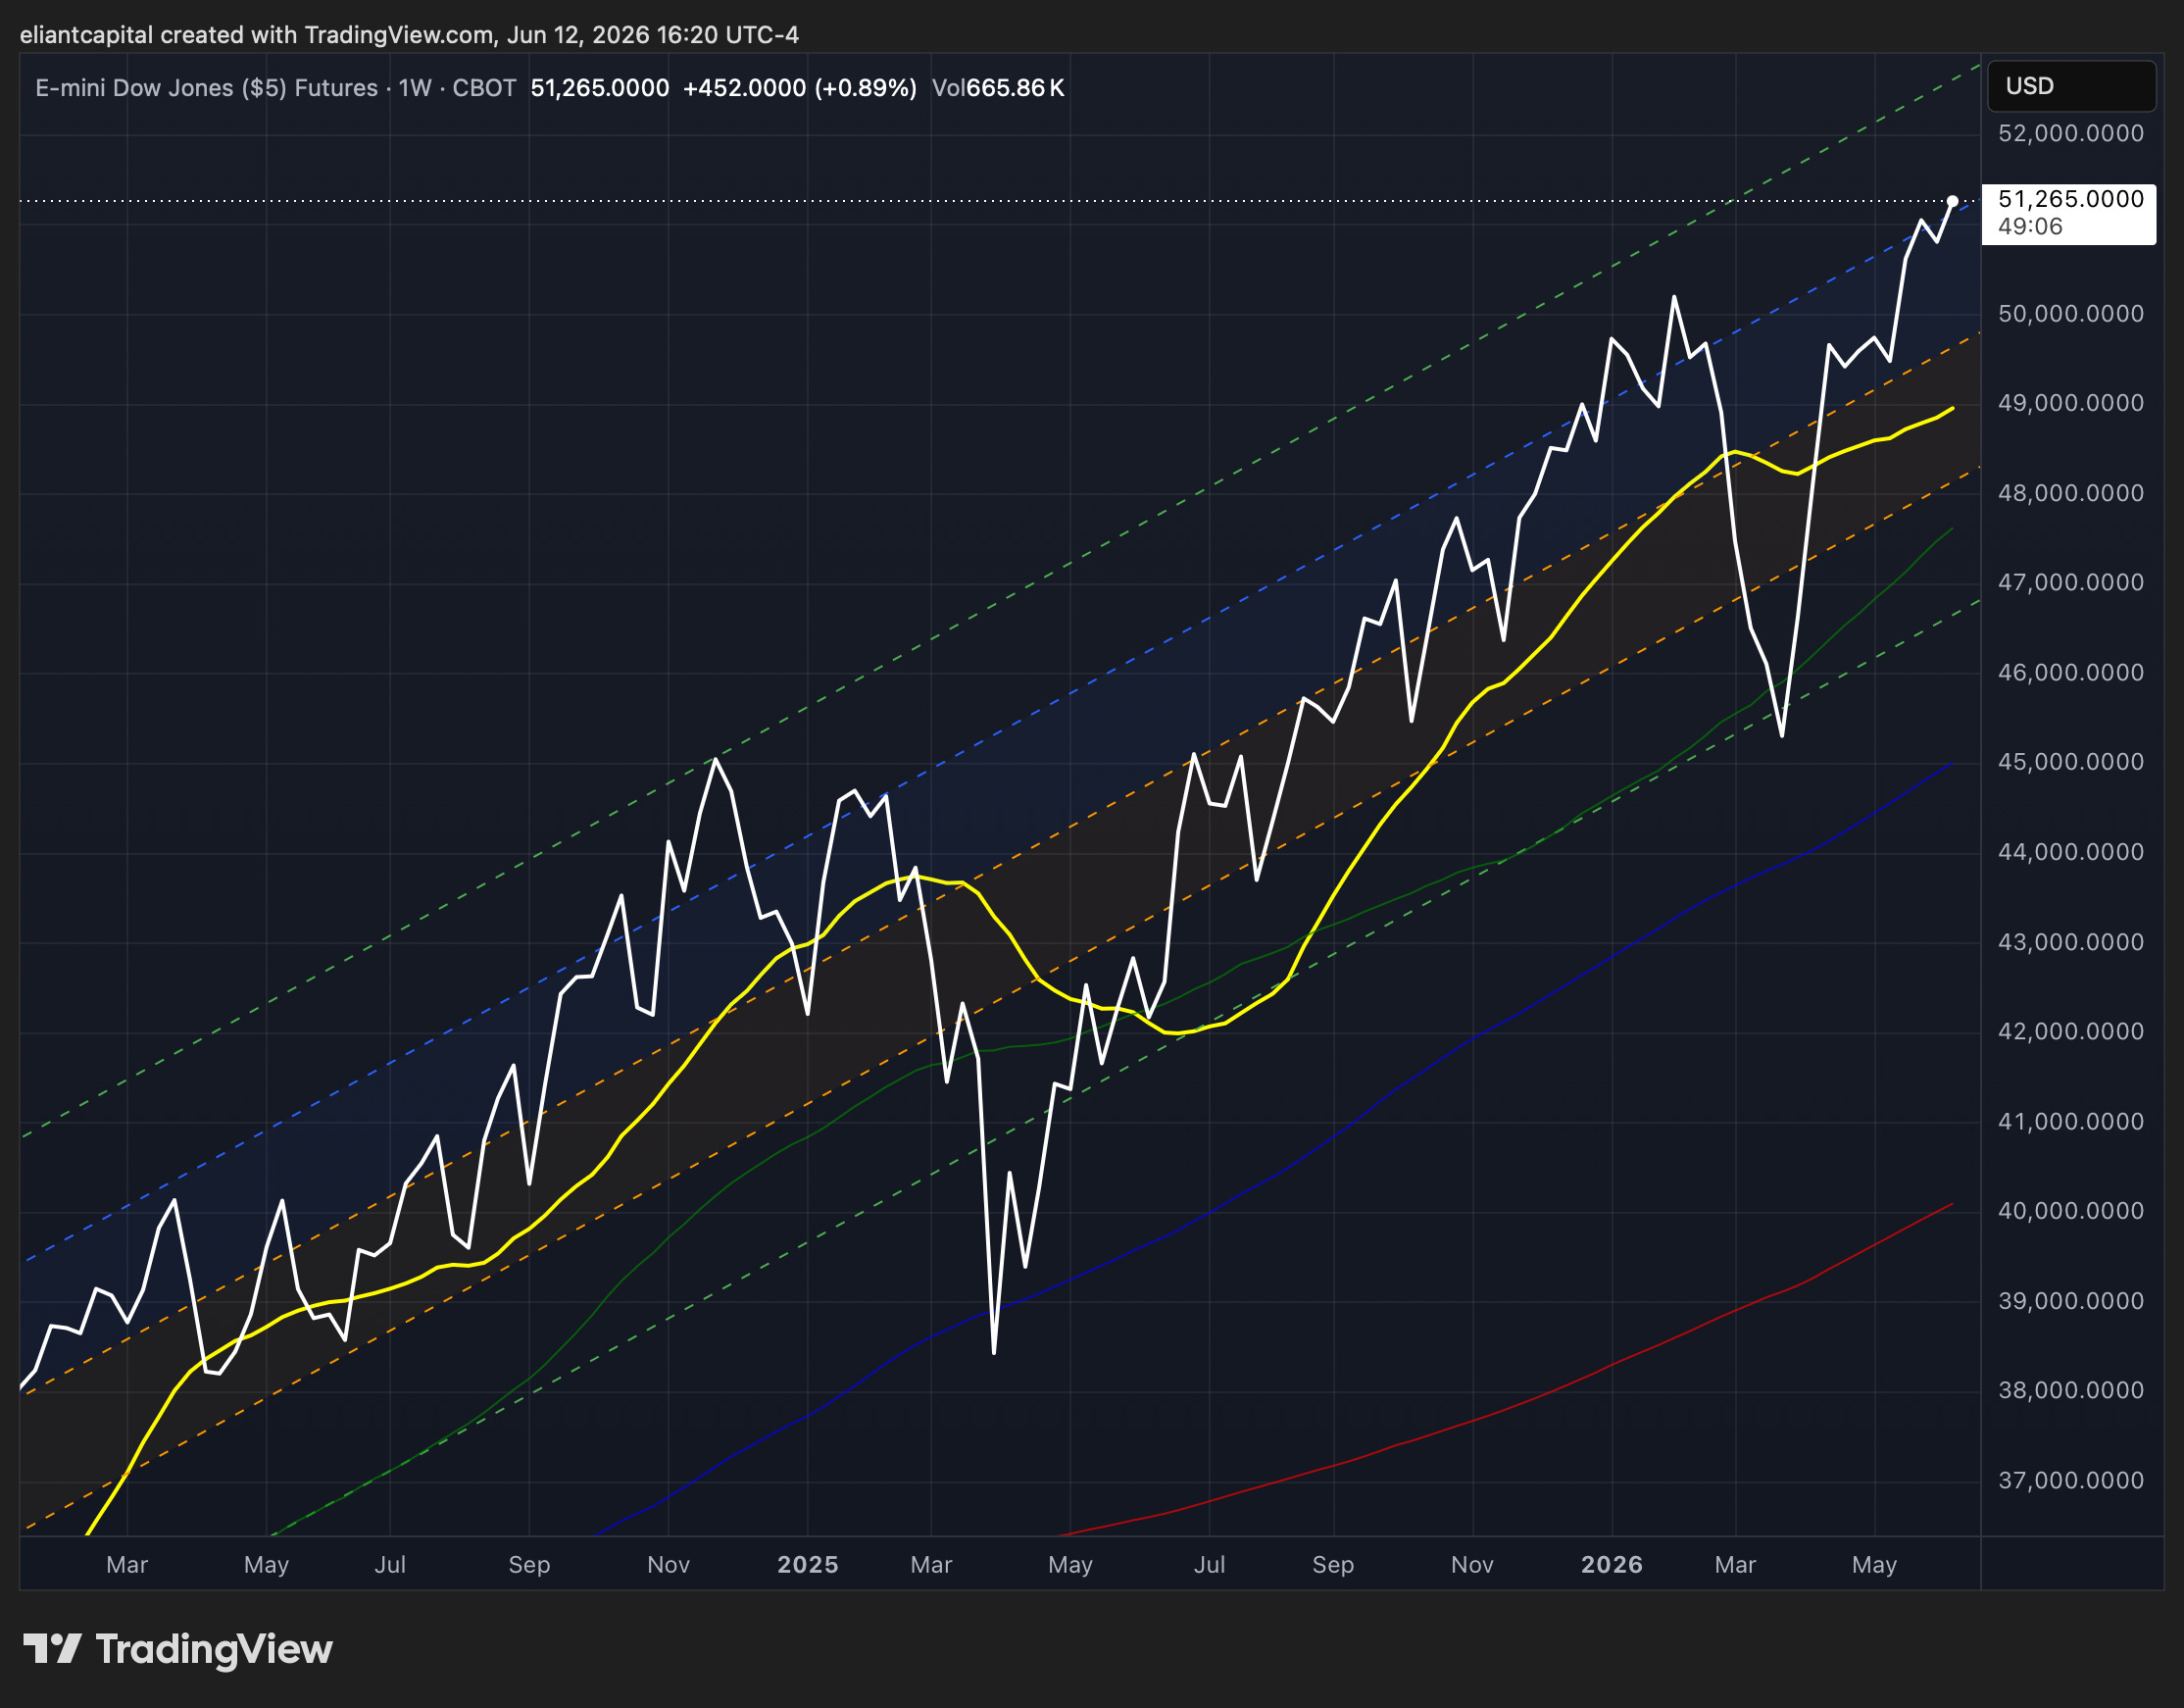
- STD Channels on Indices for Perspective: Weekly TF
- SPY
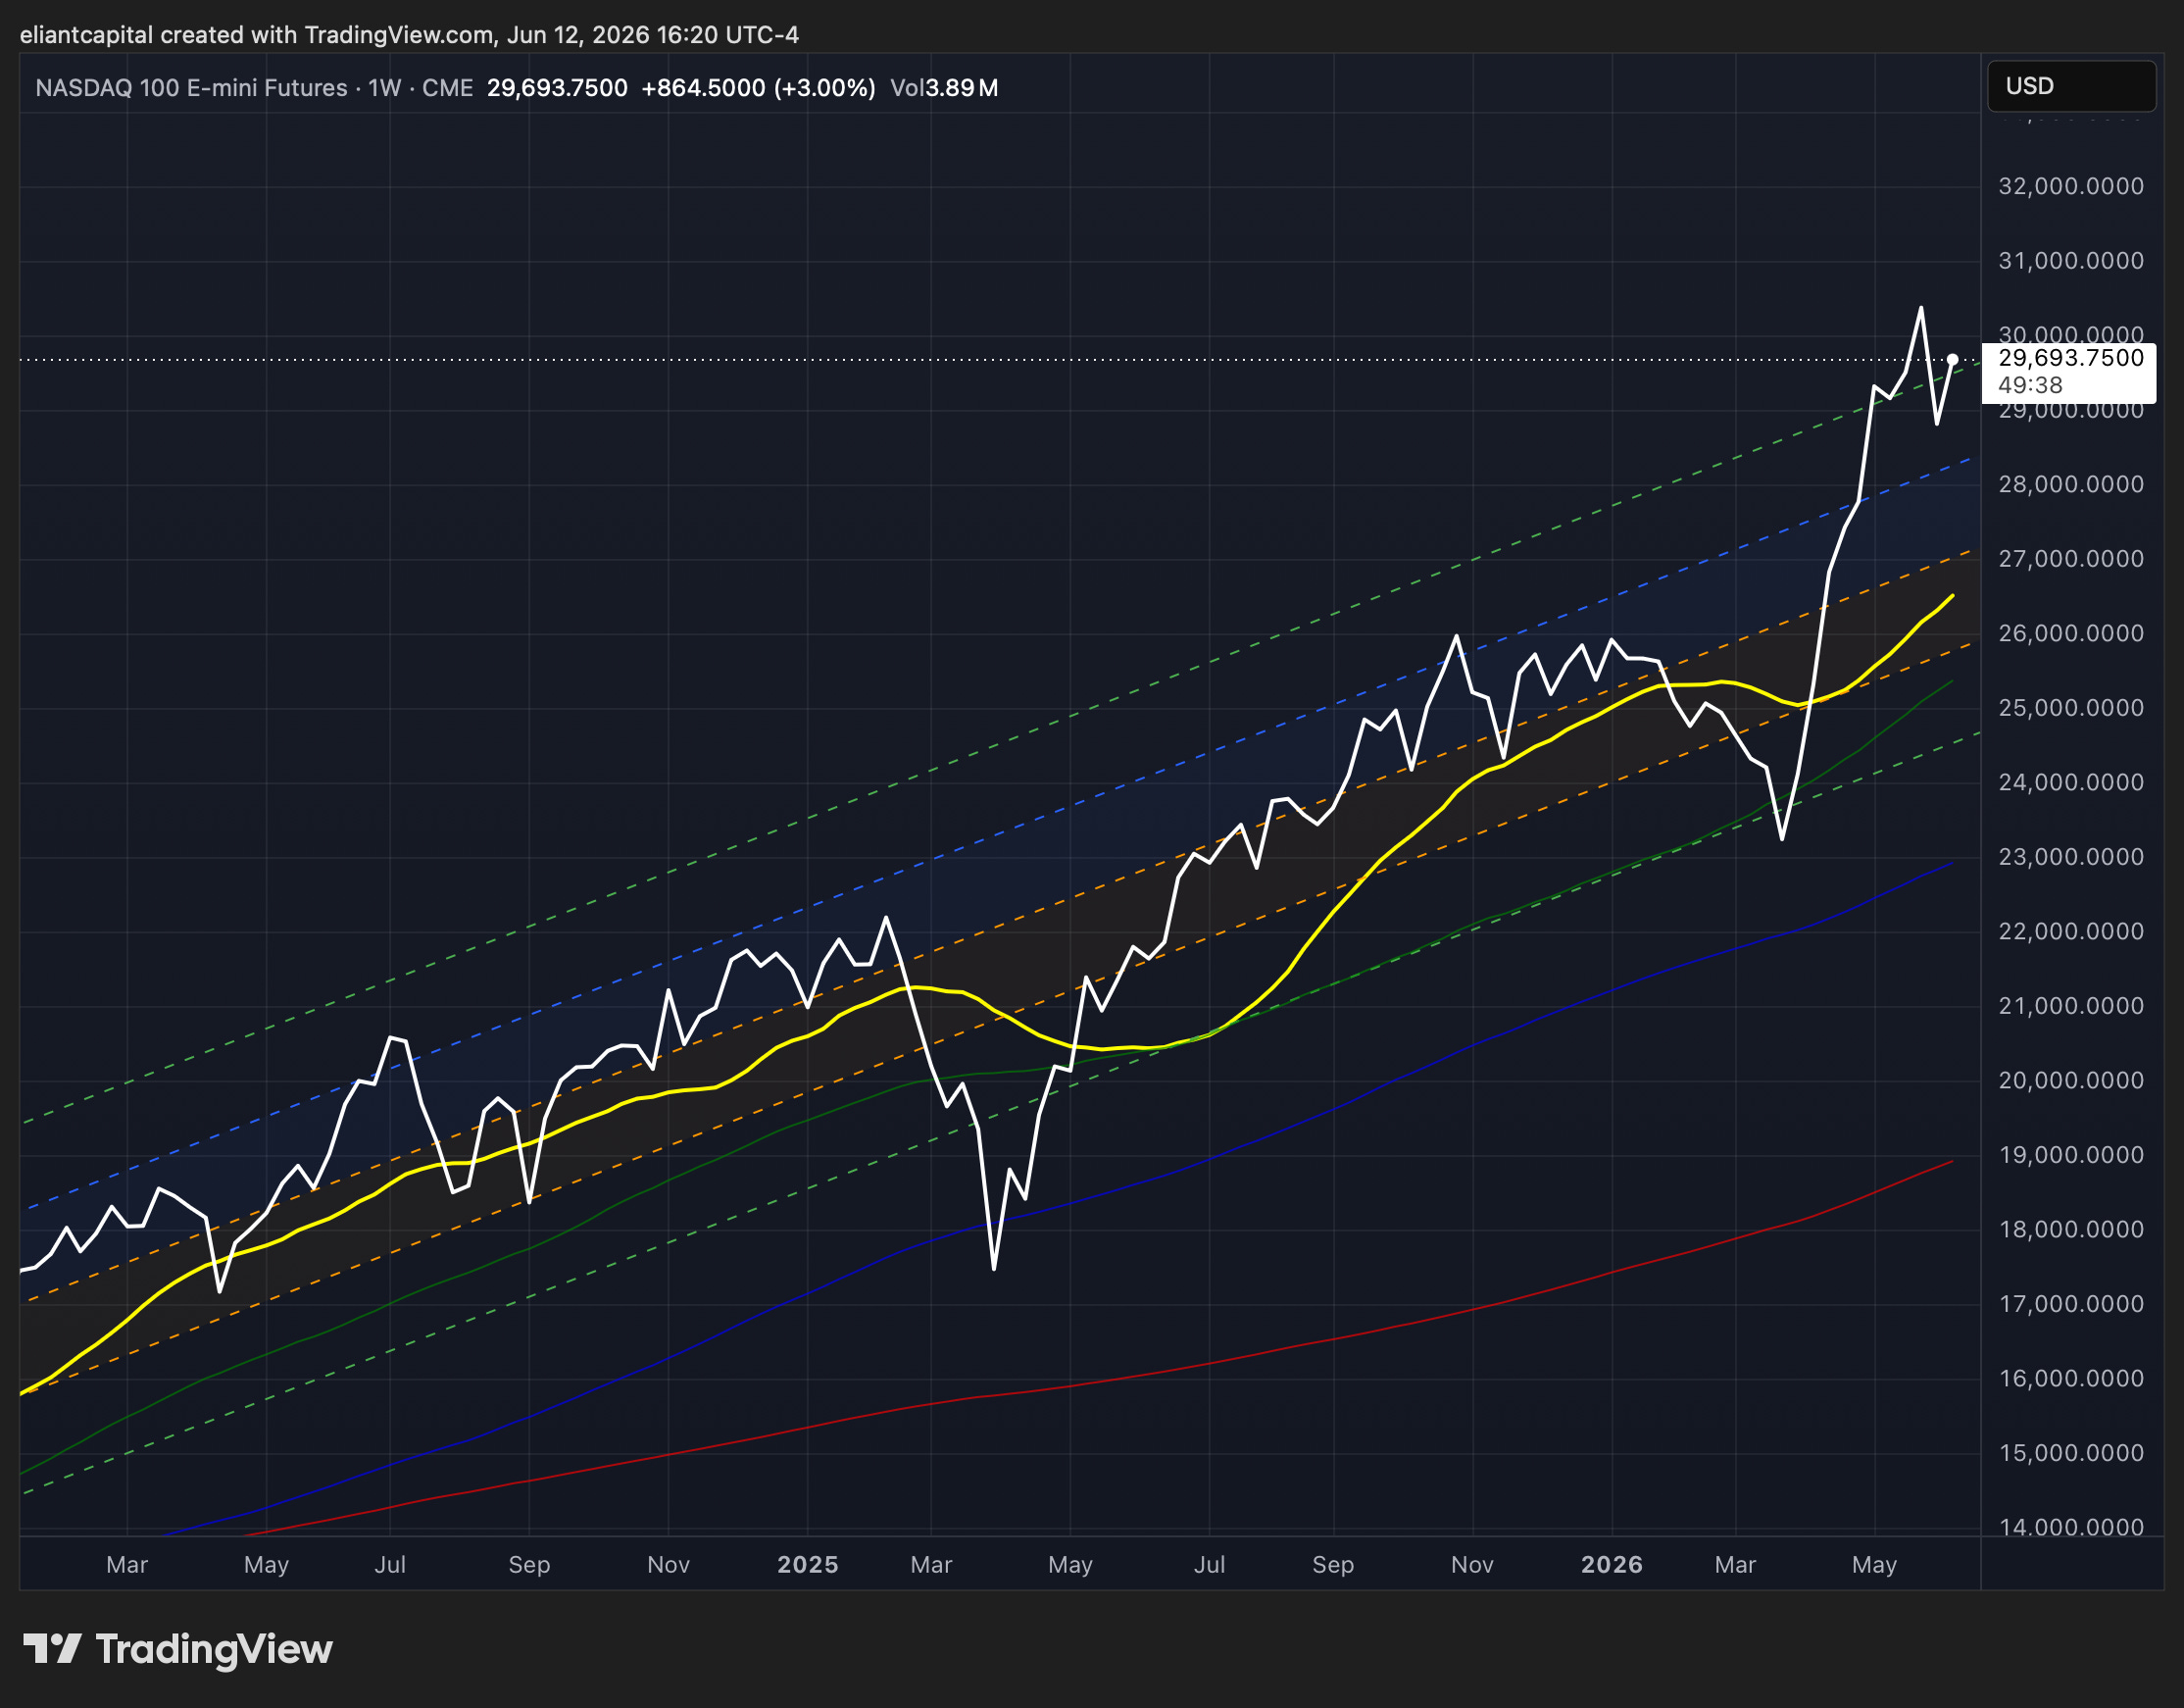
- QQQ
- IWM
- DJIA
Since starting this Substack back in June of ‘23, between individual names / tactical trades / baskets, we have netted a 191.96% return whilst in the same period, the Q’s have returned 105.04% / Spooz has returned 78.02% / Dow has returned 59.41% & Small-caps have returned 67.56%, so nice outperformance against all the indices whilst having a 81.9% win rate, averaging a 30.53% return on realized gains / winners & a 15.76% loss on realized losses / losers.
Looking forward to the future & continued success through ‘26.
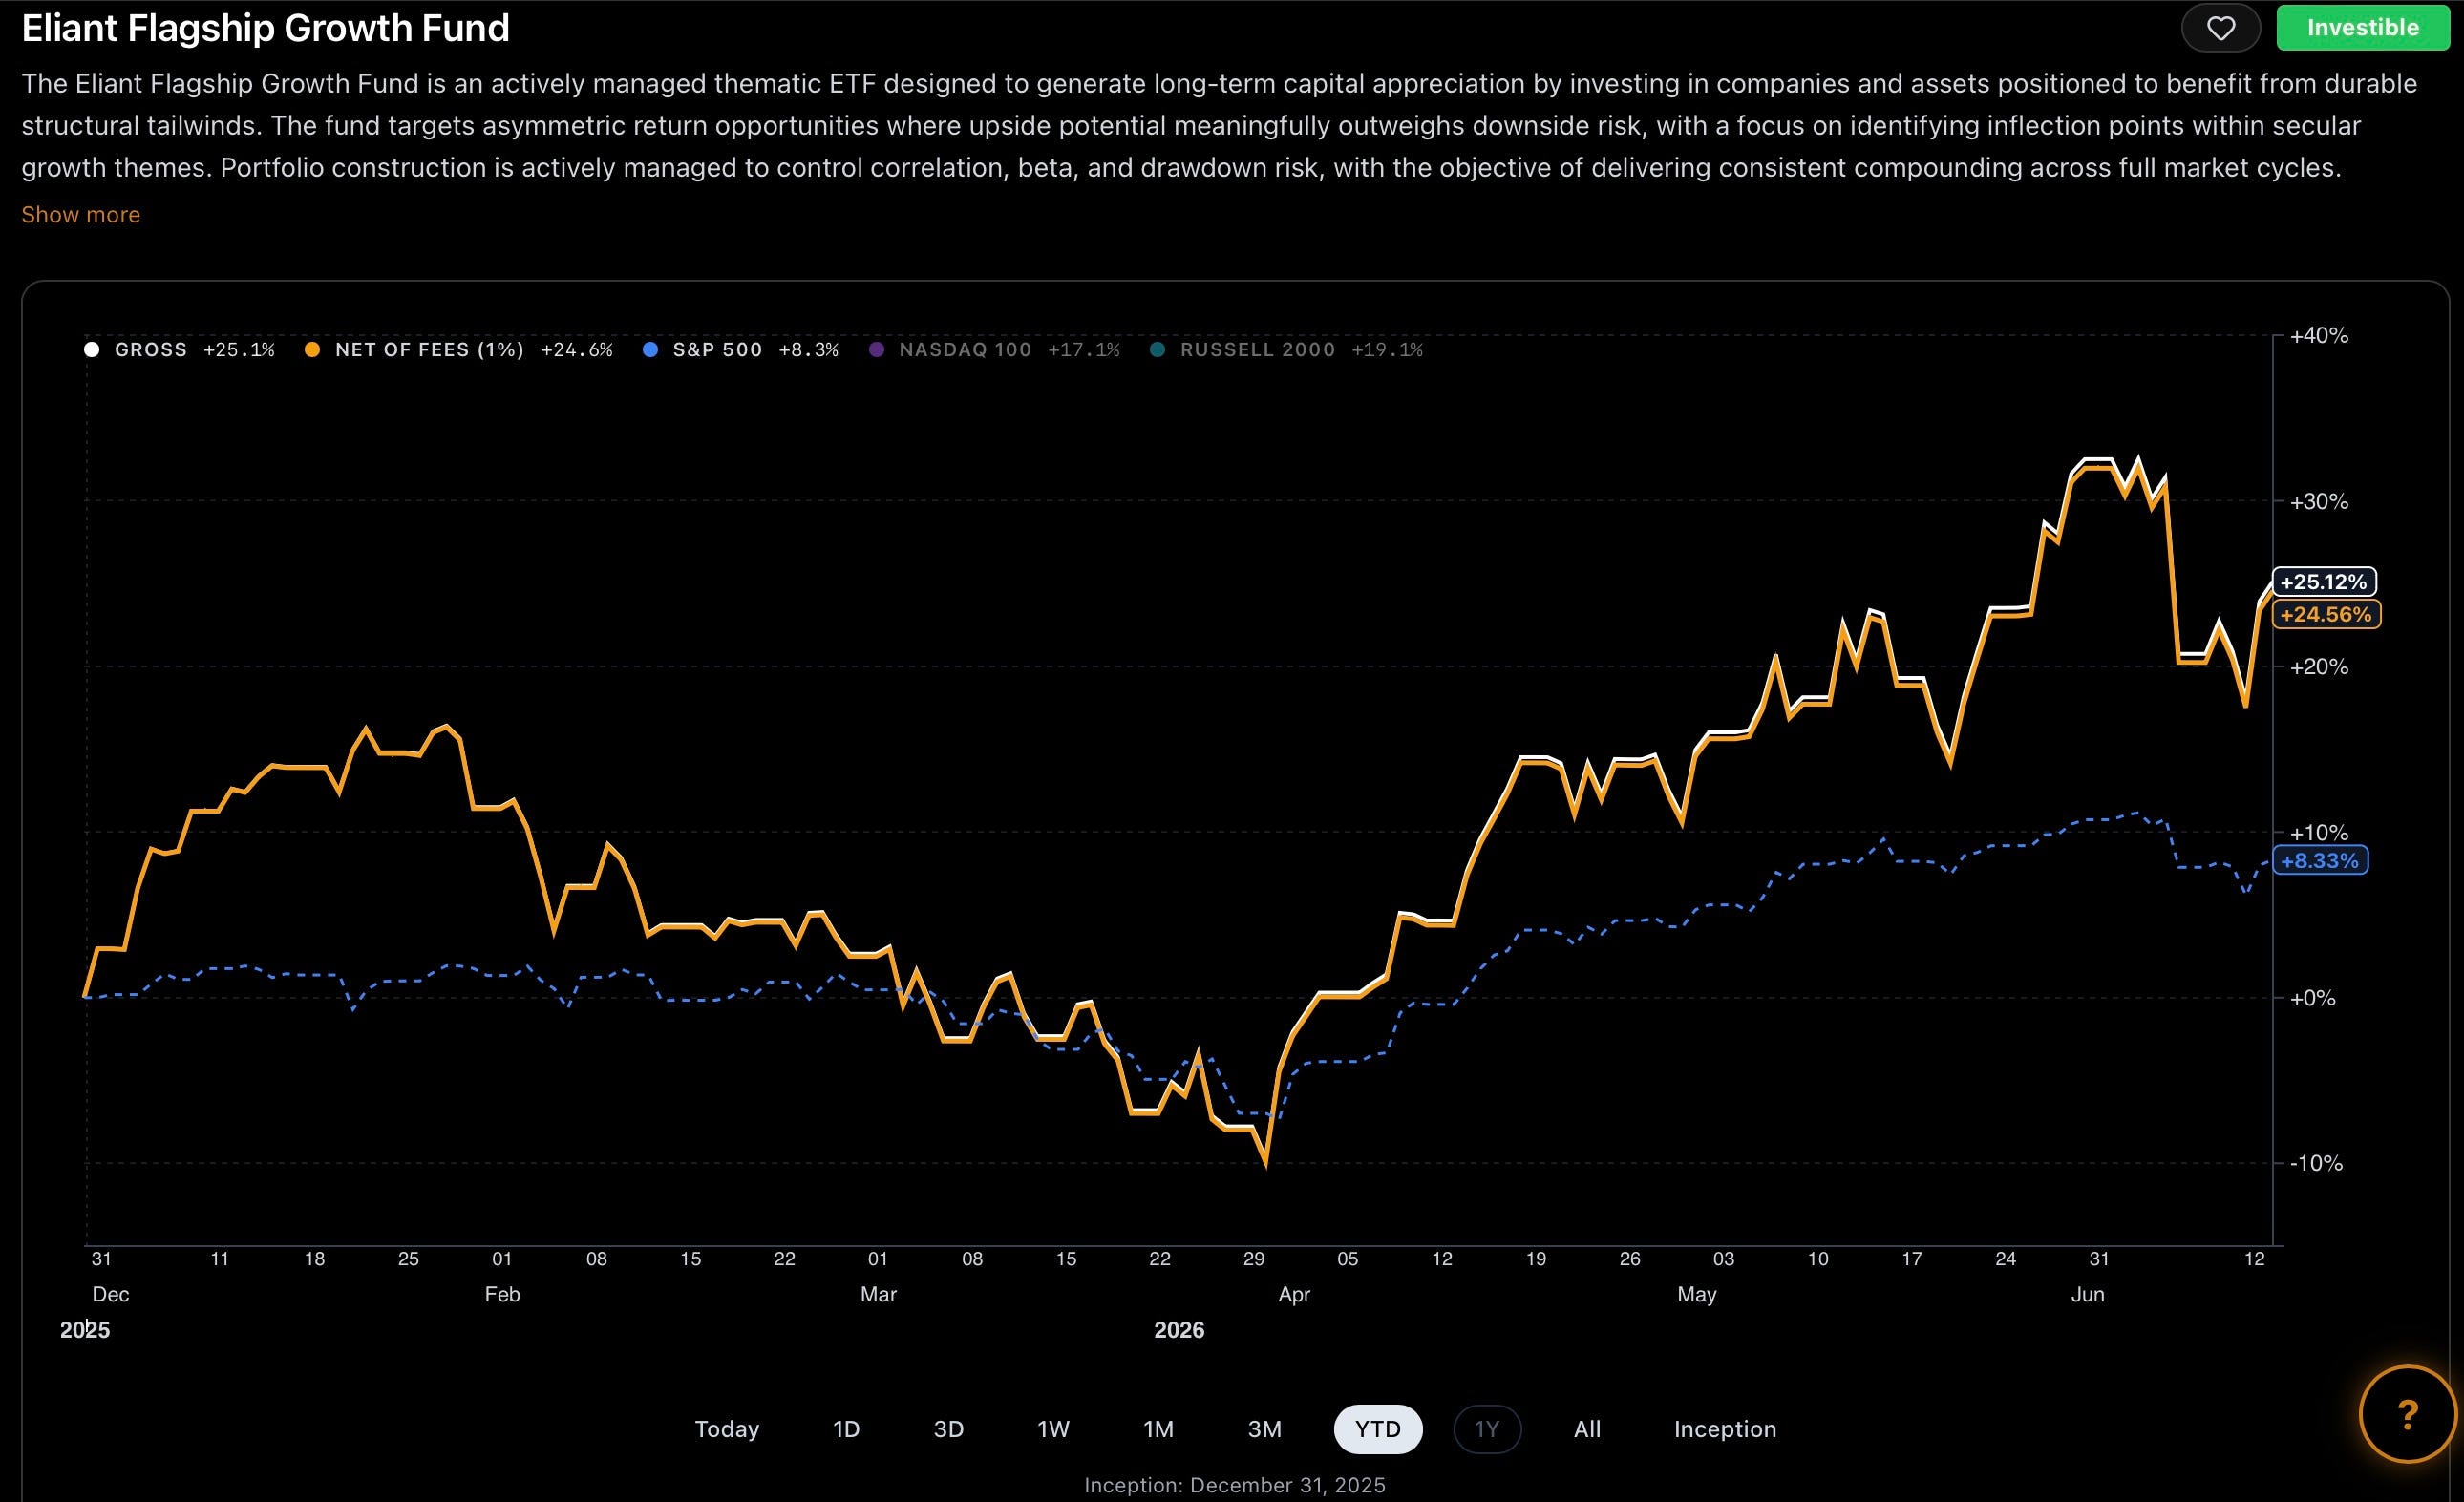
And for anyone who wants to follow an actively managed portfolio in real time:
I’ve joined Plutus as the cleanest, day-to-day way to track an actively managed portfolio in real time. It’s a live dashboard that’s broader, more diversified, actively managed by me, & updated continuously.
The Eliant Flagship is published on RunPlutus.
Once your Plutus account is approved, you’ll have the option to allocate right away. If you do, it’s straightforward: create an account, link your brokerage (Available only for IBKR at this time), & select the Eliant Flagship (or any of the baskets I’ve built). Your money stays in your account, and trades, position changes, and rebalances are replicated automatically so there’s nothing manual to manage. The idea is to make it easier to access an actively managed portfolio run by me without the overhead of traditional fund structures or high minimums, whilst you keep full custody of your assets & I stay focused on research, positioning, and portfolio construction.
Earlier in 2024, we launched a series titled Educational Pieces, covering a wide range of topics, many of which were suggested directly by you all (4-Part Series).
For those who may have missed the first installment, it covered topics including:
General background / knowledge on all option strategies
In-depth talk on risk / reversals & how to go about expressing / utilizing them
Options Structuring
When to used naked calls / puts vs. spreads
Choosing expiration dates
Identifying key pivots / supports / resistance zones
General briefing on stock gaps
What to look for in regards to fundamentals
Implementing fundamental / macro / technicals into a trade
Hedging
Creating risk/reward setups
Taking profits / managing losses
Overall Process
Book recommendations
A link to the original Educational Piece can be found here .
Given the positive feedback and how useful many of you found the first installment, we followed up with Educational Piece: Part Deux earlier in 2025 & for those who may have missed, a link to the piece can be found here & we then went on to release Educational Piece: Part Trois which can be found here.
And finally, the most recent installment, Educational Piece: Part Quatre, can be found here.
‘Risk management is the silent prerequisite for compounding & true wealth is built not by chasing the highest returns but by ensuring the survival necessary to realize them.’
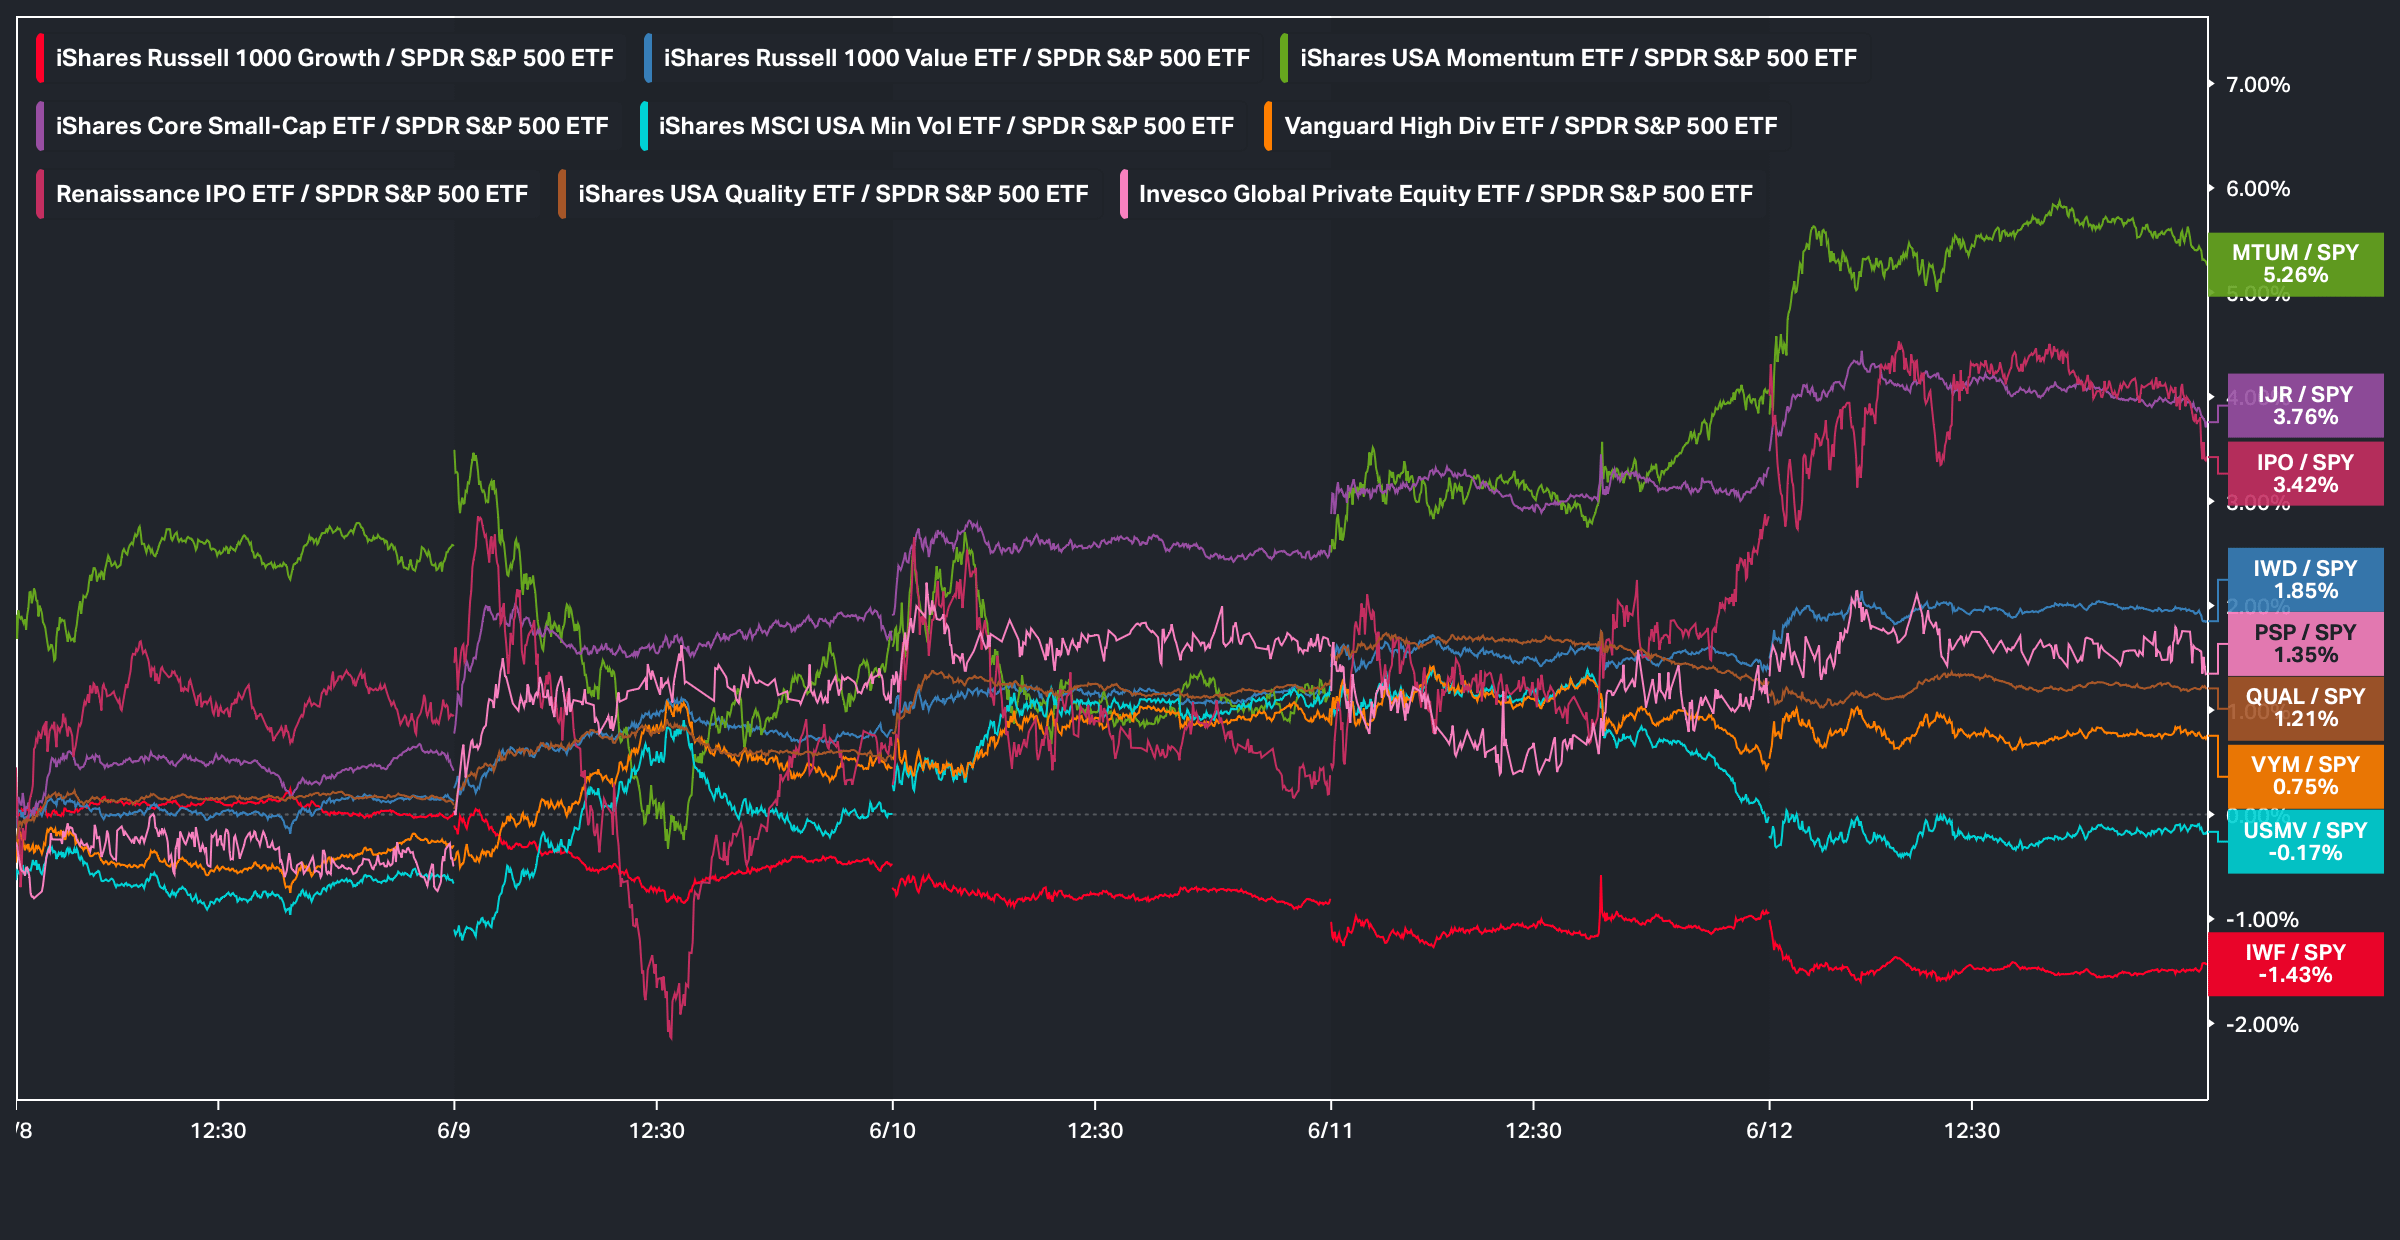
Before we jump into the week ahead, in looking back at this past week, it was a bit of a wonky one that was initially characterized by an earlier-on in the week momentum unwind, which then ended up bottoming out & oddly enough, of all the factors, Momentum ended up being the best performing one, followed by Small Cap Value whereas on the opposing side, Growth by far ended up being the worst performing factor, as these past two weeks have seen a bit of rotation from Growth back to Value as volatility has picked back up within the indices.
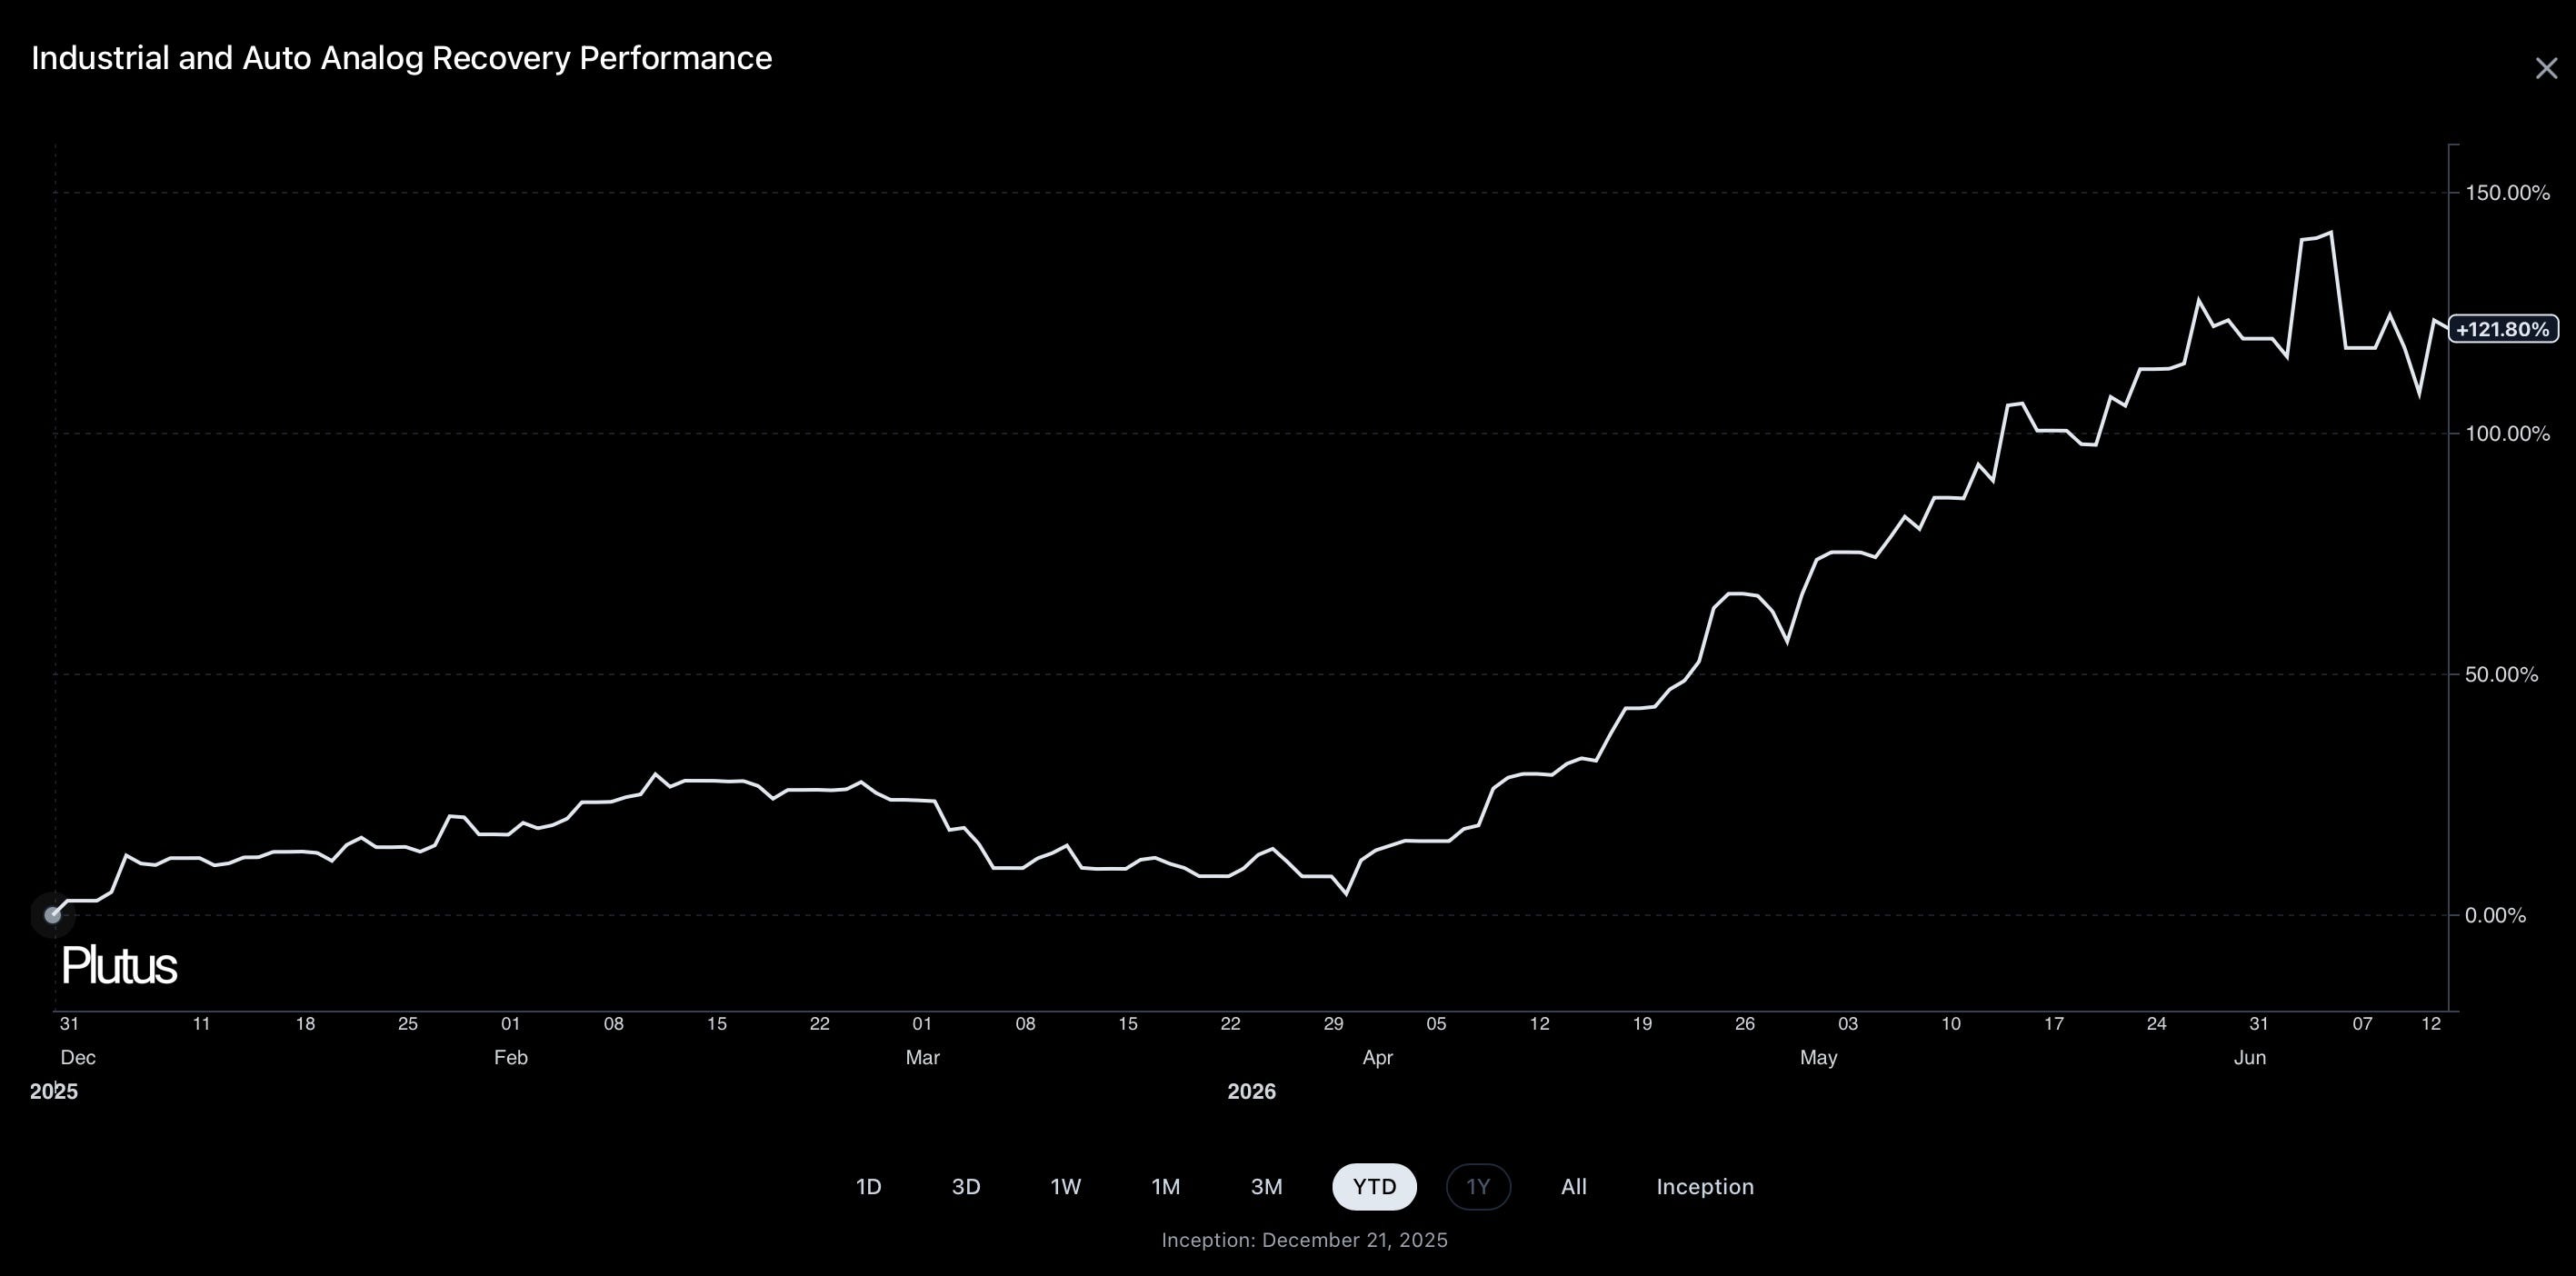
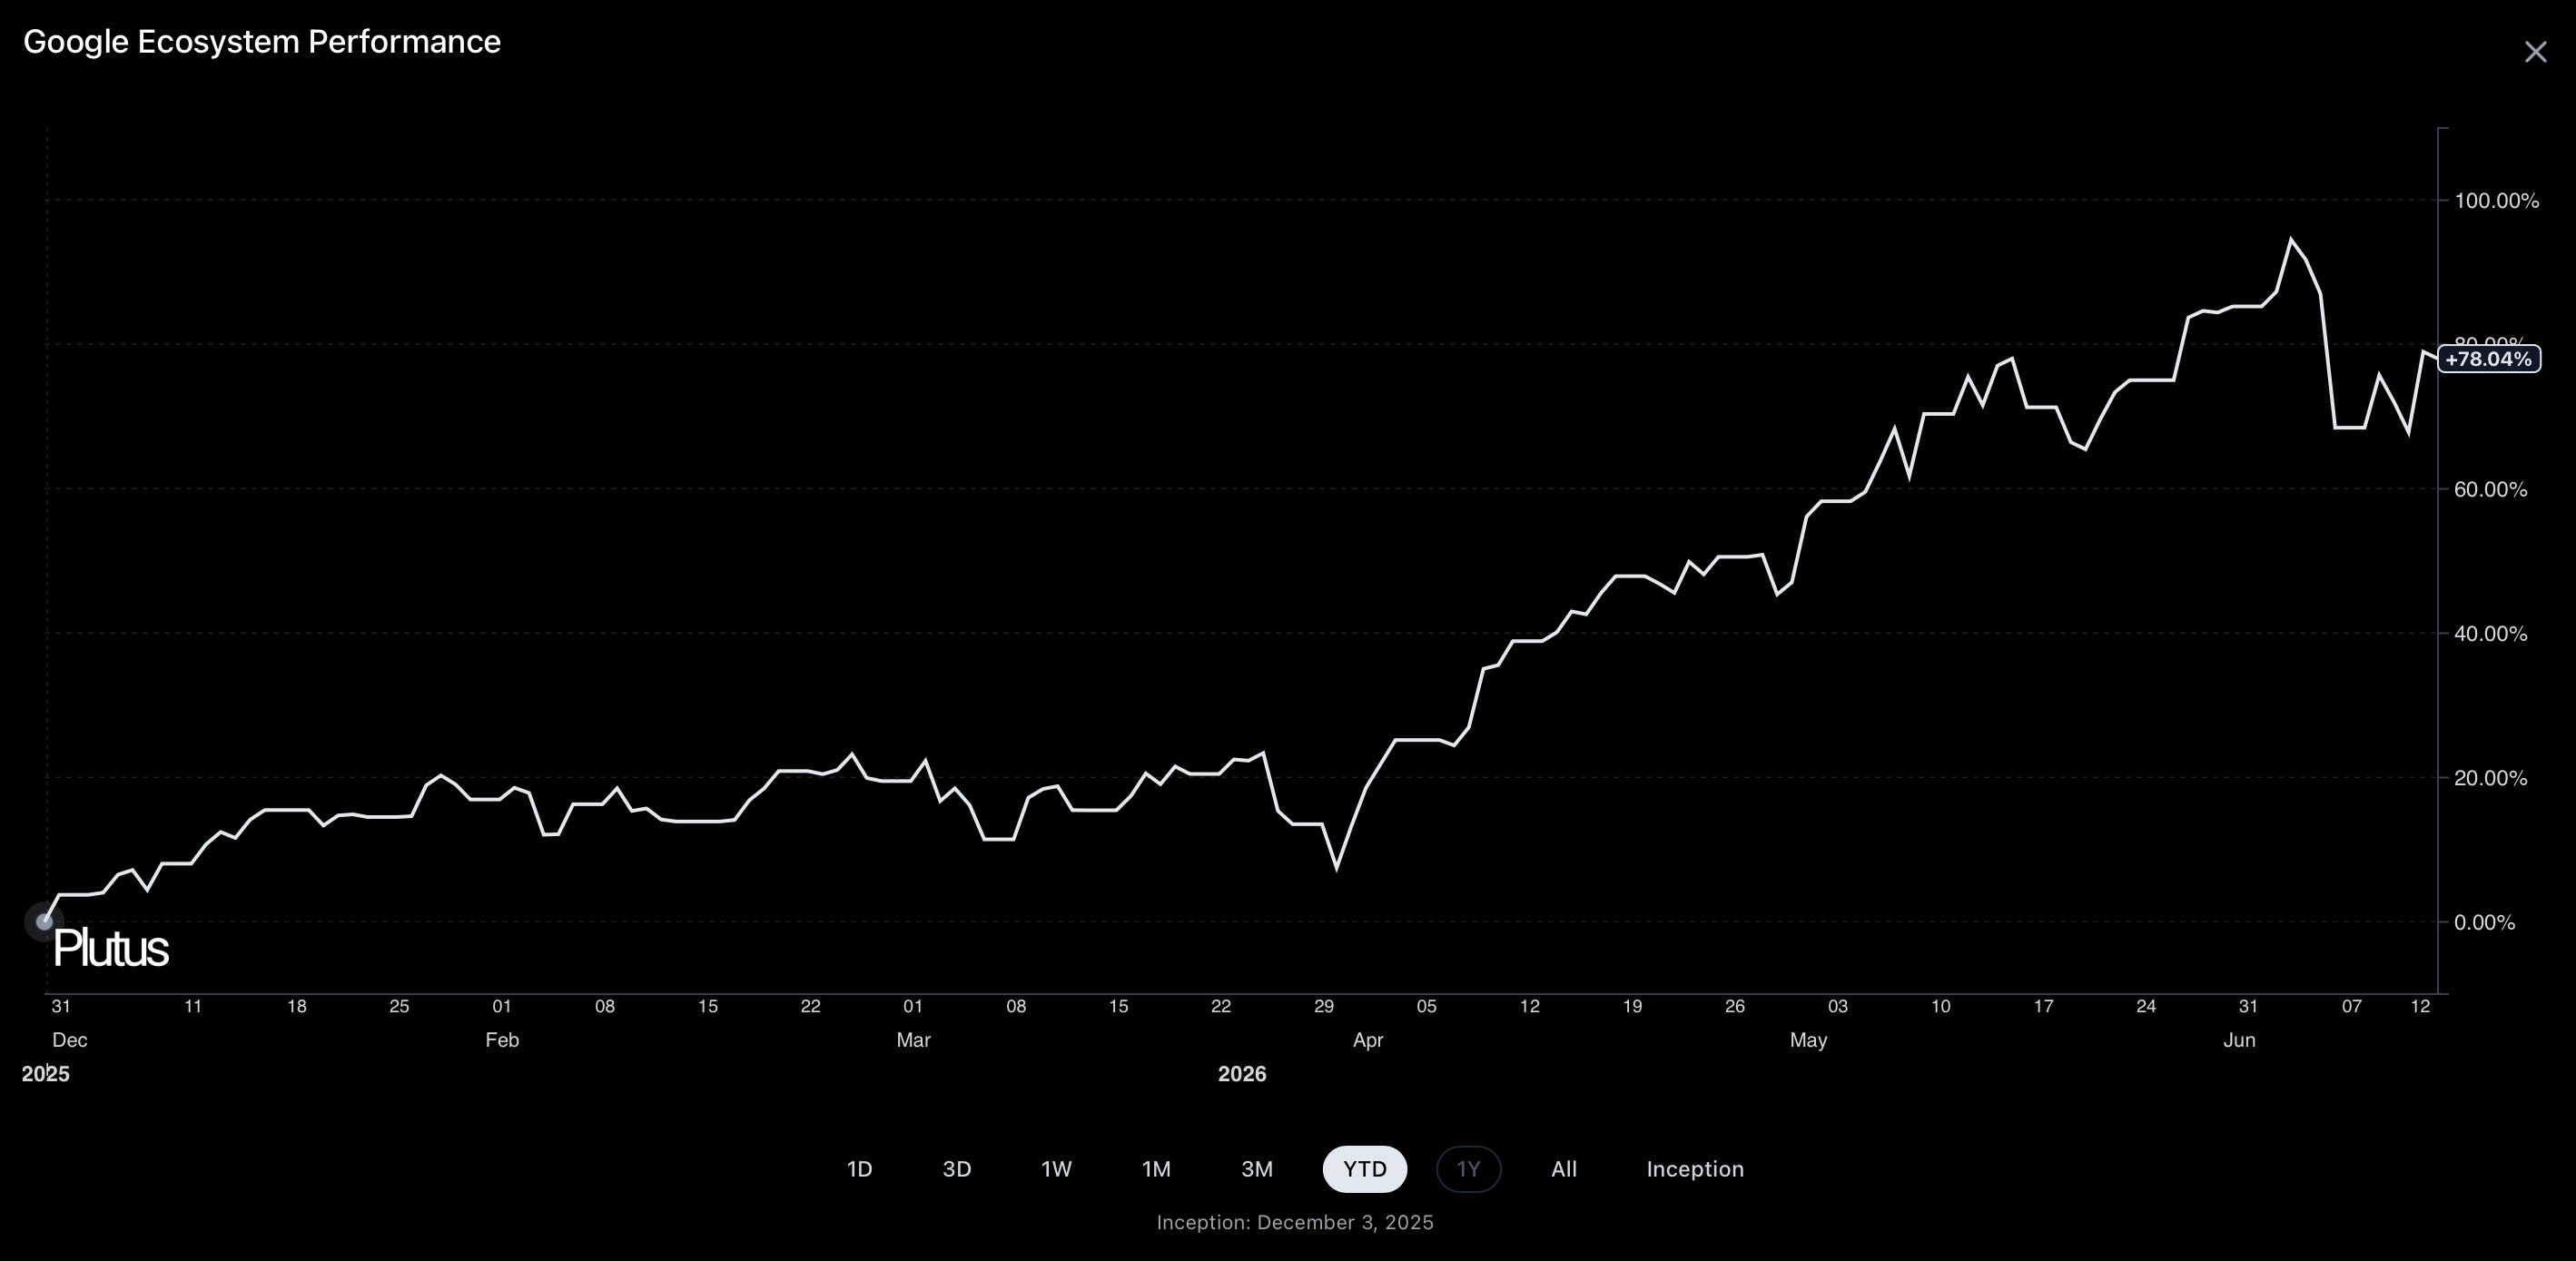
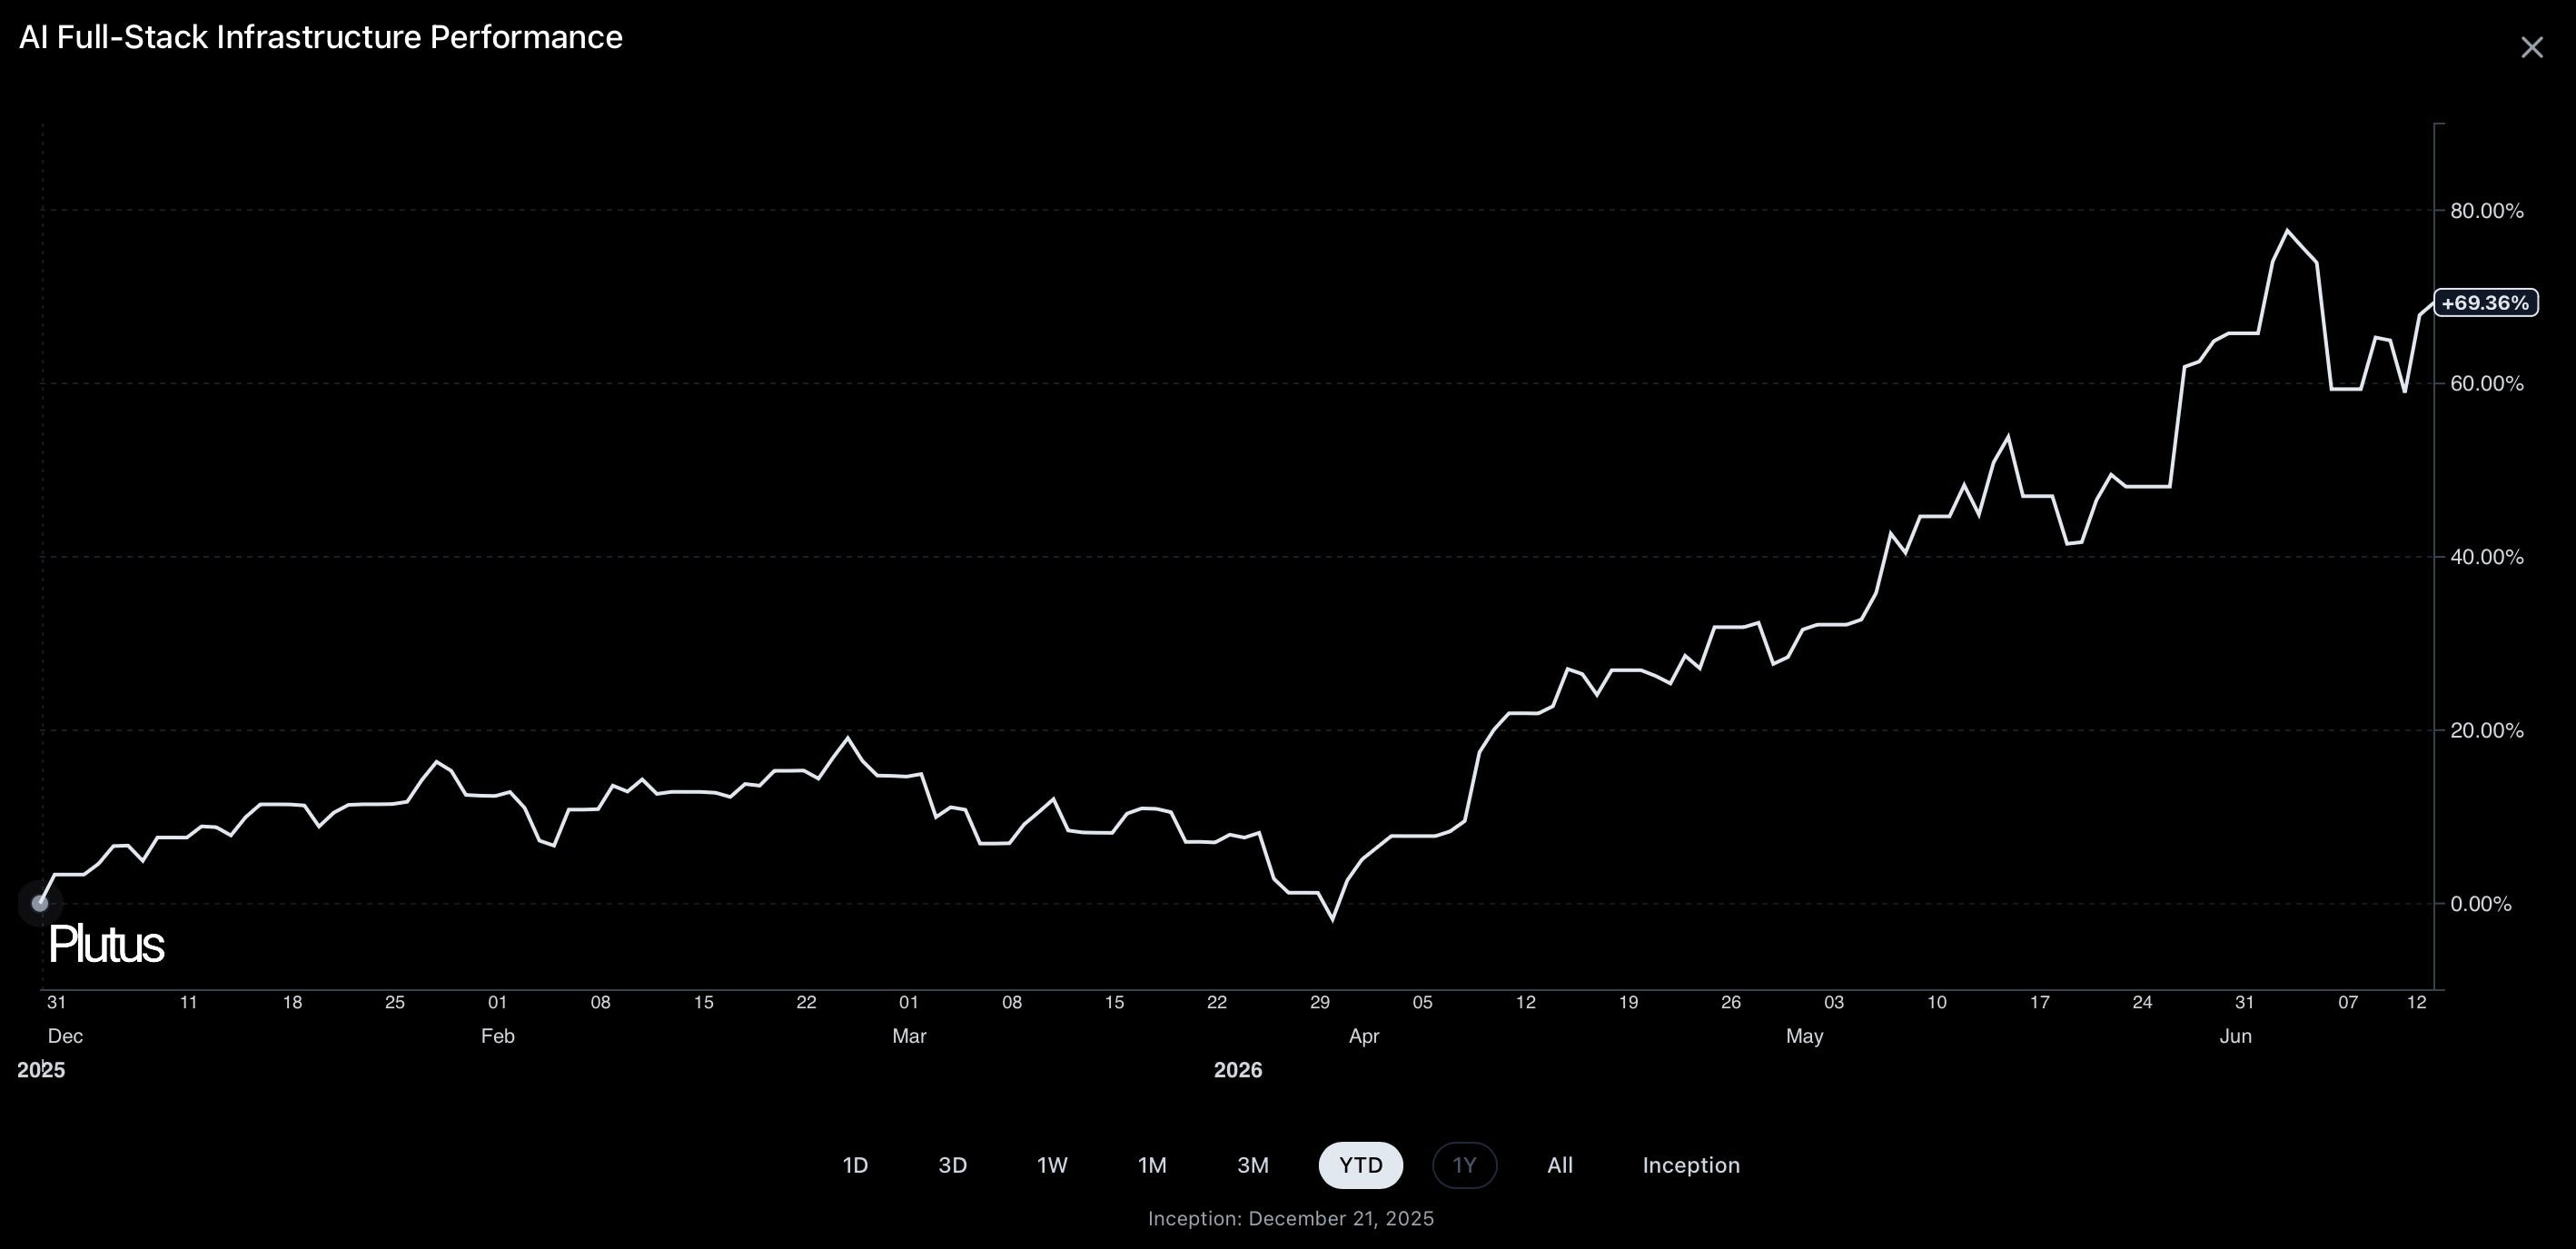
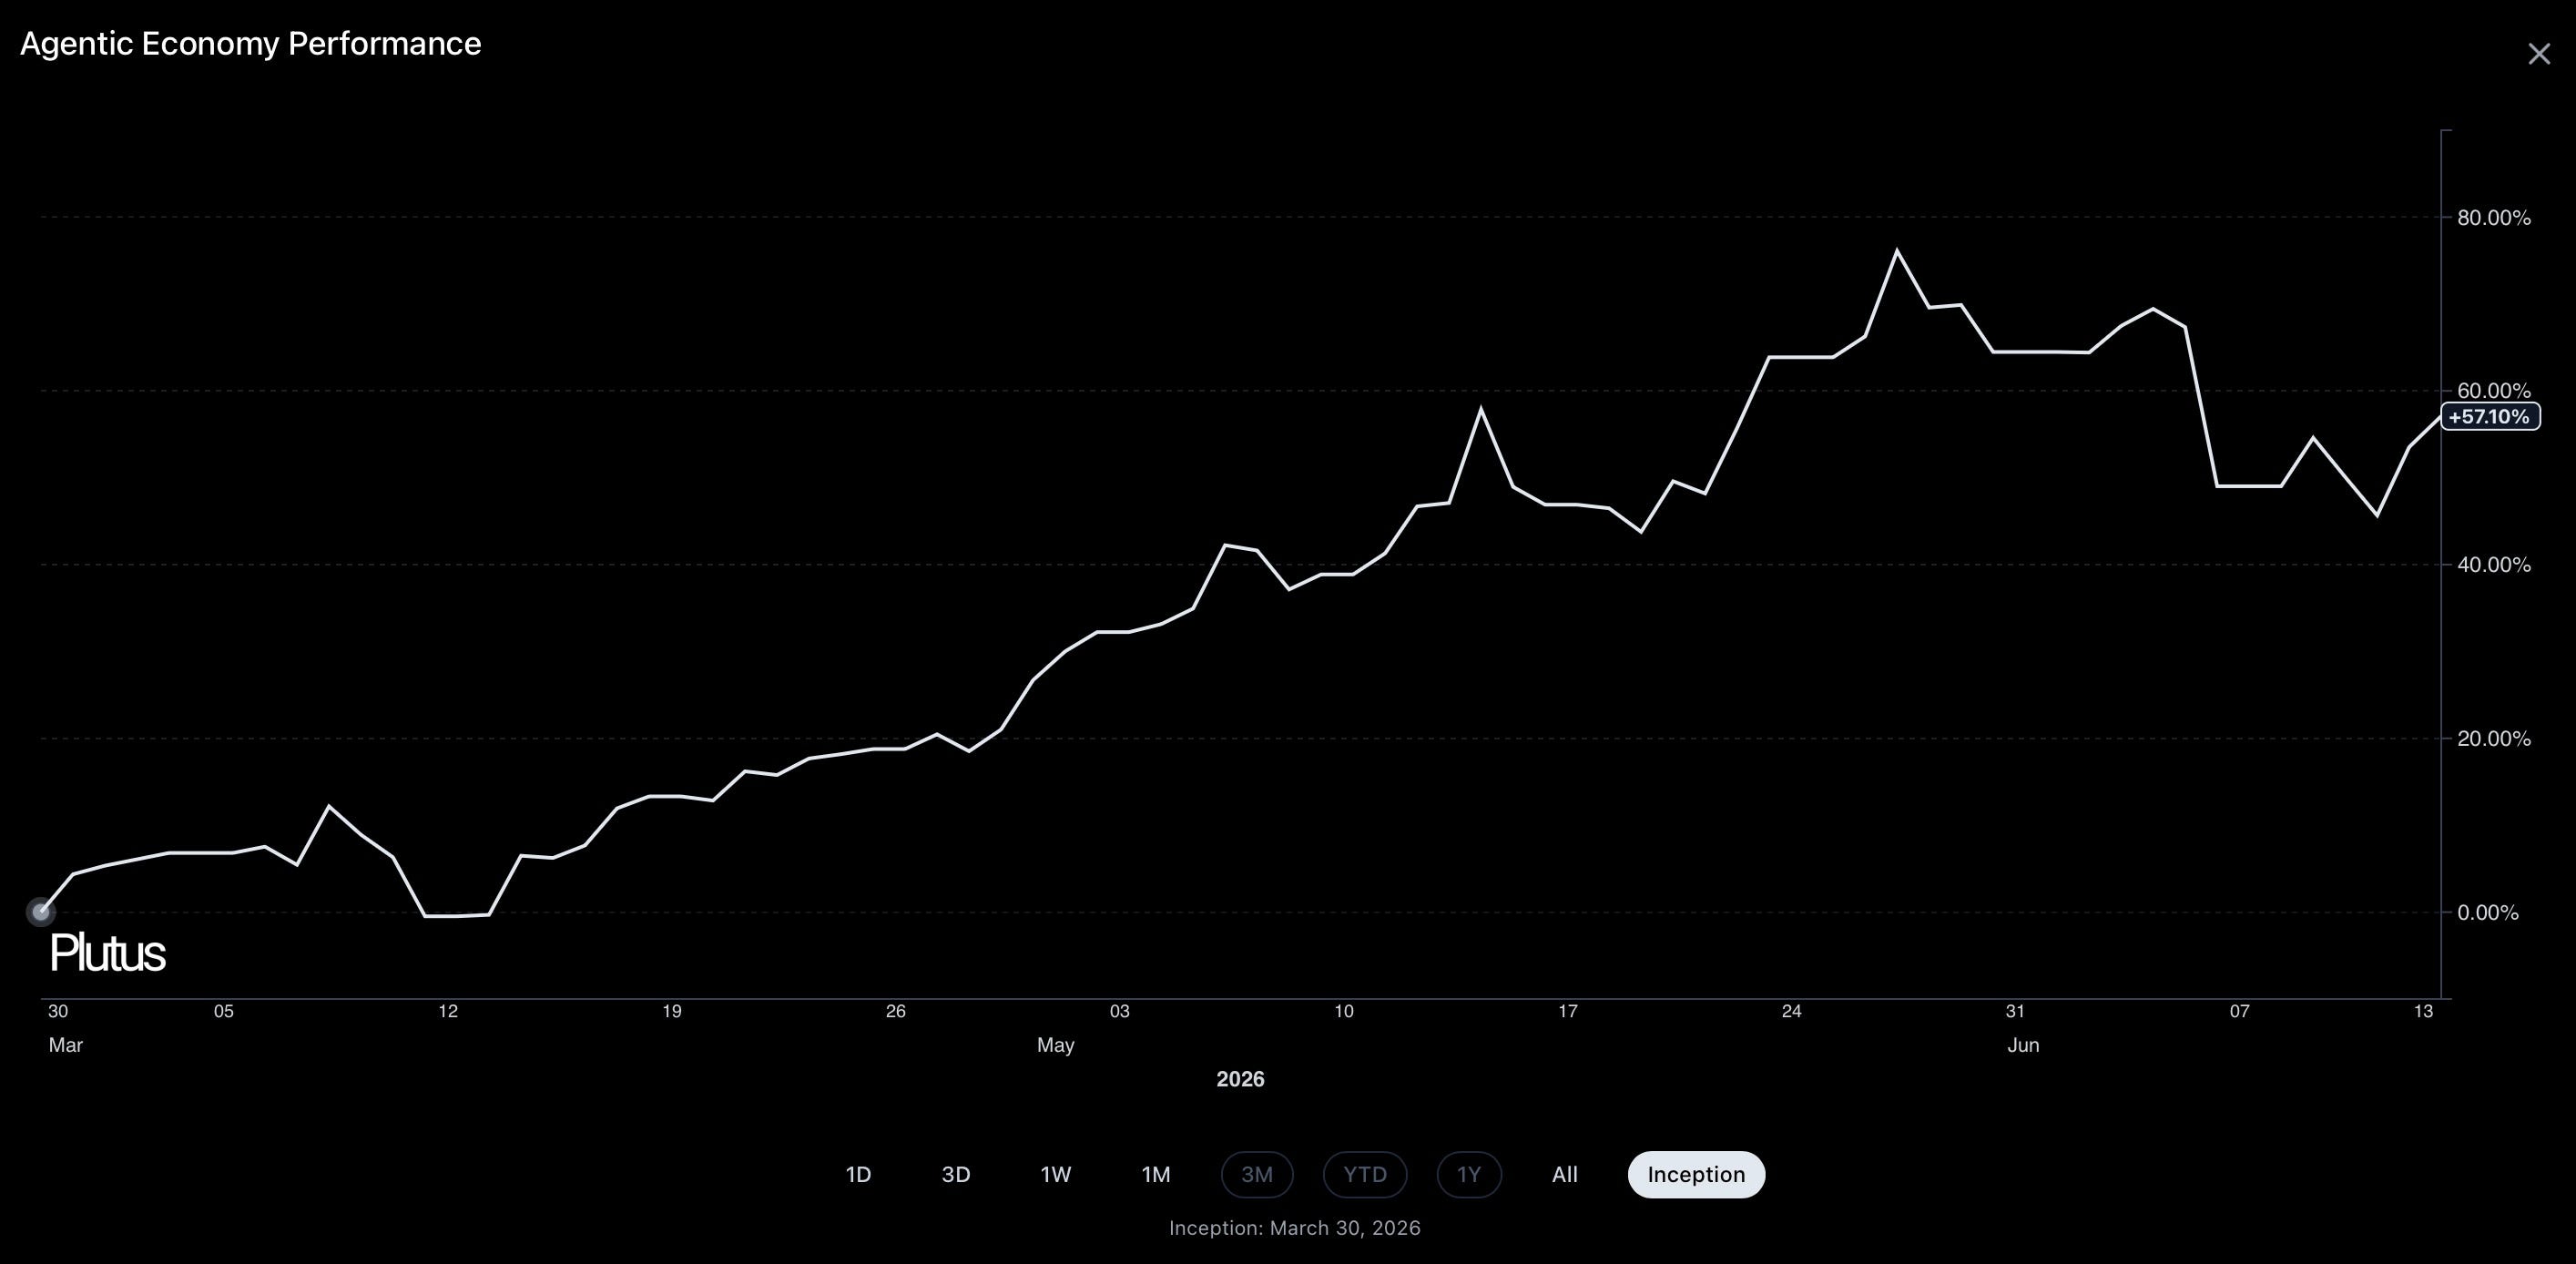
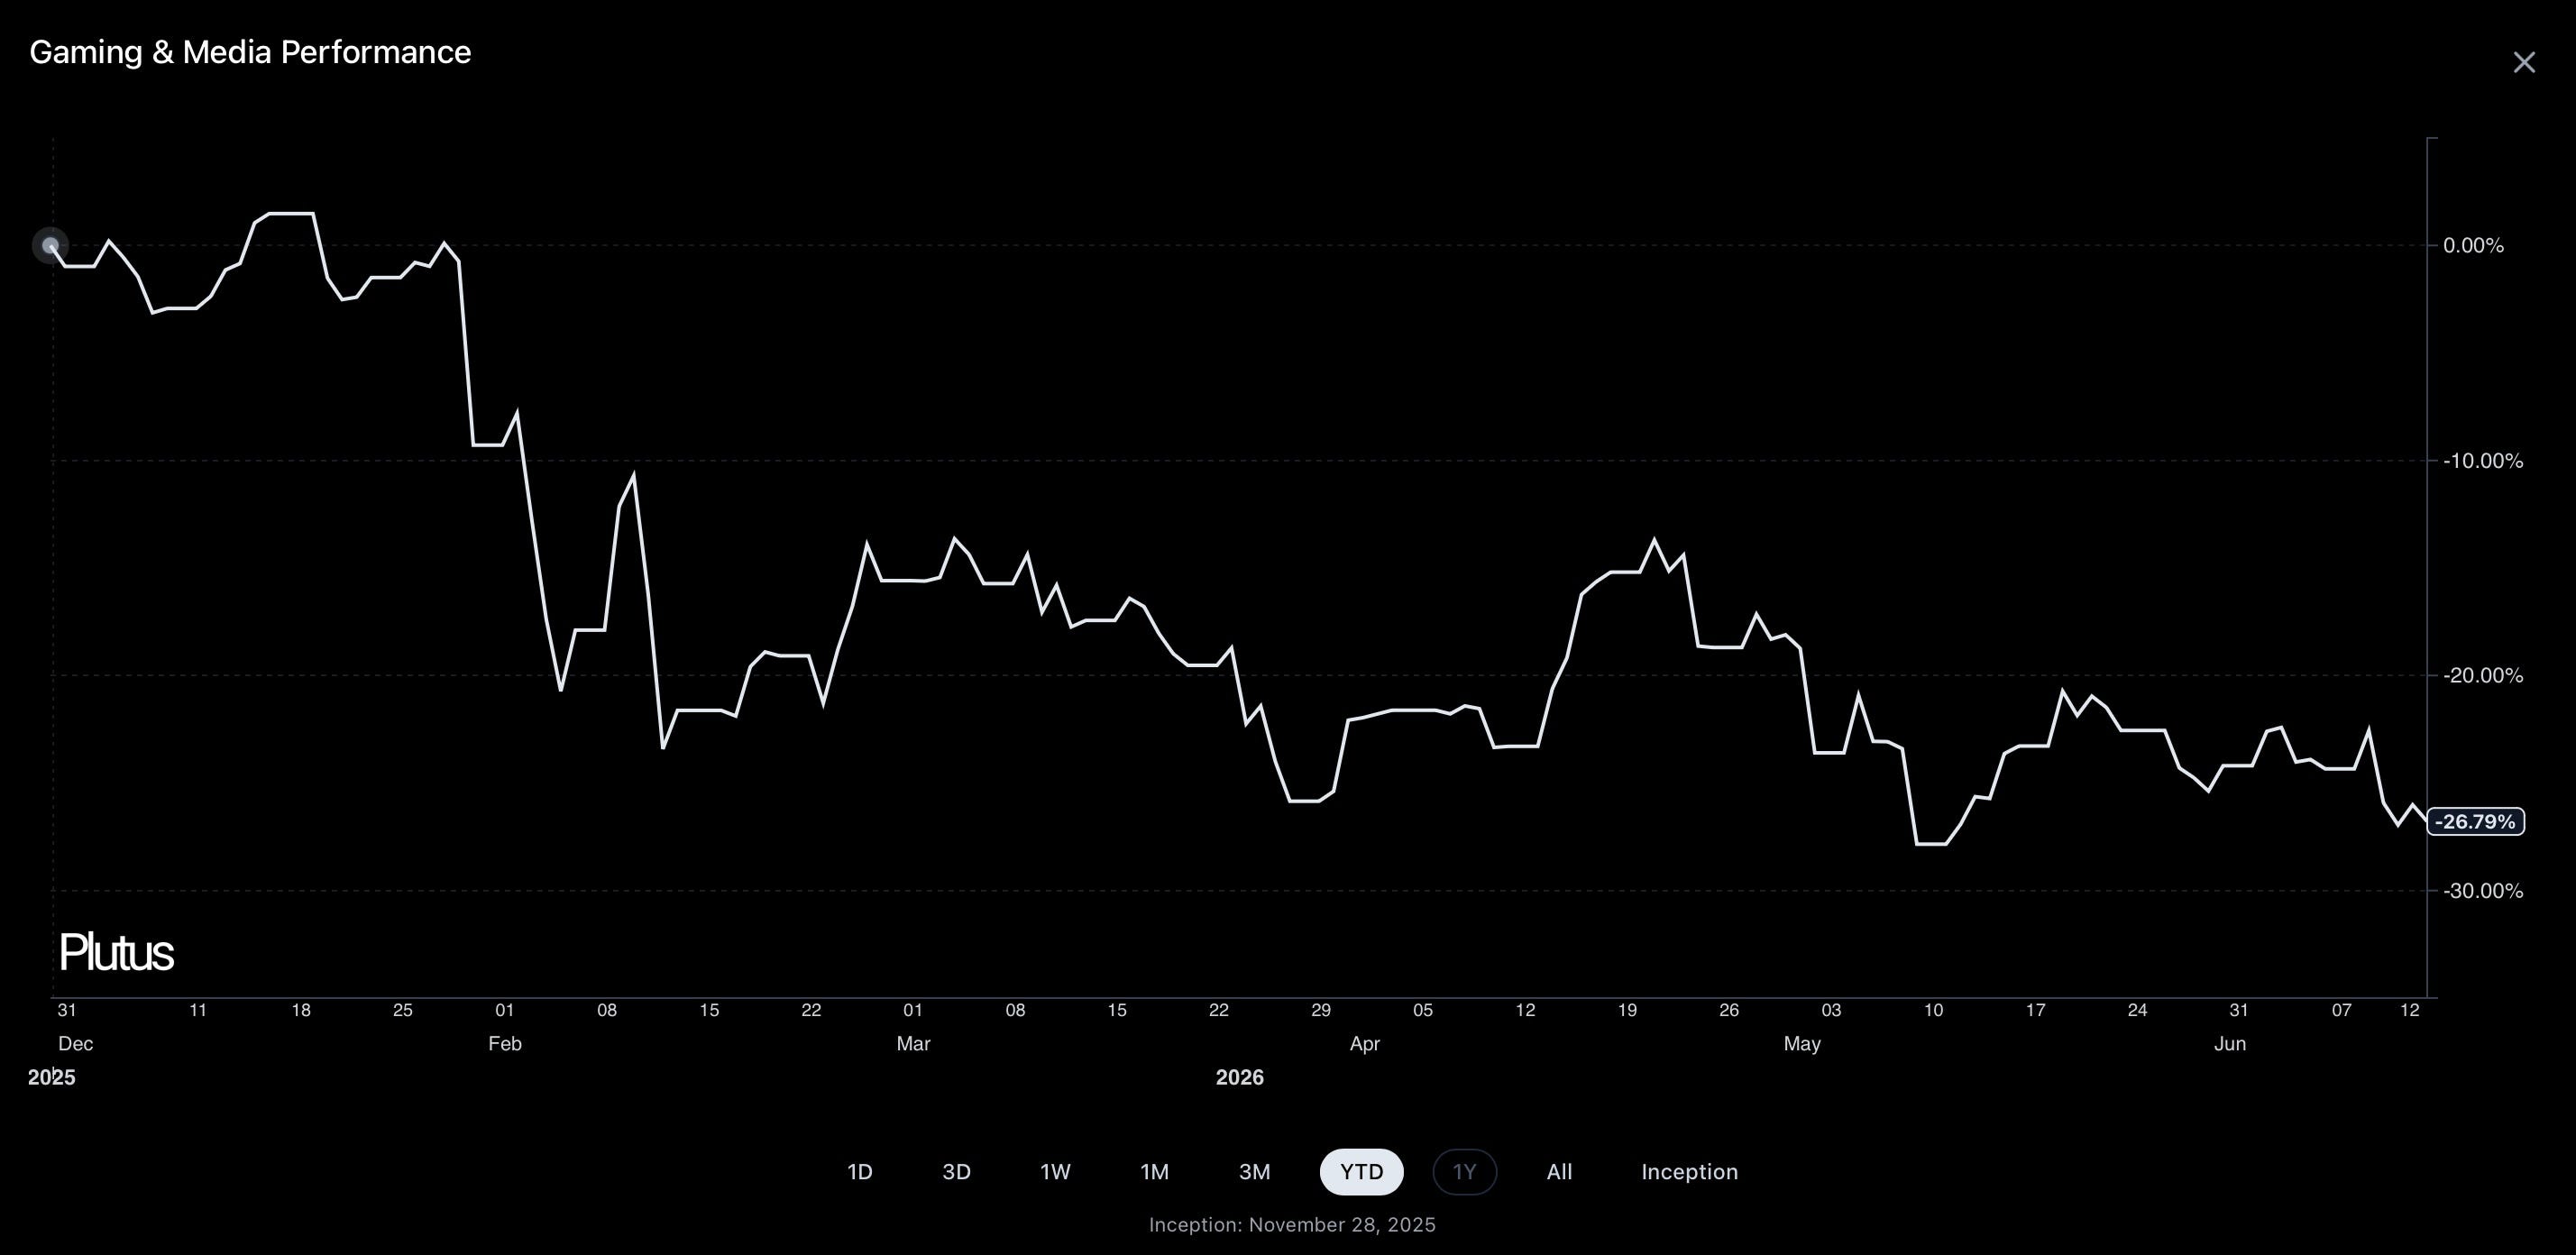
And in regard to the specific factors and or ‘baskets’ we’ve built on Plutus, here are the best performers year-to-date:
1. Industrial and Auto Analog Recovery
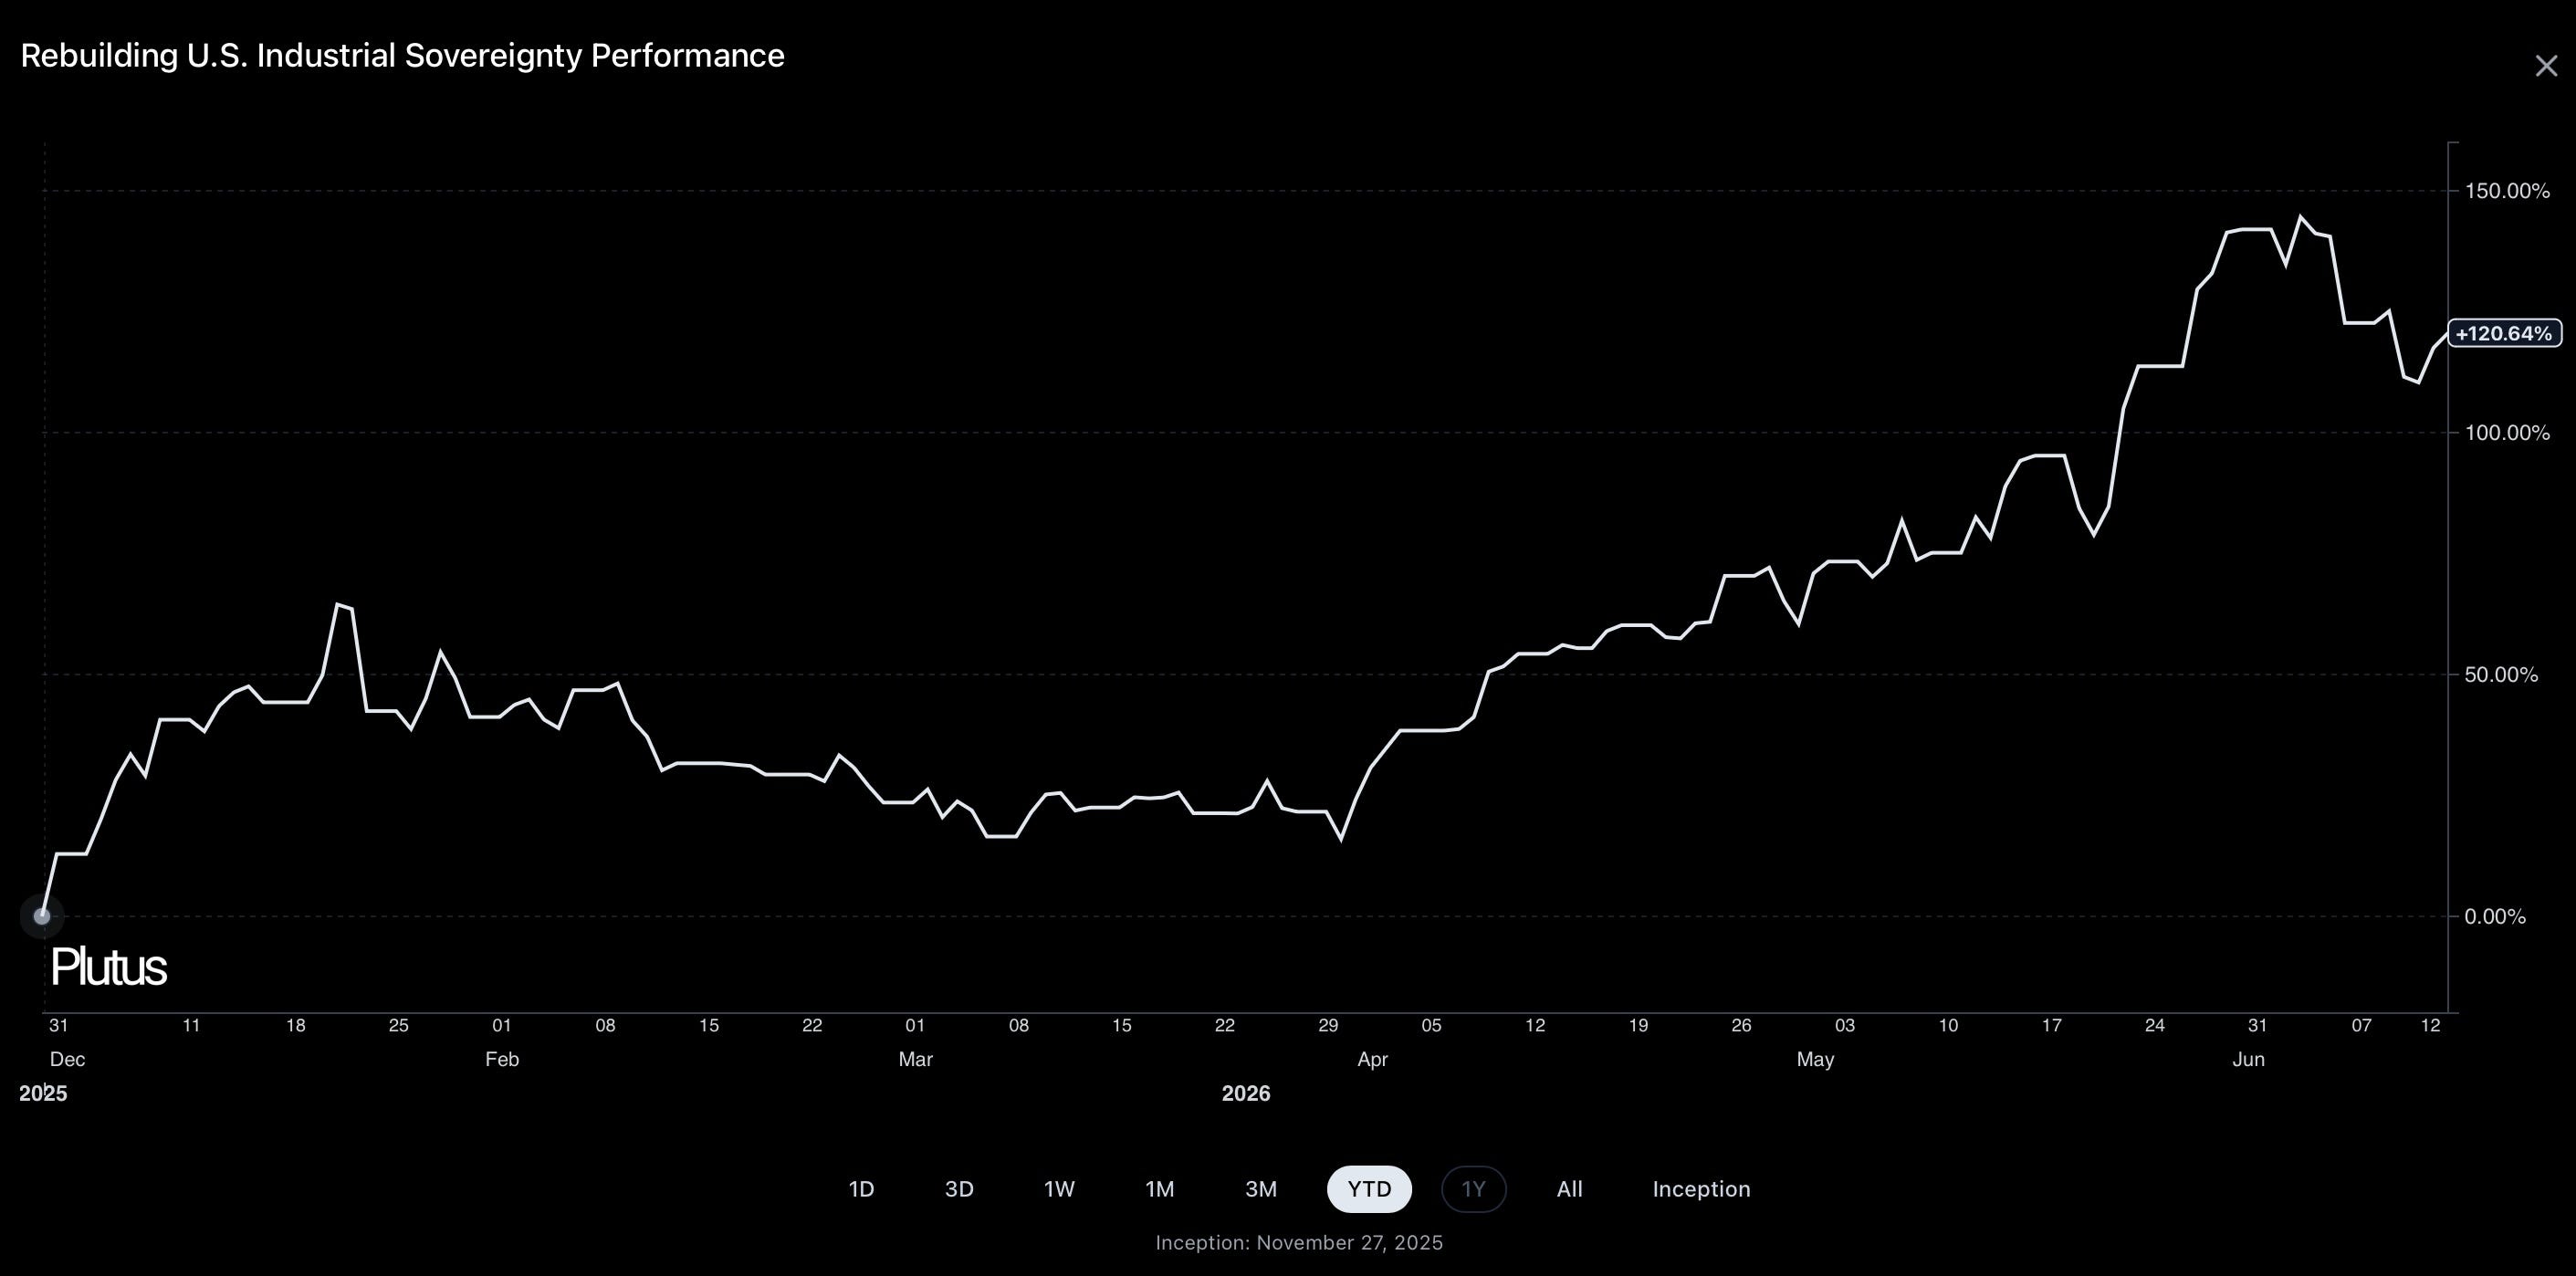
2. Rebuilding U.S. Industrial Sovereignty
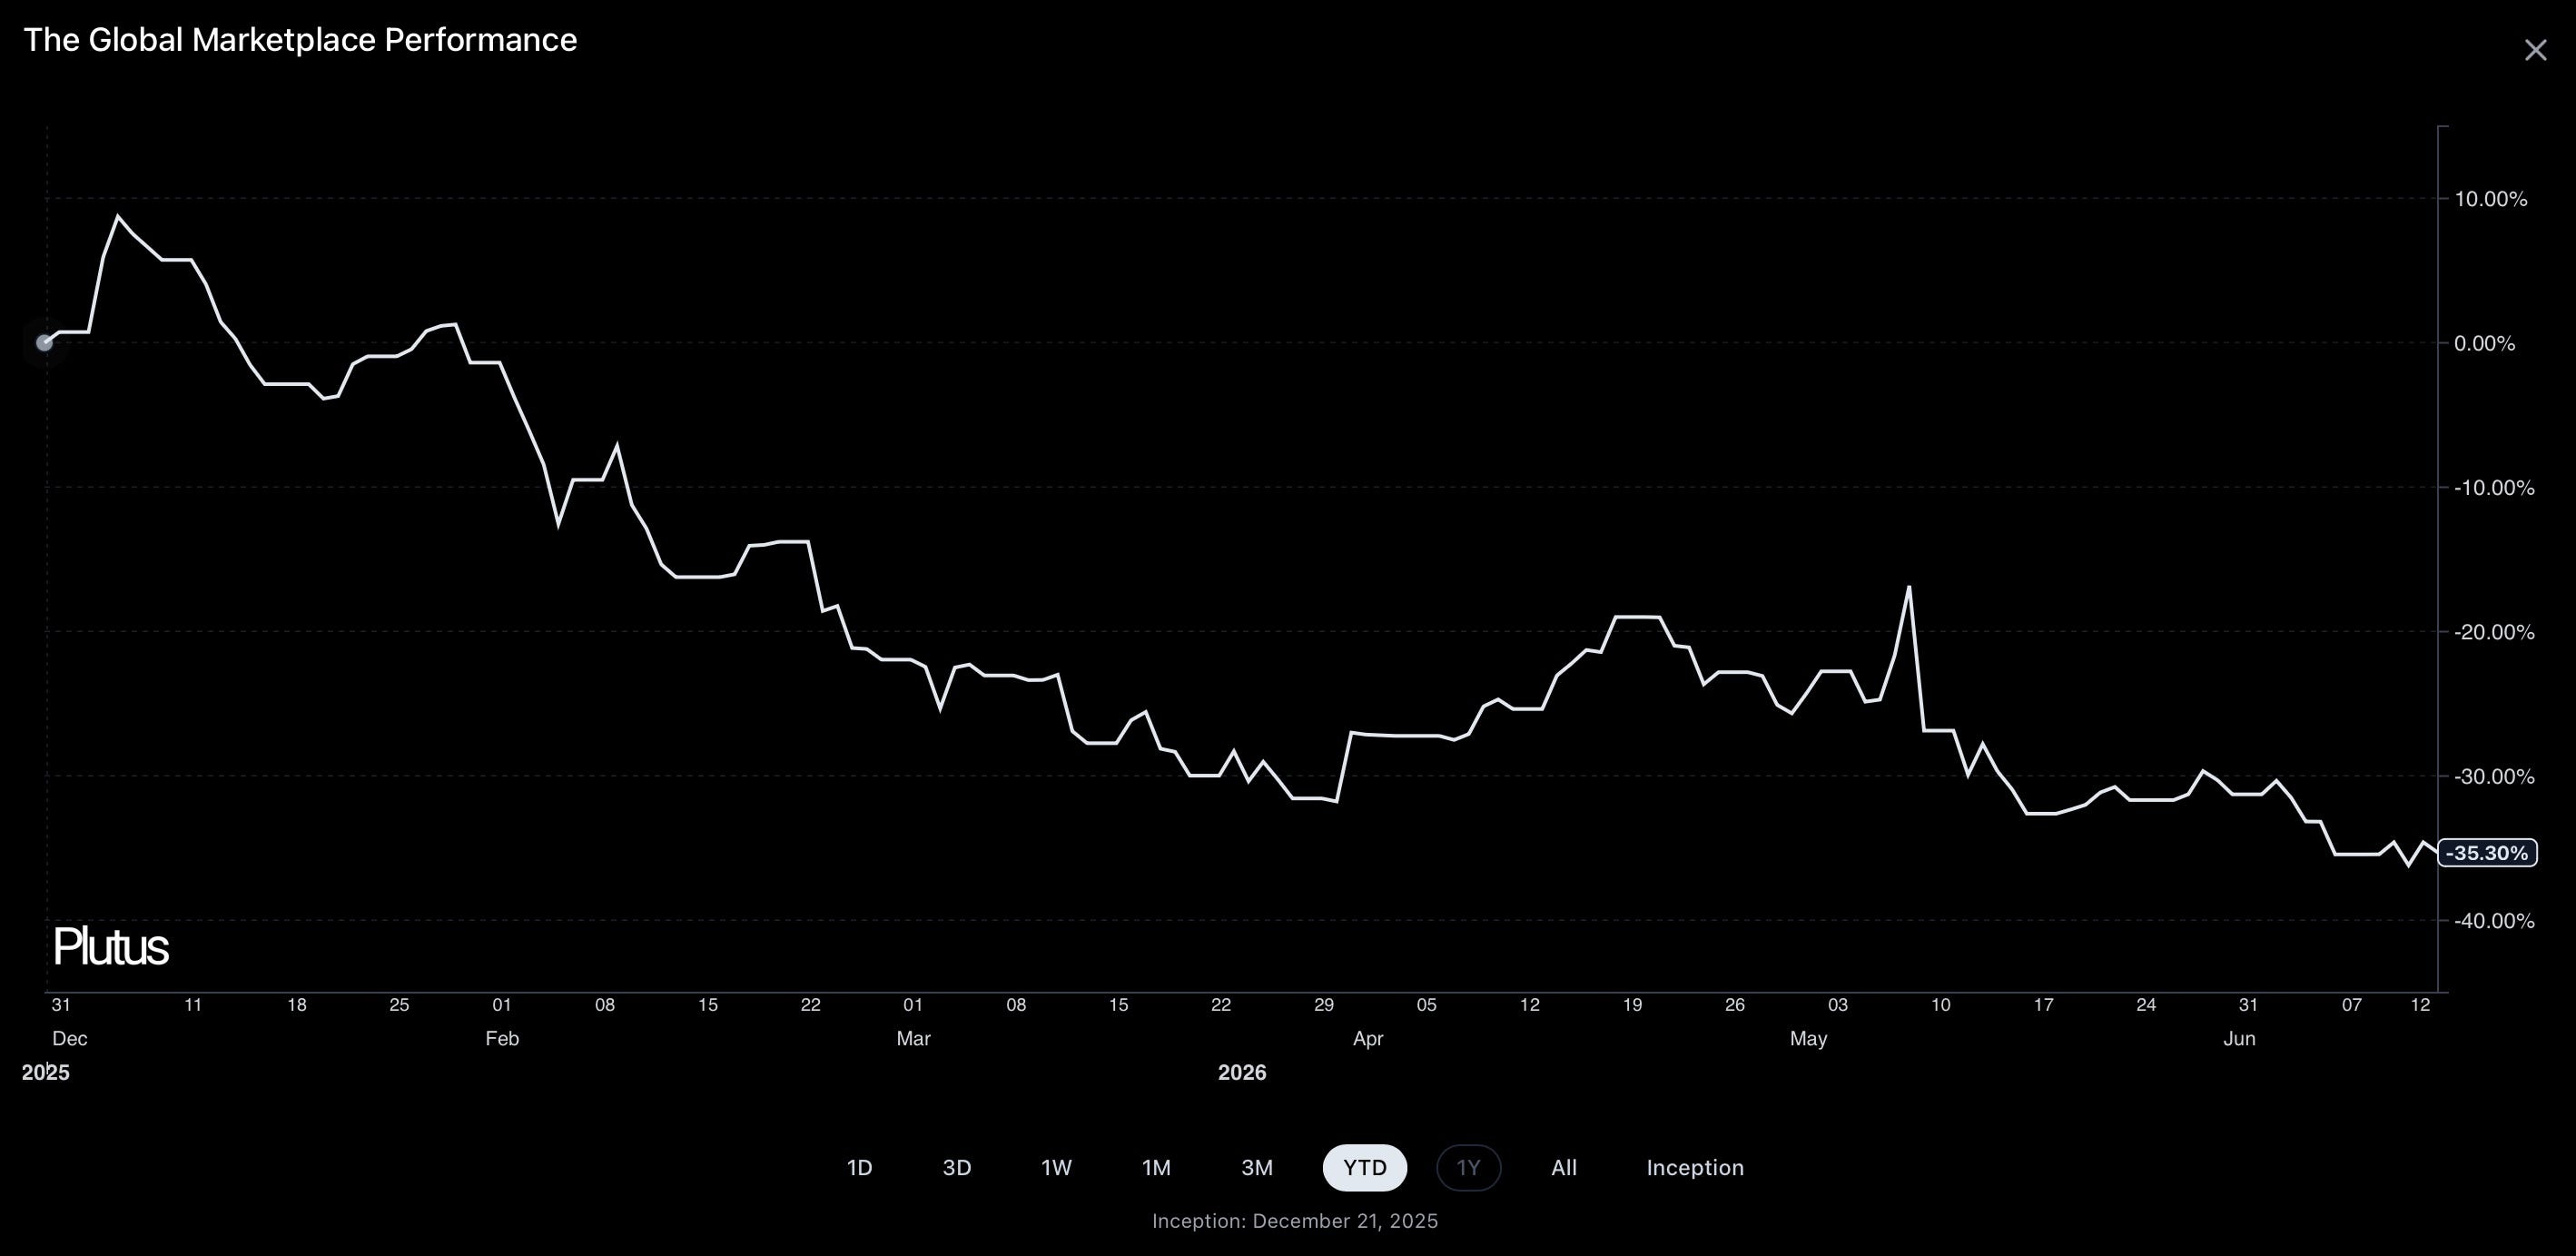
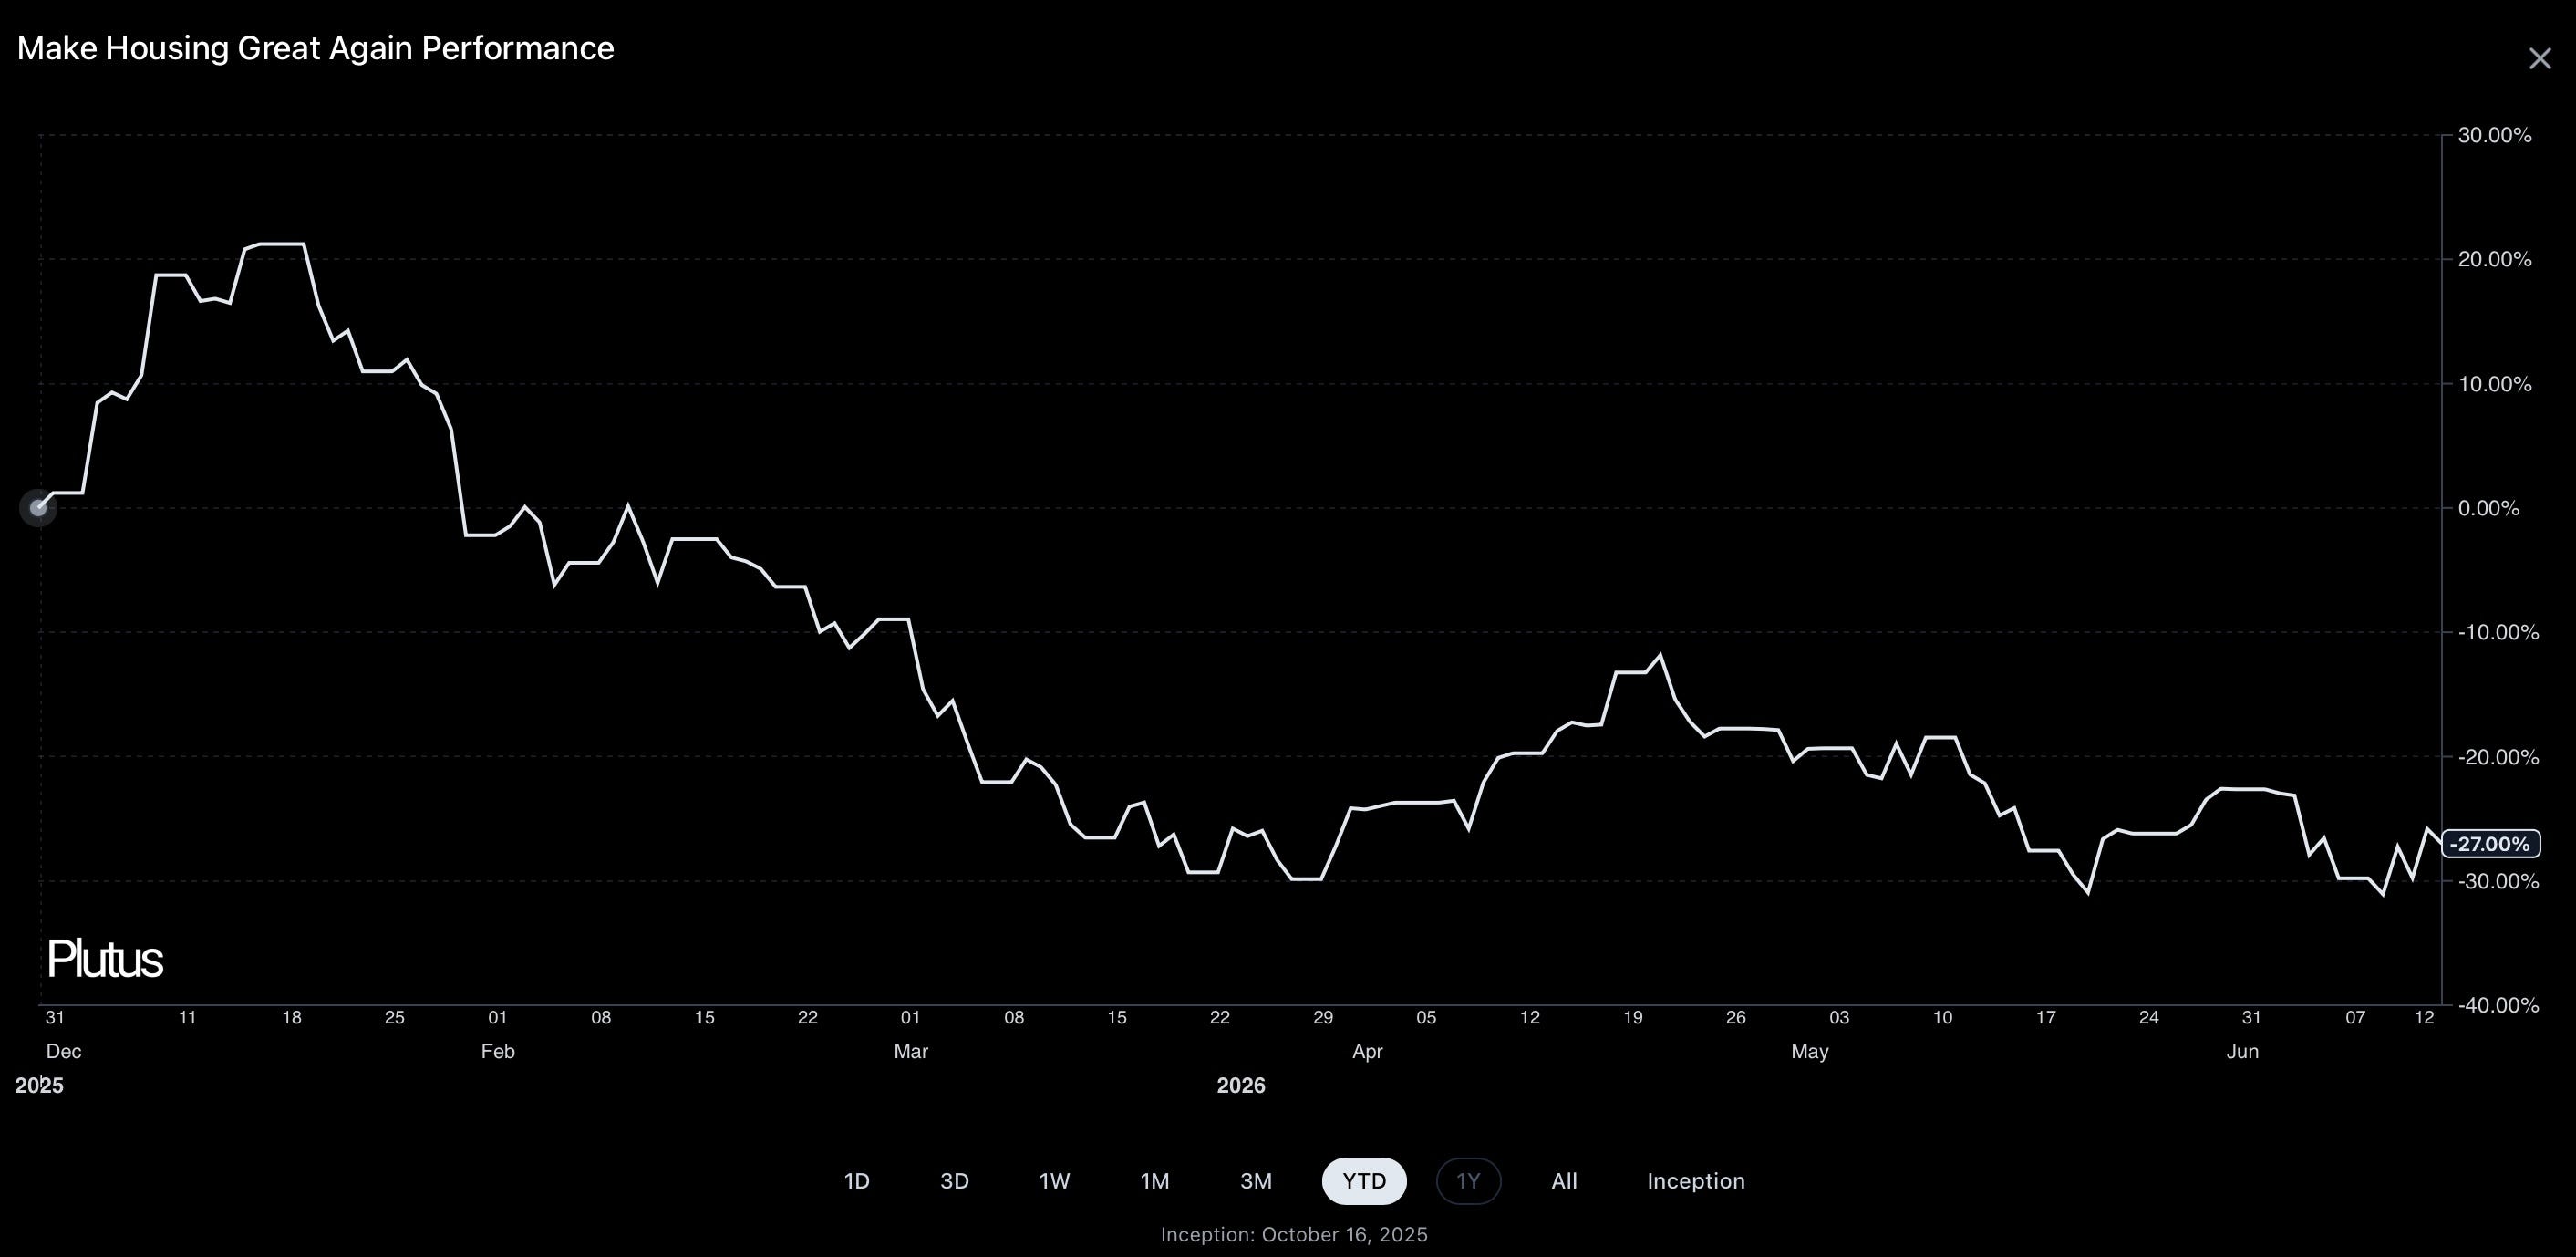
Whereas on the flip side, the worst performing baskets year-to-date have been:
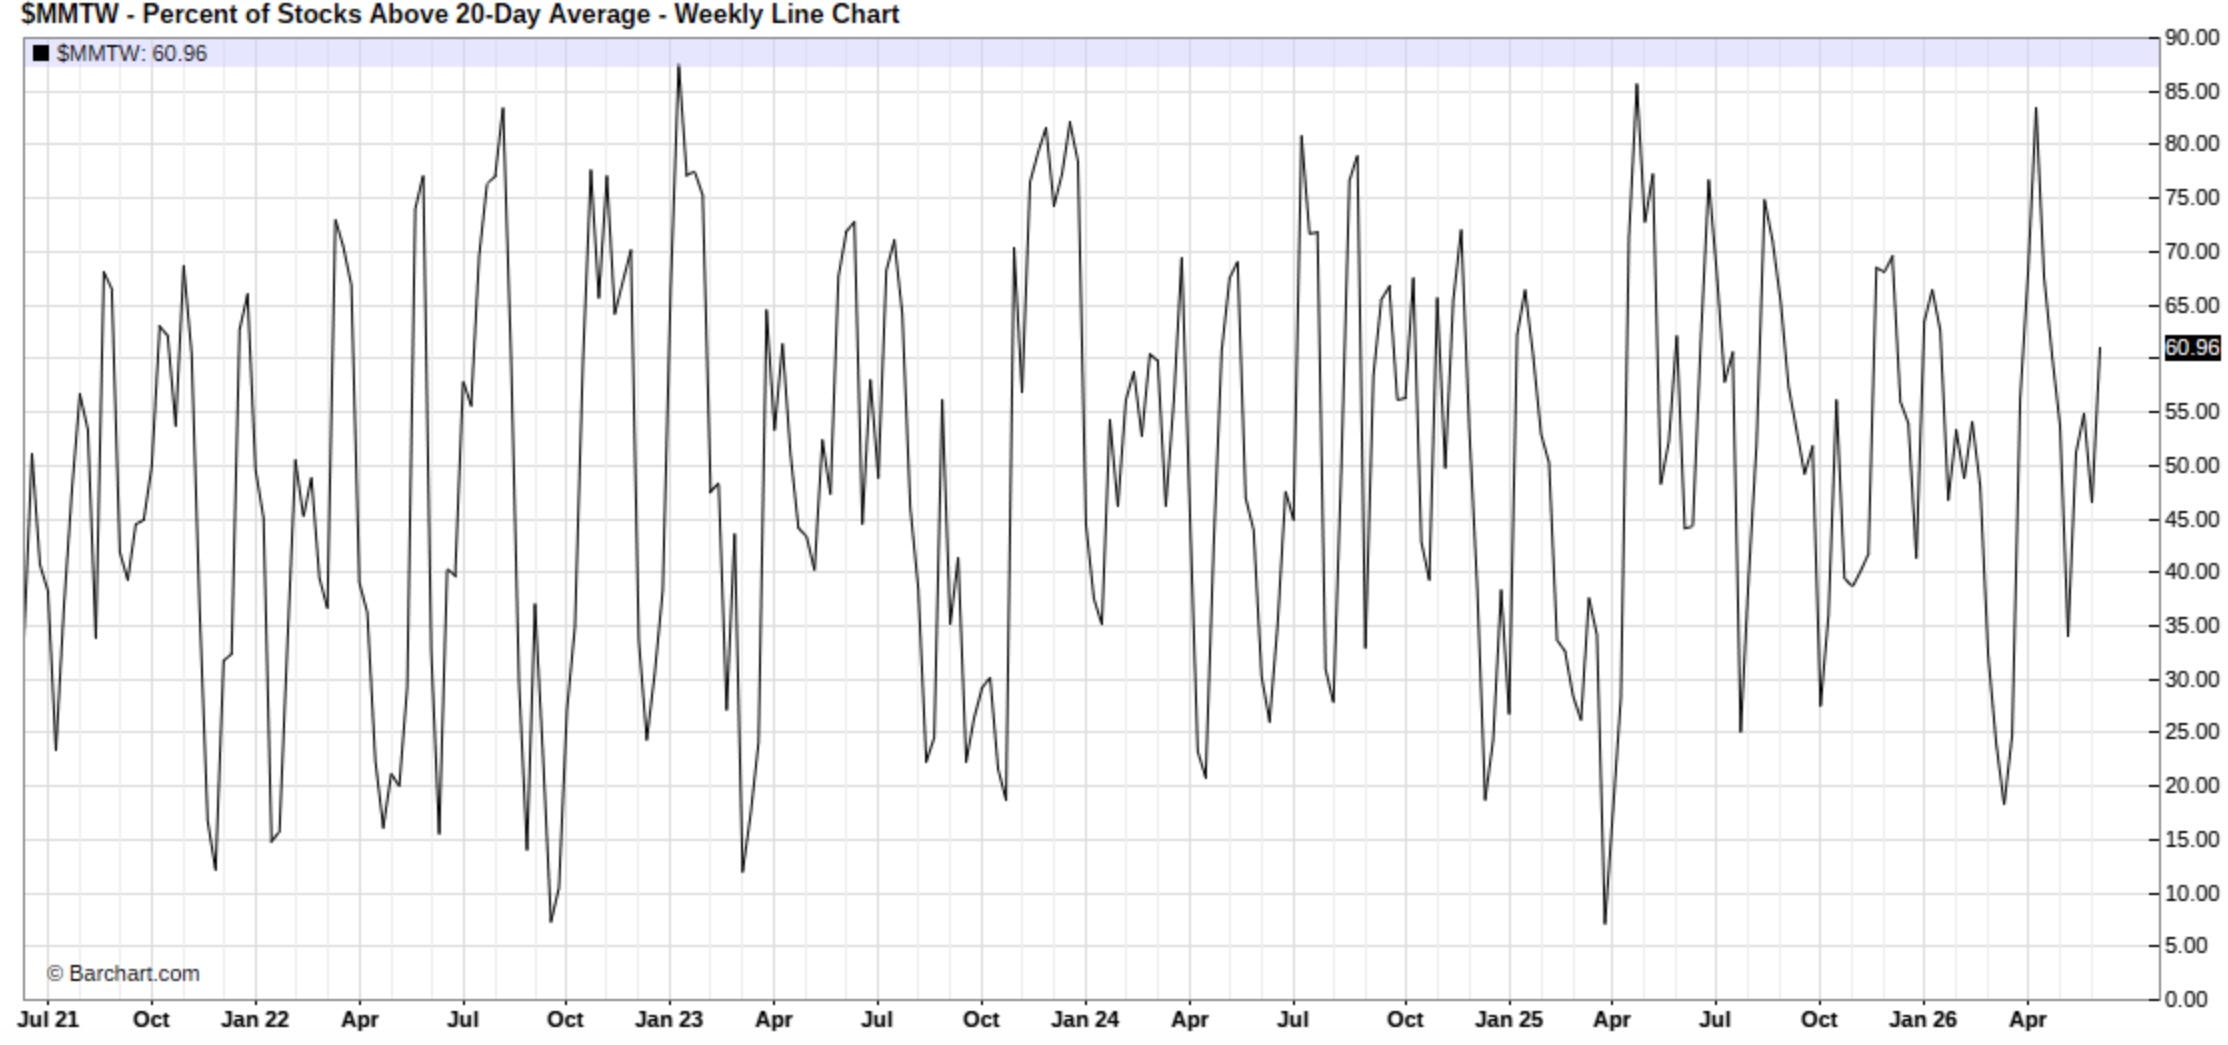
Moving along, despite the indices being off ATHs, Spooz & the Q’s more specifically, upside participation & overall breadth has picked up by quite the margin, which has more so led to an overall bifurcation of the indices & this recent decline has really just been solely driven by an unwind in tech, but as a result of the recent bifurcation under-the-hood, 60% of stocks remain above the 20D, which is now slowly starting to work its way out of neutral territory & back toward shorter-term ‘overbought’ territory.
And similar can be said on a more broader timeframe too as despite the unwind within the indices, still 56% of stocks remain above the 50D, which paints a somewhat different picture than the above as the reading isn’t necessarily an overbought & or oversold signal & instead still paints a more neutral picture.
That said, despite indices being just off the highs & having posted a rebound into the latter half of this past week following the MOU reached between the U.S. & Iran, the Fear-Greed index still remains well into ‘Fear’ territory, which again just emphasizes that markets still remain far from ‘true euphoria’ or the type of positioning extremes typically associated with major & or even interim tops.
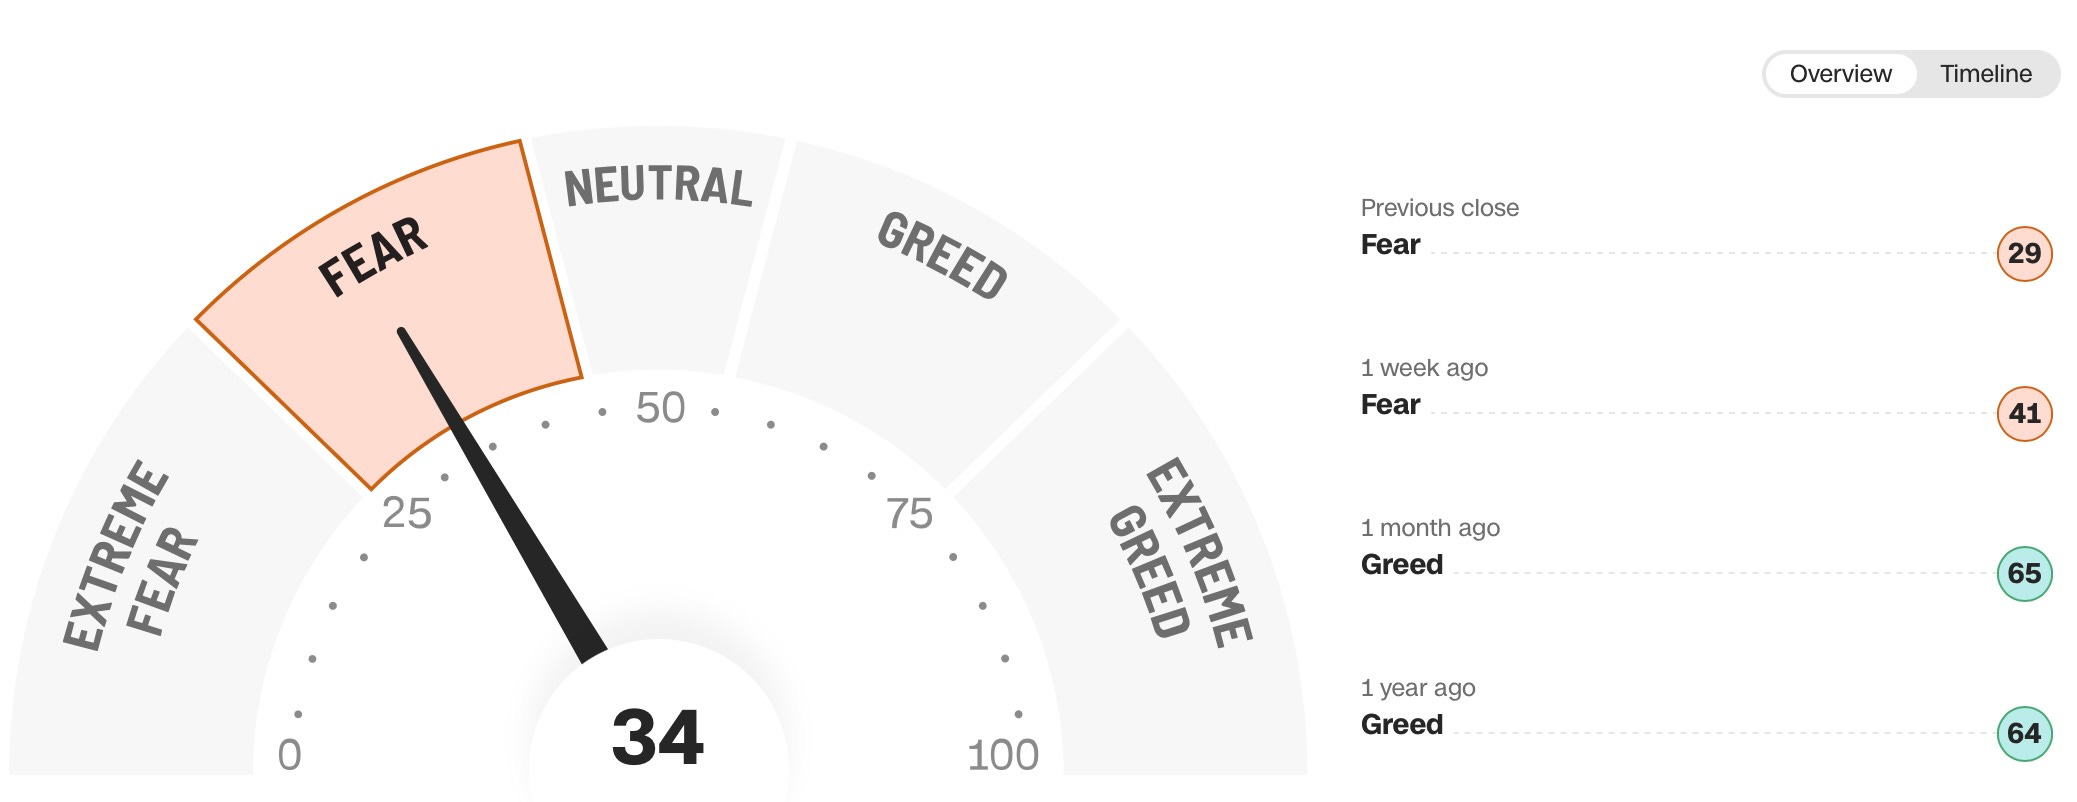
Historical context of the Fear-Greed Index overlaid with the S&P:
